assuming that the rock has some mechanical strength. If the permeability ... a given rock or other porous composite. We will show ... u = ^z(A0=ik) expi(kz ?!t);. (1).
ROCK ELASTIC PROPERTIES: DEPENDENCE ON MICROSTRUCTURE
James G. Berryman and Patricia A. Berge Lawrence Livermore National Laboratory P. O. Box 808 L-202 Livermore, CA 94551-9900
ROCK ELASTIC PROPERTIES: DEPENDENCE ON MICROSTRUCTURE James G. Berryman and Patricia A. Berge Lawrence Livermore National Laboratory P. O. Box 808 L-202 Livermore, CA 94551-9900 ABSTRACT Depending on the details of the composite microstructure, di�erent theories may be needed to obtain good agreement with measured elastic properties. This observation is especially pertinent whenever porosity is present in the composite, as is normally true for rocks. Predictions of two e�ective medium theories are compared to data for porous glass samples. The differential e�ective medium (DEM) theory does a good job of predicting elastic behavior of a porous foam composed of glass. The self-consistent (SC) e�ective medium theory does equally well at predicting the behavior of a sintered glass-bead sample. We nd that the realizable microstructure of each theoretical model is a good analog of the microstructure for one or the other of these two very di�erent porous glasses. Hashin's composite spheres assemblage model is also found to be a good model of the porous glass foam. INTRODUCTION E�ective elastic properties of composites depend on the elastic constants, the volume fractions, and the spatial arrangement (microstructure) of the constituents. The relative importance of these three types of variables (elastic constants, volume fractions, and microstructures) is complicated, but certain general rules may be inferred from rigorous bounds such as those of Hashin and Shtrikman (1962, 1963). If the range of variation in the elastic constants among all the constituents is small, then the possible range of variation in the overall elastic constants of the composite is also small and only weakly dependent on volume fraction and microstructure. On the other hand, if the range of variation of the constants is large, then the dependence on volume fraction and microstructure can also be large. One of the most common characteristics of rocks is the presence of porosity and/or microcracks. In terms of the preceding discussion, voids act like a constituent with null elastic constants. Thus, rocks virtually always have a wide range of constituent constants and, therefore, always have properties strongly dependent on their microstructure. That is why the theme of our paper concerns the importance of microstructure in porous composites. There are many measures of the microstructure of a composite and discussion of microstructure often centers on statistical measures of its three-dimensional topology (Torquato and Stell, 1
1983; Berryman, 1985; Berryman and Milton, 1988; Torquato, 1991a,b). However, one feature of the microstructure is often crucial to modeling: Is there an identi able host medium for the composite? Or, saying this another way: Is there a single material within which all other constituents may be viewed as inclusions? If there are only two constituents in a random medium, then in three dimensions it can happen that both constituents form in nite (percolating) clusters or it can happen that only one constituent forms an in nite cluster. To illustrate this point, consider porous rocks having either nite permeability or zero permeability. In either case, the solid constituents must form an in nite cluster that supports external stress, assuming that the rock has some mechanical strength. If the permeability is nite, then the pore space also forms an in nite connected cluster across the sample allowing uid to ow; if the permeability is zero, then the pore space is not fully connected and there is no in nite pore cluster. Although this di�erence might appear to have trivial consequences for the mechanics of rocks, this distinction is actually crucial when attempting to choose the best method to model a given rock or other porous composite. We will show examples of two types of porous glass, alike in every respect except microstructure, that have very di�erent mechanical behavior at high porosities. THEORIES CORRESPONDING TO PARTICULAR MICROSTRUCTURES In this section, we present a brief review of three theories of composite elastic constants. A more comprehensive review of the history of this subject has been presented previously by Berryman (1992). In the present work, we emphasize theories that are known to correspond to particular microstructures, and subsequently compare the predictions of the theories to experimental results on two distinct types of porous glass whose microstructures resemble those associated with the theories. The common theories of composites may be derived using either a scattering-theory approach, or using a purely static analysis. One reason for preferring the dynamic derivation is that much of the data on composite elastic properties is obtained from ultrasonic measurements; the analysis is then conceptually closer to the methods actually used in these experiments. The three approximations for e�ective elastic constants considered in this paper are: Hashin's composite spheres assemblage (H), the di�erential e�ective medium (DEM) method, and the self-consistent (SC) method. To provide a simple review of the nature of these approximations and to compare and contrast these methods, we rst quote results for elastic scattering from isolated spherical inclusions of radius b imbedded in an in nite host. The host medium has bulk modulus K and shear modulus G. The spherical inclusion has bulk modulus K 0 and shear modulus G0 . If an incident compressional wave has the form u = z^(A0=ik) exp i(kz ? !t);
(1)
where k is the wavenumber, ! is the angular frequency, and A is the amplitude of the dilatation (r � u), then the radial component of the scattered wave eld is 0
ur = (ik)? exp i(kr ? !t) [B ? B cos � ? B (3 cos 2� + 1)=4] : 1
0
1
2
(2)
These scattering coe�cients Bi for i = 0; : : : ; 2 are well-known [see Kuster and Toksoz (1974)]. 2
The rst scattering coe�cient is 0 B = ? k b3 A KK0 +? KG :
(3)
0?G B = k b3 A 3(K10+G2G) G G0 + F ;
(4)
F = (G=6)(9K + 8G)=(K + 2G):
(5)
3 3
0
The third coe�cient is
0
4 3
3 3
2
0
where The coe�cient B depends on material densities. Based on this coe�cient, the methods used here always show that the e�ective density is just the volume average of density (Berryman, 1980). We will use the convention that e�ective constants are distinguished by the � superscript (e.g., K � and G� ). 1
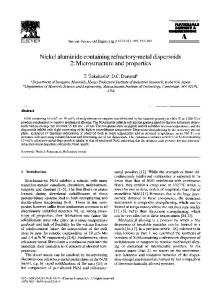
Models with Concentric Sphere Elements Hashin (1962) introduced a model that can be solved exactly for the bulk modulus of the composite and that also corresponds either to the weakest or to the strongest microgeometry possible for a two-constituent elastic composite, thereby providing an important example of rigorous bounds on all two-component composites. Hashin's result for this \composite spheres assemblage" may be derived using the following thought experiment [see Figure 1]: If the host medium is type-1, then the scattering coe�cient for a spherical inclusion of radius b of the composite composed of type-1 and type-2 with volume fractions v and v = 1 ? v is porportional to (1)
�?K K B / b K� + G : (1)
3
0
4 3
(2)
(1)
(6)
(1)
Consider a concentric spherical element composed of a sphere of type-2 having radius a surrounded by a concentric sphere of type-1 lling the remainder of the sphere of radius b so that v = (a=b) . Then the scattering coe�cient for a single such element imbedded in the host material must also satisfy (2)
3
B / a KK +? KG ; 3
0
(2)
(2)
(1)
4 3
(7)
(1)
with no approximation needed for this model problem. Equating (6) and (7), and using the fact that the volume fraction v = (a=b) , the resulting expression shows the e�ective bulk modulus KH� satis es (2)
3
KH� ? K = v K ? K ; KH� + G K + G (1)
4 3
(2)
(2)
(2)
(1)
3
(1)
4 3
(1)
(8)
for a concentric sphere element of any size having the same ratio of radii. Filling space with such elements of all sizes as in Figure 1 gives the composite spheres assemblage, whose bulk modulus is also equal to KH� since all the elements composing it have the same e�ective modulus. This is a di�erent derivation of an exact result due to Hashin (1962). Rewriting the result using a notation based on volume averages, we nd that * + KH� ? K = K (x) ? K (9) KH� + G K (x) + G ; since the volume average h�i over the spatial coordinate x produces the same weighting as in (8), while there is no contribution to (9) from regions where K (x) = K . Equation (9) can be rearranged into the convenient form + * 1 1 (10) KH� + G = K (x) + G : A similar computation based on B gives an approximation for the shear modulus * + 1 1 (11) G�H + F = G(x) + F ; (1)
4 3
(1)
4 3
(1)
(1)
(1)
4 3
4 3
(1)
(1)
2
(1)
(1)
where F is found from (5) by adding type-1 superscripts to all the K s and Gs. The formulas (10) and (11) are not coupled and therefore give explicit equations for the e�ective constants K � and G�. For spherical scatterers, when the shear modulus of the host G is the smallest (largest) of all the shear moduli of all constituents, the concentric sphere model produces the same estimate of the bulk modulus as the Hashin-Shtrikman lower (upper) bound (Hashin and Shtrikman, 1962; 1963). (1)
(1)
Models with a Host A thorough review of the di�erential e�ective medium (DEM) method introduced next was presented by Cleary et al. (1980). The di�erential method is constructed using another gedanken experiment [see Figure 2]: If there are only two constituents whose volume fractions are x = v and y = v = 1 ? x, then � (y) at one value of y is known. Treating suppose the value of the e�ective bulk modulus KDEM � (y) as the composite host medium and K � (y + dy) as the e�ective constant after a KDEM DEM small proportion dy=(1 ? y) of the composite host has been replaced by spherical inclusions of type-2, we nd � (y) � (y + dy) ? K � (y) dy K ? KDEM KDEM DEM = (12) � (y + dy) + G� (y) (1 ? y) K + G� (y) : KDEM DEM DEM Since the composite host contains the volume fraction x of type-1 and y of type-2, on average a fraction dy=(1 ? y) of the composite host must be replaced by type-2 in order to change the overall fraction of type-2 to y + dy. Taking the limit dy ! 0 gives the result � � (y) � K ? K 4 d DEM � � � (13) (1 ? y) [KDEM (y)] = dy K + G�DEM (y) KDEM (y) + 3 GDEM (y) ; (1)
(2)
4 3
(2)
(2)
(2)
4 3
4
4 3
(2)
� (0) = K . The corresponding formula for the where the initial host is pure type-1 so KDEM shear modulus is � (y) G ? G d DEM � (y)] ; � (14) [G�DEM (y) + FDEM (1 ? y) [GDEM (y)] = � dy G + FDEM (y) (1)
(2)
(2)
with F de ned in (5) and G�DEM (0) = G 1). Note that (13) and (14) are coupled and must therefore be integrated simultaneously. Norris (1985) and Avellaneda (1987), among others, have shown that the DEM is realizable whereas Milton (1985) showed earlier that the SC approximation to be described next is realizable. Like the result for Hashin's composite spheres assemblage, the DEM formulas are not symmetrical in the constituents. Equations (13) and (14) have been derived assuming the initial host is of type-1 and the inclusion of type-2. A second distinct DEM estimate is found by interchanging the roles of type-1 and type-2. The embedding process guarantees that the initial host material remains connected in the resulting composite (Yonezawa and Cohen, 1983). This feature makes the DEM a very appealing choice in situations where smaller volume fractions of inclusions are dispersed in a host medium. At larger volume fractions where the inclusions begin to form a percolating cluster of contiguous particles, the DEM may not be as appropriate as the SC approximation, which by contrast allows the host material to become disconnected in this circumstance. If the composite under study contains more than two constituents, it is more di�cult to include the additional components in the DEM than in the SC approximation. The essential di�erence is that the result for the DEM estimate depends on the path taken, i.e., the order in which the constituents are added to the composite. Norris (1985) and Berge et al. (1992) have presented methods of generalizing (13) to multiple constituents. (
Models with no Host Although there are several methods that are called \self-consistent" [see Budiansky (1965), Hill (1965) and Christensen (1979)] | and often for similar reasons such as the necessity to iterate implicitly coupled equations to nd the desired solutions | the particular selfconsistent approach we favor here is the one described by Gubernatis and Krumhansl (1975) and by Berryman (1980). Our self-consistent approximation is justi ed by a slightly di�erent thought experiment [see Figure 3]: If the host medium is the composite itself (i.e., type-*), then the scattering coe�cient for scattering from a spherical inclusion of type-i material is just i � B / bi KK i +? KG� : 0
3
( )
( )
4 3
(15)
The value of the composite bulk modulus may be found by treating K � as a tunable quantity. Averaging the single-scattering contributions at in nity and adjusting K � until the sum vanishes, we nd m X i=1
i � v i KK i +? KGSC � = 0; SC ( )
( )
4 3
( )
5
(16)
where we have assumed m constituents with volume fractions satisfying Pmi v i = 1. This equation can also be rearranged and written in terms of volume averages, giving =1
*
+
1 1 = � � KSC + GSC K (x) + G�SC : 4 3
( )
(17)
4 3
Notice that this formula also depends on knowledge of the e�ective value of the shear modulus G�SC . This value is also determined self-consistently using the analogous computation based on B as described by Berryman (1980). The result is 2
*
+
1 1 = � � � ; GSC + FSC G(x) + FSC
(18)
where F is again de ned in (5). Note that (17) and (18) are coupled and therefore provide only implicit formulas for the e�ective constants. Normally these equations are solved by simultaneous iteration. The SC approximation produces a single formula in which all components are treated equally, with no one material serving as host. Such a symmetric formula is appropriate in complex aggregates like many rocks. Other approximations of this type may be obtained by using the single-scattering coe�cients for nonspherical (often ellipsoidal) scatterers. Another similar, but nevertheless distinct, self-consistent approach introduced by Hill (1965) and Budiansky (1965) for K � and G� produces formulas identical to (17) and (18) when the inclusions are spherical; however, for other shapes of inclusions, their approach is known to produce different results. Milton (1985) has shown that the SC approximation presented here is realizable (i.e., in principle a model can be found that has the same value of the e�ective constants as that computed from the SC approximation), whereas the self-consistent method of Hill (1965) and Budiansky (1965) is not realizable for all inclusion shapes. Thus, in many circumstances involving multiple nonspherical inclusions, the present SC approximation may be the preferred method of generating estimates for e�ective elastic constants. EXAMPLES Porous Glass Foam Walsh et al. (1965) made measurements on the compressiblity (1=K ) of a porous glass over a wide range of porosities. The samples they used were fabricated from P-311 glass powder (54:4% SiO , 14:4% B O , 14:1% CaO, 10% Al O , 6:5% Na O, and 0:7% K O). The powder and binder were die-pressed and then sintered in alumina crucibles. Depending on the thermal history of the samples, they obtained porous glass with porosities ranging from 0:70 to near zero. Porosity measurements were stated to be accurate to �0:01. The glass samples were foam, with microgeometry such that large open pores were dispersed in a continuous glass background that thinned to a network of needle-like laments at the highest porosities. Linear compressibility of the samples was measured using electrical resistance strain gages attached to their surfaces while immersed in a high-pressure medium. Samples were tested for reversibility (having the same behavior for either increasing or decreasing pressure), which was satis ed in all but the most porous samples. They showed that their results agreed well with the theoretical 2
2
3
2
6
3
2
2
predictions of Mackensie (1950). It turns out that Mackensie's result for the bulk modulus of a porous solid is also identical to the result for Hashin's composite spheres assemblage if the outer shell of the concentric sphere element is glass and the inner sphere is void. Thus, Walsh et al. (1965) actually showed that their porous glass foam is well approximated by Hashin's model for a wide range of porosities. Results of our theoretical calculations for e�ective properties of the glass foam are shown in Table 1. To be consistent with the microstructure of these porous glasses for the SC approximation, we have treated the glass as if it were shaped like needles randomly dispersed in the void at the highest porosities; the voids are treated as spherical inclusions in the glass at the lowest porosities. (If instead we had chosen to treat the glass as spheres, the SC approximation would have vanished at porosities of 0.50 and greater. However, this choice is a very unrealistic representation of the true microstructure of the glass at high porosities.) Since the DEM approximation treats the glass as host medium at all values of porosity, we assume only that the voids are spherical for this estimate. We see that both theories (SC and DEM) do well at predicting the measured values out to about 0.25 porosity. For higher porosities, both theories overestimate the in uence of the voids while Hashin's composite spheres model does somewhat better at estimating the measured values over the whole range of porosities. The DEM is still only a little too sti� out to about 0.50 porosity, while SC fails after 0.25 porosity. DEM is a closer analog to the true microgeometry than SC, but H is the best analog over the whole range of porosities. Ferrari and Filipponi (1991) show that an application of Mori and Tanaka theory for composite materials (Benveniste, 1987) to this same data set gives somewhat better agreement with the data than any of the theories considered here. Berge et al. (1992) also consider some variations of the theory that produce improved agreement.
7
Table 1. Values of isothermal bulk moduli of porous P-311 glass measured at room
temperature compared to theoretical estimates. Bulk and shear moduli of the pure glass were K = 46:3 and G = 30:5 GPa, respectively. Data from Walsh et al. (1965). Porosity Experimental Composite Spheres Spherical Voids Needles-Spheres � K (GPa) KH (GPa) KDEM (GPa) KSC (GPa) 0.00 46.1 46.3 46.3 46.3 0.00 45.9 46.3 46.3 46.3 0.05 41.3 41.6 41.5 41.4 0.11 36.2 36.6 36.1 35.6 0.13 37.0 35.1 34.4 33.7 0.25 23.8 27.0 25.2 22.8 0.33 21.0 22.5 19.9 16.4 0.36 18.6 21.0 18.1 14.2 0.39 17.9 19.6 16.4 12.3 0.44 15.2 17.3 13.7 9.4 0.46 13.5 16.4 12.7 8.5 0.50 12.0 14.8 10.9 6.7 0.70 6.7 7.7 3.8 2.1
Sintered Glass Beads Synthetic sandstones were made by sintering glass beads at peak temperatures of 700760� C to achieve porosities of �1-40% and cooling slowly through the annealing temperature of �550� C to avoid developing microcracks. The beads were manufactured by Cataphote Inc. of Jackson, MS, from soda-lime plate glass. Bead diameters were 230�20 �m for most samples; another ve samples had bead diameters of 548�48 �m. The glass density was 2.48�0.02 g/cm . Samples were cored with diameters of 2.54�0.002 cm and ground to right circular cylinders with lengths of 2.54�0.002 cm. Sample masses were determined with an uncertainty of �0.005 g; all samples had masses in the range 16{32 g. The sample volumes, masses, and glass density were used to compute porosities with an uncertainty of �0.6% for samples with porosities below �30%, and an uncertainty of �1% for the higher porosity samples. A pulse transmission technique was used with 0.5 MHz P and 5 MHz S transducers to determine the compressional (P) and shear (S) wave velocities of both dry and saturated samples in all cases. Velocity measurements had an uncertainty of �1%. All measurements were made at atmospheric pressure and room temperature. Results of measurements and calculated values for bulk modulus are listed in Table 2. The 3
8
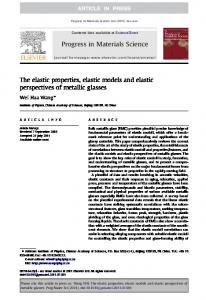
DEM approximation provides a good estimate for the compressional wave velocities of the sintered glass beads for samples with porosities below about 20%. But the DEM approximation greatly overestimates the strength of the synthetic sandstones for high porosities, because this approach assumes a microstructure in which the solid framework of the medium remains a continuous host. Since the glass-bead samples become unconsolidated at the random packing density (somewhere near 45% porosity), the DEM approximation cannot provide a good estimate of velocities for the higher porosity synthetic sandstones. The SC approximation, however, does allow cracks and pores to overlap so that the host medium becomes e�ectively disconnected at some nite porosity. When spherical inclusions are used to represent both the glass and the pore space, the SC approximation gives good estimates of the compressional wave velocities of these synthetic sandstones for all porosities attained experimentally. For comparison, the measured compressional wave velocities (Vp ) of synthetic sandstones are plotted in Figure 4 together with values of compressional wave velocities computed from the observed compressibilities and the Poisson's ratio of glass (Barnes and Hiedemann, 1956) in the samples of porous glass foam studied by Walsh et al. (1965). Note that the measured bulk and shear moduli of our glass beads were K = 46:06 � 0:7 GPa and G = 29:24 � 0:4 GPa, whereas the glass used in the glass foam of Walsh et al. had K = 46:3 � 1% GPa and G = 30:5 � 5% GPa. These values are su�ciently close that we will consider them to be mechanically the same glass. Thus, any di�erences observed are presumably due only to di�erences in the microstructures. Considering the theoretical results, it is clear that the DEM does a good job of predicting the results of the experiments on porous glass foam, while the SC does an equally good job of predicting the values for the sintered glass-bead samples. For the higher porosity values, the measured velocities are su�ciently di�erent that unambiguous conclusions may be drawn about the importance of the microstructure in the predictions.
9
Table 2. Values of adiabatic bulk
moduli for sintered glass beads. Data from Berge et al. (1995). Most of the samples contained a narrow range of grain sizes centered at a grain diameter of 230 �m. Samples with larger grain size (548 �m diameter) are identi ed by an asterisk. One sample having a smaller grain size (137 �m diameter) is identi ed by the symbol y.
10
Porosity Experimental Sphere-Sphere Spherical Voids � K (GPa) KSC (GPa) KDEM (GPa) 0.000 46.06 46.06 46.06 0.010 45.41 45.06 45.06 0.059 39.77 40.17 40.36 0.069 35.93 39.18 39.43 0.173 31.20 29.07 30.56 0.280 20.84 19.02 22.76 0.285 19.38 18.57 22.43 0.290 19.10 18.11 22.10 0.310 14.62 16.29 20.80 0.319 15.28 15.47 20.23 0.327y 15.81 14.75 19.74 0.327 18.23 14.75 19.74 0.327 18.59 14.75 19.74 0.360 8.25 11.82 17.76 0.365 9.19 11.38 17.47 0.365� 10.55 11.38 17.47 0.388 6.43 9.36 16.17 0.390 6.08 9.19 16.06 0.390� 9.40 9.19 16.06 0.395� 10.13 8.76 15.78 0.396 5.53 8.67 15.73 0.398 5.12 8.50 15.62 0.401 4.61 8.24 15.46 0.426� 5.84 6.10 14.14 0.432� 6.10 5.60 13.83
11
CONCLUSIONS Microstructure has been shown to play a very signi cant role in determining the e�ective elastic properties of porous materials. Successful analysis depends on our ability to nd solvable models that mimic the key features of the actual microstructure of real materials. It is not expected that perfect agreement will ever be achievable, if only because of the statistical nature of the problem and the fact that a given theory normally provides a \mean" estimator. Nevertheless, quite good agreement has been demonstrated in Figure 4, and we conclude that all three of the models considered | Hashin's composite spheres assemblage, the di�erential e�ective medium, and the self-consistent method | are useful analogs of some real materials. ACKNOWLEDGMENTS We thank Brian P. Bonner for his advice and for the use of his equipment to do the acoustical experiments on the sintered glass-bead samples. This work was performed under the auspices of the U. S. Department of Energy by the Lawrence Livermore National Laboratory under contract No. W-7405-ENG-48 and supported speci cally by the Geosciences Research Program of the DOE O�ce of Energy Research within the O�ce of Basic Energy Sciences, Division of Engineering and Geosciences. REFERENCES Avellaneda, M., 1987, \Iterated homogenization, di�erential e�ective medium theory and applications," Communications on Pure and Applied Mathematics, Vol. 40, pp. 527{554. Barnes, J. M., and Hiedemann, E. A., 1956, \Determination of the elastic constants of optical glasses by an ultrasonic method," Journal of the Acoustical Society of America, Vol. 28, pp. 1218{1221. Benveniste, Y., 1987, \A new approach to the application of Mori-Tanaka's theory in composite materials," Mechanics of Materials, Vol. 6, pp. 147{157. Berge, P. A., Bonner, B. P., and Berryman, J. G., 1995, \Ultrasonic velocity-porosity relationships for sandstone analogs made from fused glass beads," Geophysics, Vol. 60, pp. 108{119. Berge, P. A., Fryer, G. J., and Wilkens, R. H., 1992, \Velocity-porosity relationships in the upper oceanic crust: Theoretical considerations," Journal of Geophysical Research, Vol. 97, pp. 15239{15254. Berryman, J. G., 1980, \Long-wavelength propagation in composite elastic media I. Spherical inclusions & II. Ellipsoidal inclusions," Journal of the Acoustical Society of America, Vol. 68, pp. 1809{1831. Berryman, J. G., 1985, \Measurement of spatial correlation functions using image processing techniques," Journal of Applied Physics, Vol. 57, pp. 2374{2384. 12
Berryman, J. G., 1992, \Single-scattering approximations for coe�cients in Biot's equations of poroelasticity," Journal of the Acoustical Society of America, Vol. 91, pp. 551{571. Berryman, J. G., and Milton, G. W., 1988, \Microgeometry of random composites and porous media," Journal of Physics D: Applied Physics, Vol. 21, pp. 87{94. Budiansky, B., 1965, \On the elastic moduli of some heterogeneous materials," Journal of the Mechanics and Physics of Solids, Vol. 13, pp. 223{227. Christensen, R. M., 1979, Mechanics of Composite Materials, Wiley, New York. Cleary, M. P., Chen, I.-W., and Lee, S.-M., 1980, \Self-consistent techniques for heterogeneous media," American Society of Civil Engineering Journal of Engineering Mechanics, Vol. 106, pp. 861{887. Ferrari, M., and Filipponi, M., 1991, \Appraisal of current homogenizing techniques for the elastic response of porous and reinforced glass," Journal of the American Ceramic Society, Vol. 74, pp. 229{231. Gubernatis, J. E., and Krumhansl, J. A., 1975, \Macroscopic engineering properties of polycrystalline materials: Elastic properties," Journal of Applied Physics, Vol. 46, pp. 1875{ 1883. Hashin, Z., 1962, \The elastic moduli of heterogeneous materials," ASME Journal of Applied Mechanics, Vol. 29, pp. 143{150, 765{766. Hashin, Z., and Shtrikman, S., 1962, \On some variational principles in anisotropic and nonhomogeneous elasticity," Journal of the Mechanics and Physics of Solids, Vol. 10, pp. 335{342. Hashin, Z., and Shtrikman, S., 1963, \A variational approach to the elastic behavior of multiphase materials," Journal of the Mechanics and Physics of Solids, Vol. 11, pp. 127{140. Hill, R., 1965, \A self-consistent mechanics of composite materials," Journal of the Mechanics and Physics of Solids, Vol. 13, pp. 213{222. Kuster, G. T., and Toksoz, M. N., 1974, \Velocity and attenuation of seismic waves in twophase media: Part I. Theoretical formulations," Geophysics, Vol. 39, pp. 587{606. Mackensie, J. K., 1950, \The elastic constants of a solid containing spherical holes," Proceedings of the Physical Society of London, Vol. 63B, pp. 2{11. Milton, G. W., 1985, \The coherent potential approximation is a realizable e�ective medium theory," Communications in Mathematical Physics, Vol. 99, pp. 463{500. Norris, A. N., 1985, \A di�erential scheme for the e�ective moduli of composites," Mechanics of Materials, Vol. 4, pp. 1{16. Torquato, S., 1991a, \Random heterogeneous media: Microstructure and improved bounds on e�ective properties," Applied Mechanics Reviews, Vol. 44, pp. 37{76. 13
Torquato, S., 1991b, \Microstructure and e�ective properties of random media," Lectures in Applied Mathematics, Vol. 27, pp. 323{358. Torquato, S., and Stell, G., 1983, \Microstructure of two-phase random media. III. The n-point matrix probability functions for fully penetrable spheres," Journal of Chemical Physics, 79, pp. 1505{1510. Walsh, J. B., Brace, W. F., and England, A. W., 1965, \E�ect of porosity on compressibility of glass," Journal of the American Ceramic Society, Vol. 48, pp. 605{608. Yonezawa, F., and Cohen, M. H., 1983, \Granular e�ective medium approximation," Journal of Applied Physics, Vol. 54, pp. 2895{2899.
14
ppp ppp ppp ppp ppp ppp ppp ppp ppp ppp ppp ppp ppp ppp ppp ppp ppp ppp ppp ppp ppp ppp ppp ppp ppp ppp ppp ppp ppp p p ppppppppppp p ppp pp ppppp pp ppp p pp p pppp pppp pppp pppp pppp pppp pppp pppp pppp pppp pppp pppp ppppp ppppp ppppp ppppp ppppp ppppp ppppp ppppp ppppp ppppp ppppppppppppppppppppppppppppppp pppppppppppppp p p p ppppppppppppppppp pp pp pp pp pp pp pp pp pp pp p ppp ppp ppp ppp ppp ppp ppp ppp ppp pppp pppp pppp pppp pppp pppp pppp pppp pppp pppppppp pppppppppppppppppppppppppp p pppppp ppppp pppp p p pppp p ppppp p p p p p p p p p p pppppp p p pp pp pp pp pp pp pp pp pp pp pp ppppppppppppppppp pppppppppppppppp p ppppppppppppp pppp pppp pppp pppp pppp pppp pppp pppp pppp pppp pppppppp pp p ppppppppppp ppp pppp ppp ppp ppp ppp ppp ppp ppp ppp ppp ppp ppp ppp ppp pppp p ppppp pppp pppp pppp ppppp ppppp ppppp ppppp ppppp ppppp ppppp ppppp ppppp ppppp ppppp
=)
ppp ppp ppp ppp ppp ppp ppp ppp ppp ppp ppp ppp ppp ppp ppp ppp ppp ppp ppp ppp ppp ppp ppp ppp ppp ppp ppp ppp ppp ppp ppp ppp ppp ppp ppp ppp ppp ppp ppp ppp pp p ppp p ppp p pppp p ppp p ppp p ppp ppp ppp ppp ppp ppp ppp ppp ppp ppp ppp ppp ppp ppp ppp ppp ppp ppp ppp ppp ppp ppp p ppp p pppp ppp ppp ppp ppp ppp ppp ppp p p ppp ppp ppp ppp ppp ppp ppp ppp ppp ppp ppp ppp ppp ppp ppp ppp ppp ppp ppp p ppp ppp ppp ppp ppp ppp ppp ppp ppp ppp ppp ppp ppp ppp ppp ppp ppp ppp ppp ppp ppp ppp ppp ppp ppp ppp ppp ppp ppp ppp pppp p ppp p pppp p ppp pppp ppp p pp p ppp p ppp ppp ppp ppp ppp ppp ppp ppp ppp ppp ppp ppp ppp ppp ppp ppp ppp ppp ppp ppp ppp ppp ppp ppp ppp ppp ppp ppp ppp ppp ppp ppp ppp ppp ppp ppp ppp ppp ppp ppppppppppppppppppppppppppppp
Figure 1: Schematic illustration of Hashin's composite spheres assemblage.
ppp ppp ppp
ppp ppp p p ppp p p p ppppp p p p ppp p p pp ppp pp pp pp p pp~pp ppu p p ppp p pp pp pp ppp pp p p p ypp pp p|ppp p p pp pp pp p p ppp p p p pppp p p p pp p p pp pp
ppp ppp ppp ppp ppp ppp ppp ppp ppp ppp ppp ppp ppp ppp ppp ppp ppp ppp ppp ppppppppppppppppppppppppppppppppppppppp ppppppppppppppppppppppppppppppppppppppp pp ppppppppppppppppppppppppppppppppppppppp p p p p p p p p p p p p p p p p p p p ppppppppppppppppppppppppppppppppppppppp p p p p p p p p p p p p p p p p p p p p p p p p ppppppppppppppppppppppppppppppppppppppp p p pp p pp pp pp pp pp p p p pvp p p p p p p p p p p p p p ppp ppp ppp ppp ppp pp p ppp p pppuppp ppp ppp ppp p~ pp ppppppppppppppppppppppppppppppppppppppp p p u pp p ppppppppppppppppppppppppppppppppppppppp p pp =) pppp pppp pppp pppp pppp pppp pppp pppp pppp pppp upppp pppp rppppp ppppp ppppp ppppp ppppp ppppp ppppp =) ppppppppppppppppppppppppppppppppppppppp z pp p r ~p p ppppppppppppppppppppppppppppppppppppppp ppppppppppppppppppppppppppppppppppppppp p p p p p p p p p p p vp p p p p p p p ppppppppppppppppppppppppppppppppppppppp p p p p p p p p p p p p p p p p p p x ppppppppppppppppppppppppppppppppppppppp ppp ppp ppp ppp ppp pp p pppp p pp p ppp p pppp p ppp p ppp p ppp p ppp ppp ppp ppp ppp ppp pp pp ppppppppppppppppppppppppppppppppppppppp ppppppppppppppppppppppppppppppppppppppp p p p p p p p p p p p p p p p p p p p ppppppppppppppppppppppppppppppppppppppp pp pp pp pp pp pp pp pp pp pp pp pp pp pp pp pp pp pp pp p ppppppppppppppppppppppppppppppppppppppp ppppppppppppppppppppppppppppppppppppppp
Figure 2: Schematic illustration of the di�erential e�ective medium (DEM) approximation.
ppp ppp ppp ppp ppp ppp ppp ppp ppp ppp ppp ppp ppp ppp ppp ppp ppp ppp ppp ppp ppp ppp ppp ppp ppp ppp ppp ppp ppp ppp ppp ppp ppp ppp ppp ppp ppp ppp ppp ppp ppp p ppp p pppp p ppp p ppp p ppp ppp ppp ppp ppp ppp ppp ppp ppp ppp ppp ppp ppp pppp pppp pppp pppp pppp pppp pppp pppp pppp pppp ppp p pppp pppipppp pppp pppp pppxpppp p pppp p ppp pppp pppp pppp pppp pppp pppp pppp pppp pppp ppp ppp ppp ppp ppp ppp ppp ppp ppp ppp ppp ppp ppp ppp~ppp ppp pp mpp pp ppp ppp ppp ppp ppp ppp ppp ppp ppp ppp ppp ppp ppp ppp ppp ppp ppp ppp ppp ppp ppp pppp p pp p pppp pppp p ppp p ppp p ppp p pppp ppp ppp ppp ppp ppp ppp ppp ppp ppp ppp ppp ppp ppp ppp ppp ppp ppp ppp ppp ppp ppp ppp ppp ppp ppp ppp ppp ppp ppp ppp ppp ppp ppp ppp ppp ppp ppp ppp ppp
=)
ppp ppp ppp ppp ppp ppp ppp ppp ppp ppp ppp ppp ppp ppp ppp ppp ppp ppp ppp ppp ppp ppp ppp ppp ppp ppp ppp ppp ppp ppp ppp ppp ppp ppp ppp ppp ppp ppp ppp ppp ppp p ppp p pppp p ppp p ppp p ppp p ppp ppp ppp ppp ppp ppp ppp ppp ppp ppp ppp ppp ppp ppp ppp ppp ppp ppp ppp ppp ppp ppp pp p ppp ppp ppp ppp ppp ppp pp p ppp p ppp ppp ppp ppp ppp ppp ppp ppp ppp ppp ppp ppp ppp ppp ppp ppp ppp ppp ppp ppp ppp ppp ppp ppp ppp ppp ppp ppp ppp ppp ppp ppp ppp ppp ppp ppp ppp ppp ppp ppp ppp ppp ppp ppp ppp ppp ppp ppp ppp ppp pppp p pp p ppp p pppp p ppp p ppp p ppp p ppp p ppp ppp ppp ppp ppp ppp ppp ppp ppp ppp ppp ppp ppp ppp ppp ppp ppp ppp ppp ppp ppp ppp ppp ppp ppp ppp ppp ppp ppp ppp ppp ppp ppp ppp ppp ppp ppp ppp ppp ppppppppppppppppppppppppppppp
Figure 3: Schematic illustration of the self-consistent (SC) approximation.
15
50
uee u Data from Walsh et al. (1965) u 40 e uu e Data from Berge et al. (1993) e e 30 K (GPa) ue u e ee u u u 20 e e uu 10 e eee e u 0
0.0
0.2
0.4 Porosity �
0.6
0.8
Figure 4: Compressional wave velocity (Vp) for sintered glass beads measured by Berge et al. (1995) and for porous glass foam computed from compressibilities measured by Walsh et al. (1965). Measured values are compared to the most appropriate theoretical predictions based on known microstructure: DEM for glass foam and SC for sintered glass.
16