In the following we analyze the effects of DTO,. Internal LU (ILU) and External LU (ELU) on the performance of CONV focusing our attention on level 0.
MODELING THE PERFORMANCE OF GENERAL PURPOSE INSTRUCTION LEVEL PARALLEL ARCHITECTURES IN IMAGE PROCESSING Mauro Migliardi DIST, University of Genova Genova, Italy 16145
Abstract RISC Instruction Level Parallel systems are today the most commonly used high performance computing platform. On such systems, Image Processing and Pattern Recognition (IPPR) tasks, if not thoroughly optimized to fit each architecture, exhibit a performance level up to one order of magnitude lower than expected. In this paper we identify the sources of such behavior and we model them defining a set of indices to measure their influence. Our model allows planning program optimizations, assessing the results of such optimizations as well as evaluating the efficiency of the CPUs architectural solutions in IPPR tasks. A case study using a combination of a specific IPPR task and a RISC workstation is used to demonstrate these capabilities. We analyze the sources of inefficiency of the task, we plan some source level program optimizations, namely data type optimization and loop unrolling, and we assess the impact of these transformations on the task performance. The results of our study allow us to obtain an eight times performance improvement and to conclude that, in lowmedium level IPPR tasks, it is more difficult to efficiently exploit superscalarity than pipelining.
1 - Introduction The computing power available today in low cost RISC systems [6][15][16] is of the same order of magnitude as the one previously delivered by massively parallel computers and the performance of standard sequential programs, coded in languages such as C, is often high enough to allow the implementation of cost effective software based solutions in applications previously requiring dedicated hardware. As a consequence, traditional high end applications in computationally taxing fields such as Image Processing and Pattern Recognition (IPPR) have been ported to RISC based platforms [1] and novel applications of IPPR, based for example on digital video processing [10], have been introduced and have quickly found wide acceptance.
Massimo Maresca DEI, University of Padova Padova, Italy 35131
However, software implementations of IPPR tasks on RISC architectures, if not heavily optimized in architecture dependent ways, exhibit a level of performance by far lower than expected: in many IPPR basic tasks the actual performance is up to one order of magnitude lower than the peak performance [2]. This fact proves that IPPR tasks on RISC architectures incur into a large degree of inefficiency. This inefficiency is due both to the structure of RISC CPUs, in particular to unnecessary additional instructions and to low utilization of functional units, and to the hierarchical structure of memory systems, in particular to cache misses [13]. Nevertheless, in many low-medium level IPPR tasks [3], the problem of cache misses is less critical than in other application fields [2] and the number of cache misses is quite near to the number of compulsory misses [11]. This fact is due to two main reasons: 1. the reuse of data; in many low-medium level IPPR tasks the ratio of memory access/operations is 0.050.001, much less than the 0.2-0.4 commonly assumed [6]; 2. the locality of computation; in many low-medium level IPPR tasks the computation involves a pixel and its neighborhood. For these reasons we focus our attention on the structure of RISC CPUs. To overcome the inefficiencies that prevent the CPU from delivering a level of performance close to its peak it is necessary to perform a quantitative analysis of the problem [5][4][9][12]. In fact, to provide solutions apt to improve the efficiency of RISC architectures in IPPR tasks, it is necessary to identify the sources of inefficiencies and to measure the contribution of each of them to the global slowdown with respect to ideal performance. These solutions concern compiler optimizations, source level program reorganizations and the CPU architecture. In section 2 we identify the main sources of inefficiency of RISC systems and we define an index for each of these sources; in section 3 we apply the indices to a case study and we use the indices to plan Source Level program Optimizations (SLOs); in section 4 we assess the benefits of SLOs and we analyze how much the CPU architecture matches the computational needs of the task; finally in section 5 we discuss our results.
2 - Modeling the System To achieve high performance current generation high end workstations adopt many different architectural solutions. Nevertheless some common traits can be found, namely a large degree of instruction level parallelism through deep pipeline structures and wide superscalar structures, a reduced instruction set, and a Load/Store architecture. Considering these common traits it is possible to identify two main categories of inefficiencies: I. inefficiencies due to the addition of unnecessary machine instructions; II. inefficiencies due to the waste of machine cycles in the execution of the machine instructions. Thus we can say that the efficiency of an Instruction Level Parallel (ILP) architecture can be divided into Instruction Efficiency and Execution Efficiency. A more in depth analysis allows us to identify two different sources of inefficiency falling under the definition of Instruction Efficiency, namely: A. the number of unnecessary load/store instructions due to the limited number of CPU registers; B. the number of bookkeeping instructions, i.e. instructions that are not inherently due to the task, but that are necessary to control the correct execution of the task (e.g. control flow, addresses calculations, etc.). Thus we can say that the Instruction Efficiency of a task can be further subdivided into Load/Store Efficiency (A) and Bookkeeping Efficiency (B). The main source of inefficiency that lowers the Execution Efficiency of a task is the idleness of the CPU functional units which is normally due to hazards. These inconveniences prevent ILP architectures from reaching their maximum instruction execution throughput. 2.1 Instruction Efficiency A program is a sequence of machine instructions. In our model each machine instruction belongs to one of the three following categories: • load/store operation instructions; these instructions may be due to the need to load input data into registers and to store output data to primary memory, or they may be due to the spilling of temporary values; • arithmetical/logical operation instructions; these instructions may be due to the operations intrinsically necessary to carry out the task or they may be due to bookkeeping; • branch operation instructions; these may be due to ramification intrinsic to the flow of the task or they may be due to programming techniques such as loops.
In this paper we consider the first category as contributing to lower the Load/Store Efficiency and the latter two categories as contributing together to lower the Bookkeeping Efficiency of a task. Thus we distinguish only between Load/Store Operations (LSO) instructions and Arithmetical/Logical and Branch Operations (ALBO) instructions. We call , the Load Efficiency Index of a task. , measures how far a piece of code is from the ideal result of a single load for each data item and a single store for each result. We call 0 the Bookkeeping Efficiency Index of a task. 0 measures how many of the ALBO instructions of the task are intrinsically due to the task execution and how many of the ALBO instructions are due to Bookkeeping. As we have stated before , and 0 measure the two sources of inefficiency that lower Instruction Efficiency. If we define ) as the Instruction Efficiency Index of a task we can state the following Proposition 1 The effects of Load Efficiency and Bookkeeping Efficiency contribute orthogonally to ). As a consequence: ) = , 0 1. 2.2 Execution Efficiency We now analyze the inefficiency of ILP architectures with regard to the number of wasted execution cycles. We call % the Execution Efficiency Index of a task. % measures the ratio between the ideal execution time and the actual execution time of the actual instruction sequence of the task. This index includes the effects deriving both from pipeline stages idleness and from an instruction sequence not able to keep all the functional units busy2. 2.3 Global Efficiency We call ' the Global Efficiency Index of a task. ' measures the level of efficiency of the task both from the Instruction Efficiency point of view and from the Execution Efficiency point of view, i.e. it gives a comprehensive measure of all the sources of inefficiency 1
The proof of this proposition and the necessary definitions can be found in Appendix A. 2 Consider as an example a CPU with an integer unit and a FP unit and an instruction sequence composed solely of integer instructions. This instruction sequence can be able to keep all the pipeline stages busy all the time, but it is unable to feed the FP functional unit that is left idle cycle after cycle. Thus the instruction sequence has a low value of %.
, 0 Straightforward 0.52 0.20 DTO 0.72 0.22 DTO + ILU 25 0.54 0.72 DTO + ELU 32 0.77 0.63 Table 1 Performance Metrics of the CONV task.
%
IMPLEMENTATION
of a ILP architecture. Thus ' gives a global measure of the effects previously individually captured by %, , and 0. Proposition 2 The three components of '. namely %, , and 0, measure orthogonal sources of inefficiency. As a consequence: ' = % , 0 1 This proposition allows us to visualize the Global Efficiency as a space in which the X axis corresponds to Load Efficiency, the Y axis corresponds to Bookkeeping Efficiency and the Z axis corresponds to the Execution Efficiency of a task. Besides, this property of the metric indices allows us to calculate the value of the Execution Efficiency of a task as the ratio % = ' /, 0 . This fact is very important because it allows evaluating how close to optimality the CPU is in executing the actual instruction sequence without simulating it. This property holds even if the CPU adopts dynamic scheduling techniques.
3 - A case study • • • •
In our experiments we adopted: An HP 725/100 workstation as hardware platform [7][8]; HPUX Version A.09.05 in single-user mode as the operating system environment; the gettimeofday system call as time measuring tool; the Gnu C compiler as software platform3 [14].
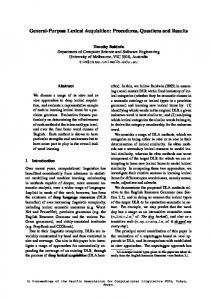
for each mask position (x,y) begin acc := 0; for each mask element (i,j) acc:=acc+input_image[x+i][y+j]*mask[i][j]; output_image[x+mask_dim div 2] [y+mask_dim div 2]:=acc; end Figure 1
0.03 0.06 0.19 0.24
Exec. Time (ms) 120.5 65.5 23.0 17.7
3.1 The Task We selected two-dimensional convolution (CONV) to represent a typical image processing task. We can see the basic sequential algorithm for CONV in figure 1 4. 3.2 The Metrics Definition A loop is a level n loop if and only if it contains n nested loops or, in case of loop unrolling, if and only if it would contain n nested loops rerolling the unrolled loops. We executed our experiments using the following parameters: Mask dimension = 5 Frame Dimension = 128. In our analysis we focus on level 0 and level 1 loops and we neglect the effects of program statements contained in loops of greater level, this introduces a 4% approximation error. Analyzing the assembly code of loops of level 0 and 1 of the task [8] we obtain the values in table 1. 3.3 Analysis of the Results The values of % , and 0 of the straightforward CONV implementation are extremely low, varying from one fifth to one half of the maximum efficiency. This fact is largely due to the absence of an integer multiplier in the processor that forces the processor to transfer data from the integer data path to the FP data path, to execute the FP multiplication and to transfer back the result. Besides, in the selected system, the only way to transfer data from the integer data path to the FP data path and viceversa is to execute a load/store step through memory, thus the necessity to execute the integer multiplication causes a large decrement of the Load/Store Efficiency. The bottleneck represented by load/store steps through memory and the small degree of instruction diversity of the task give a low level of execution efficiency because they hamper pipeline and superscalarity5.
Basic algorithm for two-dimensional convolution. 4
3
' 0.33 0.40 0.49 0.50
We also tested the HP native compiler, but we obtained longer execution times.
We ignore the issues related to the processing of image borders. 5 The CPU of the platform used has a single functional unit to execute load/store instructions, a single functional
For these reasons a Data Type Optimization (DTO) converting the whole problem from integer to floating point data would give great benefits. Besides it will allow an efficient application of Loop Unrolling (LU).
4 - Analysis of the effects of optimizations DTO consists of choosing the data types for the variables in the program critical path using as a criterion the performance of the different functional units instead of using the data types naturally deriving from the task definition. DTO improves efficiency mainly by forcing the data to flow through the fastest CPU data paths and possibly by increasing instruction diversity. LU consists of transforming a loop in such a way to increase the loop body size and to decrease the number of iterations. LU reduces both the number of LSO instructions, thanks to a better utilization of the CPU registers, and the number of the data hazards, by increasing the number of instructions in each loop iteration, thus allowing the optimizing compiler to schedule the instructions more efficiently. It may reduce instruction diversity. In the following we analyze the effects of DTO, Internal LU (ILU) and External LU (ELU) on the performance of CONV focusing our attention on level 0 and 1 loops only; In table 1 we compare the metrics of CONV with and without the application of DTO. Although the value of ' is still very low, the application of DTO doubles the global efficiency. This increment, though, is not uniform in all the components of the global efficiency. The main benefit of the application of DTO is in the load efficiency, whose value increases of 0.20. This is mainly due to the fact that the application of DTO allows the processor to perform all the data calculation directly in the FP data path and there is no need to perform data conversions. On the other side, we can see that the application of DTO allows only a slight increment in the level of bookkeeping efficiency 0 of the task. This is due to the fact that DTO has no effect on the number of ALBO instructions. The increment of % shows that instruction diversity boosts the exploitation of superscalarity. 4.1 ILU ILU N consists of collapsing N iterations of lowest level loops in one iteration. This may completely eliminate some loops or only reduce the number of iterations executed. The loop body of this new iteration requires a higher number of machine instructions that allows the compiler to take advantage of its sophisticated unit to execute FP instruction and a single functional unit to execute most of integer instructions.
scheduling algorithms and to come up with a more efficient schedule. Moreover a smaller number of bookkeeping instructions is required due to the reduction of the number of iterations. In our experiment we applied ILU 25 together with DTO. Analyzing the assembly code we obtain the metrics reported in table 1. We notice that the global efficiency of CONV with DTO and ILU 25 is more than three times larger than the global efficiency of CONV with DTO alone and more than five times larger than the global efficiency of the straightforward implementation. We also notice that the application of ILU 25 decreases the Load Efficiency of the task with respect to the application of DTO alone. This effect can be explained considering that: 1. ILU does not increase the degree of reuse of data; 2. ILU reduces the number of instructions. From relations (1) and (4) of Appendix A we can see that these changes reduce the value of ,. On the other hand both the Execution Efficiency and the Bookkeeping Efficiency of the task gained great benefits from the application of ILU 25. The Bookkeeping Efficiency is about four times larger than it is for both the straightforward implementation and the implementation with DTO alone; Execution Efficiency gained 0.09 from the implementation with DTO alone and 0.16 from the straightforward implementation. 4.2 ELU ELU consists of moving iterations from outer loops to inner loops. Using ELU, several threads of computations are created and simultaneously progress at every iteration of the internal loop and data reuse improves. We call ELU N the technique of moving N iterations of an outer loop in the inner loop. We describe here the effects of ELU 326. Analyzing the assembly code we obtain the metrics reported in table 1. The application of ELU is very beneficial. In fact the value of the Global Efficiency Index is eight times larger than the value of global efficiency of the straightforward implementation and four times larger than the value of global efficiency with DTO alone. We see that the application of ELU causes a very small change of the value of the Load Efficiency of the task. This effect can be explained considering that: 1. ELU increase the degree of reuse of data; 2. ELU reduces the length of the level 0 loop body diluting the bookkeeping instructions in more iterations. 6
We tried different levels of ELU, namely 8,16, 24 and 32, and we obtained the best results with ELU 32.
The above mentioned changes have almost the same order of magnitude. From relations (1) and (4) of Appendix A we can see that these modifications yield no change of the value of ,. We see also that the Execution Efficiency of the task increases perceivably with the application of ELU. In fact ELU 32 produces an increment of % equal to 0.17 with respect to the straightforward implementation and equal to 0.10 with respect to DTO alone. This result confirms that the generation of independent computation threads allows a very good exploitation of pipeline Instruction Level Parallelism. Finally we can observe that ELU increase the Bookkeeping Efficiency to a lesser degree than ILU. This is due to the fact that while ILU completely deletes some iterative structures, ELU changes the order of execution and reduces the number of iterations without deleting loop control structures. 4.3 Analysis of the Results Although the planned SLOs allowed us to obtain an eight times increment of the level of Global Efficiency of the task the final value it’s only 24%; this result is mainly due to the fact that the value of % never exceeds 0.50. To justify this limited enhancement we have to consider some facts: 1. to calculate the ideal performance we took into account both pipeline and the degree of superscalarity of the architecture (namely a degree of two); 2. the depth of the FP pipeline of the processor is greater than two; 3. in CONV ILU and ELU reduce the diversity contained in the pool of instructions executed by the task and tend to reduce the task to a single critical path; 4. the architecture of the CPU of the selected system has only one FP unit and can execute only one FP instruction in each clock cycle. Thus, reducing the number of unnecessary instruction (both LSO and ALBO) and making the task more similar to a single critical FP path, we have enhanced the instruction efficiency of the task but we have reduced the CPU capability of exploiting its superscalarity: the CPU is able to exploit its superscalarity only when the instructions belong to different categories. These remarks allow us to conclude that if the task is composed of a small number of homogeneous operations repeated a large number of times (e.g. most low-medium level IPPR tasks) and if the CPU has not as many functional units of each kind as it is its degree of superscalarity, then enhancing instruction efficiency by eliminating unnecessary instructions reduces instruction diversity and hampers superscalar execution.
Nevertheless the SLO we have applied increased the execution efficiency of the task. This is because in the CPU of the selected system the degree of instruction level parallelism due to pipeline structure is larger than the degree of instruction level parallelism due to superscalarity.
5 - Concluding Remarks The main contributions of this paper have been the identification and the quantitative analysis of the main sources of inefficiency that cause the poor performance of RISC Instruction Level Parallel (ILP) Architectures in Image Processing and Pattern Recognition (IPPR) tasks: unnecessary instructions and idle CPU cycles. In order to measure these sources of inefficiency we have defined a set of indices able to capture the independent contributions of each source to the slowdown of the tasks. We have used our indices to analyze the efficiency of a typical IPPR task, namely two dimensional convolution, on a RISC ILP architecture, namely a HP 725/100 workstation. Our analysis allowed us to plan the most beneficial source level program transformation, namely Data Type Optimization (DTO) and Loop Unrolling (LU), and to assess the impact of these transformations on the task performance; the combined application of DTO and LU produced a speed up of eight times. Finally, the performance assessment allowed us to evaluate how DTO and LU contributed to reduce the effect of each of the sources of inefficiency and also to highlight the fact that, in low-medium level IPPR tasks, it is more difficult to exploit instruction level parallelism by means of superscalarity than it is to exploit it by means of pipelining.
6 - Bibliography [1] Amano T. et al., DRS: a Workstation Based Document Recognition System for Text Entry, IEEE Computer, vol. 25, n. 7, pp. 67-71, July 1992. [2] Baglietto P., Maresca M., Migliardi M. and Zingirian N., Image Processing on High Performance RISC Systems, Proc. of IEEE, Vol. 84 n. 7, pp 917930, July 1996 [3] Ballard D. H. and Brown C. M., Computer Vision, Prentice Hall, 1982. [4] Dixit D., The SPEC Benchmarks, Parallel Computing, vol. 17, n. 1, pp. 195-209, 1991. [5] Dongarra J. J. and Gentzcsh, eds., Computer Benchmarks, North-Holland, Amsterdam, 1993. [6] Hennessy J. L. and Patterson D. A., Computer Architecture: a Quantitative Approach, MorganKauffman, 1990. [7] Hewlett Packard, HP 9000 series 700 models 735/125, September 1995.
[8] Hewlett Packard, PA-RISC 1.1 Architecture and Instruction Set Reference Manual, February 1994. [9] Jain R., The Art of Computer Systems Performance Analysis: Techniques for Experimental Design, Measurement, Simulation and Modeling, Jonh Wiley & Sons, New York, 1991. [10] Legall D., MPEG - A video Compression Standard for Multimedia Applications, Communications of the ACM, vol. 34, no. 4, pp. 4758, April 1991. [11] Migliardi M., Zingirian N. and Maresca M., Analysis of Memory Accesses in Low-Medium Level Image Processing and Pattern Recognition Tasks, DIST Tech. Rep., June 1997. [12] Saavedra R. H. and. Smith A. J, Performance Characterization of Optimizing Compilers, IEEE Transactions on Software Engineering, vol.21, no. 7, pp. 615-628, July 1995. [13] Saavedra R. H. and. Smith A. J, Measuring Cache and TLB Performance and Their Effect on Benchmark Runtimes, IEEE Transactions on Computers, vol.44, no. 10, pp. 1223-1235, Oct. 1995. [14] Stallman R. M., Using and Porting GNU CC, GNU Software Foundation, September 1994. [15] Tremblay M., P. Tirumalai, Partners in Platform Design, IEEE Spectrum, vol.32, no. 4, pp. 20-26, April 1995. [16] White S. W., Hester P. D., Kemp J. W. and McWilliams G. J., How Does Processor Performance MHz Relate to End-User Performance?, IEEE Micro, vol. 13, n. 4, pp. 8-16, August 1993.
Appendix A Definition 1 We define the minimum number of LSO instructions of a task (Lmin) as the number of LSO instructions that a load-store architecture with an infinite number of register would execute to perform the same task. Definition 2 We define the actual number of LSO instructions of a task (LACT) as the sum of all LSO instructions of the code actually executed. Definition 3 We define the number of additional LSO instructions of a task (Ladd) as the actual number of LSO instructions of a task (LACT) minus the minimum number of LSO instructions (L min) of that same task. Thus, for a given task: LACT = Lmin + Ladd (1) Definition 4 We define the minimum number of processing instructions (Pmin) of a task as the minimum number of ALBO instructions that must be executed on the data-items to complete the task. Definition 5 We define the number of actual processing instructions of a Task (PACT) as the number of ALBO instructions of a task actually executed.
Definition 6 We define the number of additional processing instructions of a task (Padd) as the actual number of processing instructions of a task (PACT) minus the minimum number of processing instructions (Pmin) of the same task. Thus for a given task: PACT = Pmin + Padd (2) Definition 7 We define the actual number of instructions of a task (IACT) as the sum of the actual number of load and store instructions (LACT) plus the actual number of processing instructions (P ACT). Thus for a given task: IACT = Pmin + Padd + Lmin + Ladd (3) Definition 8 We define the minimum number of instructions of a task (Imin) as the sum of the minimum number of LSO instructions of the task (Lmin) plus the minimum number of processing instructions of the task (Pmin) Definition 9 We define the Load Efficiency Index (,) of a task as
L = 1−
L I
add
ACT (4) Definition 10 We define the reduced actual number of instructions of a task (IACTR) as the number of actual instructions of the task (IACT) minus the number of additional Load and Stores of the task (L add).
I
ACTR
=
I
−
L
add (5) Definition 11 We define the Bookkeeping Efficiency Index (0) of a task as
P = 1−
ACT
P I
add
ACTR (6) Definition 12 We define the Instruction Efficiency Index ()) of a task as the ratio
I=
I I
min ACT
(7)
Proposition 1 ) = 0, Proof From (5) and (6)
PL = PL = PL =
I
ACT
I I
ACT
I I I
min ACT
− Ladd
(8)
I
I
ACT
− Ladd ACT
ACTR
I
ACT
I
−
P
add
ACTR
− Ladd − ACT
P
− Ladd
add
that is, by (7) 0, = ) Q.E.D. Definition 13 We define the Minimum Execution Time (Tmin) of a task as the ratio
T
min
T
min
I
=
min
MaxIssue
Tcycle
(9) Definition 14 We define the Minimum Actual Execution Time (TACTmin) of a task as the ratio ACT
I
=
ACT
MaxIssue
Tcycle
(10) Definition 15 We define the Execution Efficiency Index (%) of a task as the ratio ACT
E=T T
min ACT
T T
min ACT
(11) where TACT is the measured (actual) execution time of the task. Definition 16 We define the Global Efficiency Index (') of a task as the ratio
G=
(12) where TACT is the measured (actual) execution time of the task. Proposition 2
G = ELP
(13)
Proof From (11) and (13) we obtain
ELP = T T
ACT min ACT
LP (14)
using (10)
I
ELP =
ACT
MaxIssue
Tcycle
1
T
ACT
LP (15)
By definition (8) we obtain then
ELP = I
1 1 I ACT Tcycle 1 LP ACT L P MaxIssue T
(16)
using (7)
ELP =
I I
min ACT
I
ACT
MaxIssue
Tcycle
1
T
ACT
(17)
and then (9) we end up with
ELP =
T T
min ACT
(18)
That is, by (12),
G = ELP
Q.E.D.