Scientia Horticulturae 74 Ž1998. 83–111
Modelling biomass production and yield of horticultural crops: a review L.F.M. Marcelis
a,)
, E. Heuvelink b, J. Goudriaan
c
a
b
Research Institute for Agrobiology and Soil Fertility (AB-DLO), P.O. Box 14, NL-6700 AA, Wageningen, Netherlands Wageningen Agricultural UniÕersity, Department of Horticulture, Haagsteeg 3, NL-6708 PM, Wageningen, Netherlands c Wageningen Agricultural UniÕersity, Department of Theoretical Production Ecology, P.O. Box 430, NL-6700 AK, Wageningen, Netherlands Accepted 1 August 1997
Abstract Descriptive and explanatory modelling of biomass production and yield of horticultural crops is reviewed with special reference to the simulation of leaf area, light interception, dry matter ŽDM. production, DM partitioning and DM content. Most models for prediction of harvest date Žtiming of production. are descriptive. For DM production many descriptive and explanatory models have been developed. Most explanatory models are photosynthesis-based models. Important components of photosynthesis-based models are leaf area development, light interception, photosynthesis and respiration. Leaf area is predominantly simulated as a function of plant developmental stage or of simulated leaf dry weight. Crop photosynthesis can be calculated as a function of intercepted radiation or more accurately by considering radiation absorption of different leaf layers in combination with a submodel for leaf photosynthesis. In most crop growth models respiration is subdivided into two components: growth and maintenance. There is reasonable consensus concerning the simulation of growth respiration, but the simulation of maintenance respiration is still an area of great uncertainty, which is especially important for large crops grown under winter conditions at relatively high greenhouse temperatures. DM partitioning can be simulated by descriptive allometry, functional equilibrium or sink regulation. The most suitable approach depends on the type of crop studied and the aim of the model. As opposed to most agricultural crops, the DM content of the harvestable product is of great importance to the yield of most horticultural crops. More attention should be paid to the simulation of DM content. It is concluded that the strong features of explanatory crop growth models are the simulation of
)
Corresponding author. Fax: q31 317 423110; e-mail:
[email protected]
0304-4238r98r$19.00 q 1998 Elsevier Science B.V. All rights reserved. PII S 0 3 0 4 - 4 2 3 8 Ž 9 8 . 0 0 0 8 3 - 1
L.F.M. Marcelis et al.r Scientia Horticulturae 74 (1998) 83–111
84
light interception and gross photosynthesis, while the weak features are the simulation of leaf area development, maintenance respiration, organ abortion, DM content and product quality. q 1998 Elsevier Science B.V. Keywords: Dry matter content; Dry matter distribution; Dry matter production; Fruits; Greenhouse; Leaf area; Light interception; Model; Ornamentals; Partitioning; Photosynthesis; Respiration; Simulation; Vegetables; Water content
Contents 1. Introduction .
...............................................
2. Descriptive models . . . . 2.1 Growth and yield . . . 2.2 Timing of production
........................................ ........................................ ........................................
3. Explanatory models . . . . . . . . 3.1. Leaf area development . . . 3.2. Light interception . . . . . . 3.3. Photosynthesis . . . . . . . 3.4. Respiration . . . . . . . . . 3.5. Dry matter partitioning . . . 3.5.1 Descriptive allometry . 3.5.2 Functional equilibrium 3.5.3 Sink regulation . . . . . 3.6 Dry matter content . . . . 4.
Conclusion .
References
. . . . . . . . . .
. . . . . . . . . .
. . . . . . . . . .
. . . . . . . . . .
. . . . . . . . . .
. . . . . . . . . .
. . . . . . . . . .
. . . . . . . . . .
. . . . . . . . . .
. . . . . . . . . .
. . . . . . . . . .
. . . . . . . . . .
. . . . . . . . . .
. . . . . . . . . .
. . . . . . . . . .
. . . . . . . . . .
. . . . . . . . . .
. . . . . . . . . .
. . . . . . . . . .
. . . . . . . . . .
. . . . . . . . . .
. . . . . . . . . .
. . . . . . . . . .
. . . . . . . . . .
. . . . . . . . . .
. . . . . . . . . .
. . . . . . . . . .
. . . . . . . . . .
. . . . . . . . . .
. . . . . . . . . .
. . . . . . . . . .
. . . . . . . . . .
. . . . . . . . . .
. . . . . . . . . .
85 86 87
. . . . . . . . . .
88 89 92 93 95 97 98 98 99 102
...............................................
103
Acknowledgements .
. . . . . . . . . .
84
.............................................
104
..................................................
104
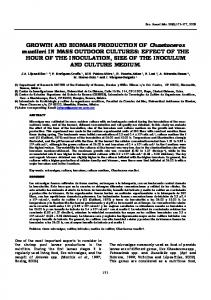
1. Introduction Models are powerful tools to test hypotheses, to synthesize knowledge, to describe and understand complex systems and to compare different scenarios. Models may be used in decision support systems, greenhouse climate control and prediction and planning of production, as discussed in more detail by Lentz Ž1998.. Consequently, the interest in modelling of biomass production and yield of horticultural crops is still increasing as indicated by the increasing proportion of horticultural publications—listed in the CAB Abstract Database—that are dealing with models. The physical yield of a crop is determined by dry matter ŽDM. production, DM distribution and the DM content of the harvestable organs ŽFig. 1.. These attributes not only relate to product volume but also to product quality. DM production is primarily driven by photosynthesis, while photosynthesis to a great extent depends on the interception of light. Leaf area is an
L.F.M. Marcelis et al.r Scientia Horticulturae 74 (1998) 83–111
85
Fig. 1. Schematic representation of important components of growth and yield of horticultural crops ŽDMsdry matter..
important determinant of light interception. Growth of the leaves is a function of the total DM production and the fraction of DM partitioned into the leaves. As horticultural products usually are sold on a fresh weight basis, yield is predominantly determined by water content. Often descriptive and explanatory models are distinguished. Descriptive models, also called statistical, regression, empirical or black-box models, reflect little or none of the mechanisms that are the cause of the behaviour of a system, whereas explanatory models consist of a quantitative description of these mechanisms and processes ŽPenning de Vries et al., 1989.. Explanatory models contain submodels at least one hierarchical level deeper than the response to be described, e.g., crop photosynthesis and leaf area expansion are processes one hierarchical level below crop growth. At the lowest hierarchical level, submodels in an explanatory model are descriptive and the model’s ability to explain is limited by its number of hierarchical levels ŽLarsen, 1990.. Although the explanatory crop growth models in horticulture do, to some extent, reflect physiological structures, they do not incorporate the complete current knowledge of the biochemical relationships that we have for many of the mechanisms at the cellular level. On the other hand, if they did, the models would be impossible to manage and use for predictions and analysis at the crop level. In this paper, descriptive and explanatory modelling of biomass production and yield of horticultural crops is reviewed with special reference to the simulation of leaf area, light interception, DM production, DM partitioning and DM content. The relation of growth and yield of plants to nutrition, water relations and plant architecture is not discussed in detail in this paper, as these aspects are reviewed by Le Bot et al. Ž1998., Jones and Tardieu Ž1998. and Prusinkiewicz Ž1998., respectively.
2. Descriptive models Descriptive models have a short computing time and they usually contain few state variables, which is important if crop models are to be used in on-line greenhouse climate control ŽLarsen, 1990; Van Straten, 1996.. Furthermore, model parameters are relatively easy to estimate ŽLarsen, 1990.. Although the predictive value of descriptive models can be high, because they implicitly take into account all unknown effects as well, there are important limitations. Extrapolation of descriptive models to other species or locations is often impossible and adding new input factors to such a model means building a new model based on an extended data set. Furthermore, when descriptive models are used
86
L.F.M. Marcelis et al.r Scientia Horticulturae 74 (1998) 83–111
outside the range of input data upon which they are based, predictions usually become unreliable. This holds to some extent also for explanatory models, especially when linear responses to temperature or polynomials are used. 2.1. Growth and yield Functions, which are often used to relate yield, crop growth or development rate directly to environmental factors, involve: polynomials ŽKrug and Liebig, 1979; Erwin and Heins, 1990., exponential functions ŽKrug and Liebig, 1988; Fisher et al., 1996., hyperbolae ŽPytlinski and Krug, 1989. or sigmoidal curves ŽLarsen and Hiden, ´ 1995; Lieth et al., 1996.. Sometimes more sophisticated functions Že.g. Larsen, 1988; Brøndum and Heins, 1993. are used to describe a reaction which is asymmetric peak-shaped. Influences of several environmental factors may be combined additively ŽKrug and Liebig, 1979. or in a multiplicative function ŽWilkerson et al., 1983; Larsen, 1990; Krug and Liebig, 1995.. Examples of descriptive models are the yield–density–time relationships described by Barnes Ž1977., the third-degree polynomial function predicting rose shoot growth rate from days from pinching, photosynthetic photon flux and day and night temperature ŽHopper et al., 1994., the function relating Pelargonium fresh weight at anthesis to day and night temperature ŽPytlinski and Krug, 1989., the model of Lieth et al. Ž1991. predicting petunia shoot dry weight gain per unit bench area, based on light intensity and average daily temperature, the relationship between radiation sum and time from transplanting until maturity in iceberg lettuce ŽWurr et al., 1988. and the model of Scaife et al. Ž1987. predicting plant weight of four vegetable species during propagation as a function of initial weight, plant density, mean daily photosynthetically active radiation ŽPAR. and effective heat sum, where each day-degree is weighed with daily PAR. Sometimes plant characteristics or previous yield data, rather than environmental factors are used as regressors in descriptive models. For example, Kool Ž1996. predicted rose productivity in the 2nd year of cultivation from the size of the stems in an early stage and Uragami et al. Ž1995. predicted from 2nd year’s harvest data yield potential for different asparagus genotypes. Although such models may be of great importance for early selection of genotypes or cultivation systems, accuracy in yield prediction depends strongly on environmental and cultural factors Že.g. length of the first harvest season in asparagus; Bussell et al., 1988.. Often developmental stages Že.g. germination, young crop, producing crop or vegetative crop, floral initiation and floral development. are distinguished in descriptive models Že.g. Liebig and Krug, 1990; Larsen, 1988.. Considering different stages, however, does not make a model explanatory, because submodels are all at the same hierarchical level. Time to emergence is often accurately predicted by the heat sum ŽBierhuizen and Wagenvoort, 1974; Krug et al., 1989.. However, such a simple approach is only valid in a limited temperature range, where rate of emergence is linearly related to temperature. Larsen Ž1988. therefore used a double exponential expression to relate rate of emergence to temperature, resulting in an asymmetric peak-shaped response. Krug and Liebig Ž1995. split the raising period of lettuce transplants into an exponential phase followed by a linear phase. In the first phase the
L.F.M. Marcelis et al.r Scientia Horticulturae 74 (1998) 83–111
87
relative growth rate and in the second phase the growth rate was predicted based on mean air temperature, mean global irradiance, artificial light intensity and mean soil temperature ŽKrug and Liebig, 1995.. For a young cucumber crop, Liebig Ž1980. predicted the time until 1 kg of fruits was produced, based on mean temperature and mean global radiation. Thereafter, Liebig and Krug Ž1990. related yield directly to week of the year. 2.2. Timing of production Many models have been developed for prediction of harvest date Žgrowing period.. This is very relevant with respect to production planning and marketing strategy. When timing of production is modelled we are often dealing with models of crop development, e.g. germination, leaf unfolding, flower development, fruit development, etc. Although explanatory photosynthesis-based models could be used for prediction of harvest date Že.g. Marcelis and Gijzen, 1998., most timing models are simple and descriptive, because little is known about the mechanisms involved. The most straightforward models in this field are based on heat sums, e.g. Ottoson Ž1973., predicting harvest date of peas. The use of a heat sum implies that temperature is the predominant limiting factor and that the process rate is linearly related to temperature above a certain threshold Žminimum temperature.. This assumption is often valid for a large temperature range when processes like seedling emergence ŽBierhuizen and Wagenvoort, 1974. or leaf initiation rate ŽKarlsson et al., 1988; Erwin and Heins, 1990; Karlsson et al., 1991; De Koning, 1996. are considered. However, Wurr et al. Ž1988. showed that heat sum Žaccumulated day-degrees. was a poor predictor of crisp lettuce maturity, while accumulated solar radiation or effective day-degrees from field transplanting were accurate predictors. A heat sum model may be extended to other limiting factors, e.g. Kish and Ogle Ž1980. showed that including soil water status in their heat sum model leads to a more accurate estimate of harvest date of beans. Models predicting growth or development as a function of environmental factors can be used in production planning, when a certain weight Že.g. Krug and Liebig, 1979, 1994. or development stage ŽArmitage et al., 1981; Fisher and Heins, 1996. matches the end of cultivation or a cultivation phase. Fisher and Heins Ž1996. developed the greenhouse CARE system, a computer decision support tool to control and predict height and development Žflowering. of poinsettia, Easter lily and chrysanthemum crops using graphical tracking. In this system, height and development rate are controlled by average temperature and photoperiod. However, for Easter lily, flowering date is predicted based on temperature alone, using a leaf unfolding rate model, a day to flower model and a model predicting flower bud development ŽEhler et al., 1996.. Wurr et al. Ž1990. predicted when cauliflower curds of any specific size were produced from a quadratic relationship between the logarithm of curd diameter and accumulated heat sum from curd initiation. Grevsen Ž1990. used a linear relationship between these parameters in his harvest date prediction model. A similar model was developed for broccoli, however, using a ‘time-scale’ incorporating both temperature and light, which accounted for plant density effects ŽWurr et al., 1992.. Pearson et al. Ž1994. predicted time to curd initiation based on heat sum, whereas curd growth was
88
L.F.M. Marcelis et al.r Scientia Horticulturae 74 (1998) 83–111
described by a linear ontogenetic decline in potential relative curd growth rate with heat sum, combined with instantaneous effects of temperature on this rate. Wiebe Ž1975. estimated harvest date of cauliflower based on temperature, starting from a seedling with 10 leaves and dividing development into three phases Žleaf formation, vernalization and curd growth.. However, no validation of Wiebe’s model has been published.
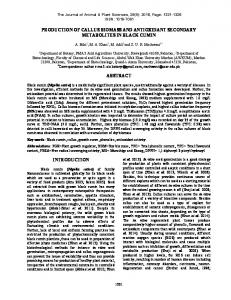
3. Explanatory models Explanatory models, more than descriptive models, allow for testing hypotheses and synthesizing knowledge and facilitate comprehension of complex systems. Most explanatory models are photosynthesis-based models ŽFig. 2.. These models are processoriented, while models based on plant growth analysis could be classified as functionoriented models ŽGary et al., 1998.. In plant growth analysis, relative growth rate ŽRGR. is separated in a ‘photosynthetic term’, unit leaf rate or net assimilation rate ŽNAR. and a ‘morphogenetic term’, leaf area ratio ŽLAR; Hunt, 1982.. LAR may be further separated into the leaf weight ratio ŽLWR., the ratio of leaf dry weight over total plant dry weight, and the specific leaf area ŽSLA., the ratio of leaf area over leaf dry weight.
Fig. 2. A typical relational diagram for a growth model of an horticultural crop Žadapted from the work of Heuvelink Ž1996b... Boxes are state variables, circles are parameters and valves are rate variables. Solid lines represent carbon flow and dashed lines represent information flow ŽDMsdry matter..
L.F.M. Marcelis et al.r Scientia Horticulturae 74 (1998) 83–111
89
Growth analysis has been proven to be highly effective in studying a plant’s reaction to environmental conditions and comparison between species. However, it has its limitations, especially when analysing crop growth, where mutual shading of leaves begins within a few weeks of emergence and is the major reason for a rapid decline of both RGR and NAR ŽGoudriaan and Monteith, 1990.. A recent evaluation of experimental design and computational methods in plant growth analysis is given by Poorter and Garnier Ž1996.. In photosynthesis-based models first the interception of light by the leaf area is calculated to simulate the production of photosynthates. Subsequently, the use of photosynthates for respiration, conversion into structural DM, the partitioning of assimilates or DM among the different plant organs is calculated and finally the fresh weight can be estimated from the dry weight. Where descriptive models typically have an integration interval of 1 day or 1 week, in explanatory models different integration intervals apply to the different submodels. For example, an integration interval of 1 day is appropriate for simulation of development and DM partitioning, whereas for simulation of photosynthesis an integration interval one order of magnitude smaller Žtypically 1 h. is preferred. The closer the modelled process is to an enzyme reaction the faster the model must respond and a shorter integration interval is needed. For vegetables and fruits many photosynthesis-based models have been developed, but for the large group of ornamentals only a few models are available ŽTable 1.. 3.1. Leaf area deÕelopment Despite the importance of leaf area development for crop growth, its prediction is still a weak feature in crop growth models, as the controls that actually regulate leaf area development rate are not well understood. In several studies, leaf area Žor leaf area index, LAI. is not simulated but given as input to the model ŽTable 1.. Leaf area development can be seen as a combination of four processes: leaf emergence rate, rate and duration of expansion of individual leaves and lifetime Žduration. of individual leaves. Based on these processes, models for leaf growth in tobacco ŽHackett, 1973. and sugar beet ŽChalabi et al., 1986. have been developed. Mutsaers Ž1983. did the same for cotton, also simulating the rate of branch production, which in many crops is more important for leaf production than the initiation of leaves from each apex. Although some models for bud break have been reported ŽErez et al., 1990; Del Real-Laborde et al., 1990., in several crops the prediction of bud break limits the simulation of leaf emergence. The leaves of a crop form a heterogeneous population, as they differ in age and their properties change as they age. Harper Ž1989. concluded that, if leaf emergence and survival rate are known, together with information on age-specific leaf photosynthesis, a full demographic model to predict canopy performance may be built. However, often, leaf area development of the crop as a whole is simulated, rather than that of individual leaves. In general, this is sufficient for most crop growth model purposes. An explicit expression for LAI development in time, resulting in an expolinear growth pattern was presented by Goudriaan and Monteith Ž1990.. Although a very useful equation, the underlying assumption that LAR remains constant is the exception rather than the rule in crop growth.
L.F.M. Marcelis et al.r Scientia Horticulturae 74 (1998) 83–111
90
Table 1 Photosynthesis-based models in horticulture Crop
Leaf area
Photosynthesis
Partitioning
Authors
General Annual field crops
DVS, W)SLA DVS
leaf: exponential 0c
allometry allometry
Spitters et al. Ž1989. Williams et al. Ž1989.
Vegetables Bean Carrot Cucumber Faba bean Grain legumes Greenhouse vegetables
y DVS, W)SLA 0 W)SLA W)SLA 0 DVS, W)SLA
sink allometry sink allometry allometry allometry allometry, sink d 0 allometry sink sink
Gutıerrez et al. Ž1994. ´ De Visser et al. Ž1995. Marcelis Ž1994. Grashoff and Stokkers Ž1992. Hoogenboom et al. Ž1992. Gijzen Ž1992. Gijzen et al. Ž1998.
W)SLA DVS, W)SLA W)SLA W)SLAb
canopy: sink leaf: exponential leaf: exponential leaf: exponential canopy: exponential leaf: exponential leaf: hyperbola, biochemicald canopy: hyperbolic leaf: exponential canopy: hyperbolic leaf: hyperbolic
0 W)SLA
0 leaf: exponential
sink sink
Schefflera
W)SLA 0 W)SLA
leaf: hyperbolic leaf: exponential leaf: exponential
sink allometry allometry
Tulip
W)SLA
leaf: exponential
allometry
Lieth and Pasian Ž1991. Kool and De Koning Ž1996. Leutscher and Vogelezang Ž1990. Benschop Ž1985.
y DVS 0
canopy: sink driven canopy: hyperbolic leaf: hyperbolic canopy: hyperbolic canopy: hyperbolic canopy: sink driven leaf: hyperbolic leaf: exponential
sink 0 allometry sink sink sink sink sink
Baumgartner et al. Ž1986. ¨ Lakso and Johnson Ž1990. Wagenmakers Ž1995. Goldschmidt et al. Ž1992. Gutıerrez et al. Ž1985. ´ Wermelinger et al. Ž1991. Buwalda Ž1991. Grossman and DeJong Ž1994.
Lettuce Onion Tomato
Ornamentals Rose
Fruits Apple
Citrus Grape Kiwifruit Peach
a a
W)SLA DVS W)SLA
Van Henten Ž1994. De Visser Ž1994. Kano and Van Bavel Ž1988. Dayan et al. Ž1993a., Gary et al. Ž1995. De Koning Ž1994. Heuvelink Ž1996b.
The main characteristics for the simulation of leaf area development, photosynthesis and partitioning among organs are indicated. The following main approaches are discerned: leaf area development is simulated as a function of developmental stage ŽDVS, often determined by heat sum. or of simulated leaf weight multiplied by specific leaf area ŽW)SLA.. Canopy photosynthesis is simulated directly Ž‘big leaf’ approach: canopy. or from leaf photosynthesis Žleaf. using hyperbolic or exponential functions or biochemical or sink-driven models. Partitioning is simulated by allometry or sink regulation. 0 and y indicate that the process is not simulated and not described in detail, respectively. a An effective rather than an actual leaf area was modelled. b Gary adapted the model of Dayan such that leaf area was mainly a function of temperature and physiological age. c Potential growth was directly calculated from light interception and day length. d The model of Gijzen et al. Ž1998. contains several options for simulating photosynthesis and partitioning.
L.F.M. Marcelis et al.r Scientia Horticulturae 74 (1998) 83–111
91
Two approaches of simulating plant leaf area development are predominantly used: Ž1. leaf area is described as a function of plant developmental stage or Ž2. leaf area is predicted from simulated leaf dry weight ŽTable 1.. Sometimes these approaches are used in combination ŽTable 1.. Although the area of individual leaves is often affected by assimilate availability Žradiation. ŽHeuvelink and Marcelis, 1996., leaf area development can be simulated accurately on the basis of plant developmental stage Žtemperature sum. in those situations where radiation is rather constant on a weekly basis or strongly correlates with temperature ŽGoudriaan and Monteith, 1990., which conditions are often satisfied in field production. Especially in greenhouse horticulture, simulation of leaf area development based on plant developmental stage is often inaccurate as the growing season is Žalmost. year-round Že.g. a variation of 1:8 in daily light integrals at a latitude of 518N; Cockshull, 1988. and leaf area development is often strongly influenced by radiation ŽNilwik, 1981; Marcelis, 1993d.. Furthermore, in greenhouses the correlation between temperature and radiation is small compared to open field conditions. A more flexible way of simulating leaf area is obtained when leaf area is calculated on the basis of simulated leaf biomass and SLA. This approach has been used in several crop models ŽTable 1.. SLA is assumed to be constant ŽVan Keulen et al., 1982; Lieth and Pasian, 1991., or simulated as a function of plant age ŽLeutscher and Vogelezang, 1990., physiological age ŽWermelinger et al., 1991., season ŽHeuvelink, 1996b., developmental stage and plant density ŽDe Visser, 1994. or environmental conditions ŽHoogenboom et al., 1992; Dayan et al., 1993a.. These functions refer to SLA of the new leaf area formed or to the overall SLA of the crop. This approach in fact shifts the modelling problem from leaf area to SLA. SLA is known to be affected by many factors, such as light intensity, temperature, sink–source ratio Žnumber of fruits., and CO 2 concentration ŽEnoch, 1990; Marcelis, 1993d.. However, quantitative knowledge of the underlying principles of these effects and their interactions is limited and therefore simulation of SLA is difficult. Thornley and Hurd Ž1974. developed a model assuming a constant structural LAR ŽLAR for structural DM., whereas actual LAR resulted from leaf area and total plant DM Žstructural and storage.. As LWR is rather constant ŽHunt, 1982., this also means a constant structural SLA. Actual SLA then decreases as a result of storage of assimilates in the leaves. Introducing this hypothesis in an existing tomato crop model greatly improved the model’s ability to predict SLA ŽGary et al., 1993.. However, well known structural adaptations of leaf anatomy to external conditions ŽEsau, 1953. are ignored. Taking these adaptations into account, Gary et al. Ž1995. calculated leaf area mainly as a function of temperature and physiological age and allowed structural SLA to vary between a minimum Žfull satisfaction of growth demand. and a maximum Žminimum leaf thickness. value. This may be a promising way to simulate SLA and thus leaf area expansion, although Gary et al. Ž1995. did not validate this part of their model. In addition to leaf area increase, cessation of this increase or even reduction in leaf area as a result of crop maturation or pruning needs to be simulated. The factors that control the cessation of shoot growth in fruit trees are poorly understood and not amenable to predictive modelling ŽLakso and Johnson, 1990.. Leaf decline may start after a threshold plant developmental stage has been reached Že.g. Williams et al., 1989.. Leaf removal as a crop management measure Že.g. in tomato. can be simulated by a
92
L.F.M. Marcelis et al.r Scientia Horticulturae 74 (1998) 83–111
forcing function of time or as a function of developmental stage of the trusses ŽDe Koning, 1994; Heuvelink, 1996a.. As discussed, modelling of leaf area development is usually based on crop developmental stage or DM production Ždriven by photosynthesis.. However, cell, tissue and leaf expansion are also affected by water relations. Consequently, direct effects of water status on leaf area development have been modelled Že.g. Zur and Jones, 1981; Wilkerson et al., 1983.. However, Termaat et al. Ž1985. and Ludlow Ž1987. suggested that there are no unique relationships between leaf area expansion rate and the total leaf water potential or its pressure component. Thornley and Johnson Ž1990. noted that water stress will often indirectly influence leaf area development, through reduced plant growth rate, an increased partitioning to the roots and increased carbohydrate levels due to reduced growth. 3.2. Light interception Crop production often shows a linear relation to cumulative radiation ŽCockshull, 1988. or, more generally, to cumulative intercepted radiation ŽArkebauer et al., 1994; Monteith, 1994.. Consequently, models have been developed relating biomass production linearly to intercepted radiation ŽSpitters, 1987; Morisot, 1996.. There is much debate on the validity of this approach Že.g. Arkebauer et al., 1994; Demetriades-Shah et al., 1994; Monteith, 1994.. Particularly, in greenhouses, effects of CO 2 and temperature on the relation between radiation and production might be important. For a detailed simulation of crop photosynthesis not only a calculation of the total light interception of the canopy is needed, but also the spatial variation in light interception. The absorption of radiation can be modelled from the principle that absorption of radiation increases with increasing leaf area, but that mutual shading decreases the interception. This assumption leads to exponential extinction of radiation, and is equivalent to the law of Lambert–Beer ŽMonsi and Saeki, 1953.: IrI0 s eyk ) L
Ž 1.
in which k stands for the extinction coefficient, and I and I0 for the radiation level at canopy depth L Žexpressed in overlying LAI. and at depth 0 above the canopy, respectively. Typical values for k are in the range of 0.5 to 0.8. As the extinction depends on both the geometry of radiation and on the geometry of leaf position and orientation, more detailed models have been developed ŽDe Wit, 1965; Ross, 1981.. At any location within the plant canopy, radiation is composed of contributions from all directions. These different contributions can be grouped according to their zonal direction and azimuth. The angle of incidence of radiation on a leaf will depend on leaf orientation and the radiation direction. If leaf positions are at random, each new leaf area unit will intercept the same fraction and the resulting radiation profile will follow the exponential function ŽEq. Ž1... For horizontal leaves, the fraction of radiation intercepted by any leaf will be proportional to the leaf area itself, independent of the radiation direction. Then the whole profile will be characterized by a single exponential function with an extinction coefficient k at the value of 1. In general, however, k will be different for each radiation direction, and the total profile will be an
L.F.M. Marcelis et al.r Scientia Horticulturae 74 (1998) 83–111
93
addition of many different exponential profiles. This means that the resulting profile of radiation is only approximately exponential, although the exponential function will be the most practical approximation ŽGoudriaan, 1988; Heuvelink, 1996b.. Because direct and diffuse light have different extinction profiles in the canopy and because of light saturation of photosynthesis, the solar beam Ždirect flux. should be singled out from the rest of the incoming radiation Ždiffuse flux., so that radiation is at least partitioned into these two components ŽSpitters, 1986.. It is possible to subdivide the diffuse flux according to zonal segment ŽGoudriaan and Van Laar, 1994., but if this is not done the extinction coefficient for the diffuse flux can be assumed to be about 0.7 on average. For low values of LAI, radiation from grazing angles tends to be intercepted first, which will raise the extinction coefficient up to a value close to unity. On the other hand, in sparse canopies the leaves may be strongly clustered which tends to reduce the extinction coefficient. Unless there is strong evidence for occurrence of the one or the other effect, there is no reason to deviate from the default value of 0.7 for the extinction coefficient. Detailed numerical simulation of the radiation absorption Ž Iabs, L : radiation absorbed by the overlying LAI. has shown that its approximation by Iabs , L s Ž 1 y r . I0 Ž 1 y eyk ) L .
Ž 2.
is excellent, and never deviates more than 1 or 2% from a detailed simulation with sunlit and shaded leaves ŽGoudriaan, unpublished data.. The value of the canopy reflection coefficient r should be taken as measured. If they are not available from measurements, the default values for k and r of 0.7 and 0.07, respectively can be used. Effects of the row structure on the radiation geometry have been discussed by several authors ŽGijzen and Goudriaan, 1989; Palmer, 1989; Critten, 1993; Wagenmakers, 1995.. For light transmissivity of the greenhouse, reliable models are available ŽBot, 1983; Critten, 1993; Heuvelink et al., 1995.. At the leaf level, absorption of PAR by green leaves is about 80–85% ŽMoss and Loomis, 1952; Heuvelink, 1996b.. At the canopy level, the resulting absorption is larger because radiation is scattered and leaves may have multiple opportunities to absorb. For a LAI above a value of 3, almost 90% of PAR is absorbed by the canopy. White cover on the soil surface may reflect 50–80% of the PAR and increase crop photosynthesis by at least 7% for a LAI of 3 ŽGijzen, 1995a.. 3.3. Photosynthesis Models for leaf photosynthesis used in horticulture have been reviewed by Longuenesse et al. Ž1993. and Gijzen Ž1995a.. For leaves the light response curve of gross photosynthesis Ž Pg . can be generalized to: Pg s Pg ,max = f Ž x .
Ž 3.
where Pg,max stands for the maximum rate of leaf photosynthesis and x for the dimensionless group ´ HrPg,max , ´ for the initial light use efficiency and H for absorbed radiation per leaf area. The function value f Ž x . ranges from 0 in darkness to 1 at saturating light intensities, when the maximum rate of photosynthesis Pg,max is
L.F.M. Marcelis et al.r Scientia Horticulturae 74 (1998) 83–111
94
reached. One of the most general functions for this relation is the non-rectangular hyperbola: 2
f Ž x . s 1 q x y 6 Ž Ž 1 q x . y 4 xu . r Ž 2 u . .
½
5
Ž 4.
The parameter u regulates the shape of this function. u varies between 0 Žleading to the softly rounded rectangular hyperbola. and 1 Žleading to the sharp-shouldered Blackman response.. For the intermediate value of 0.7, the shape of the function is very close to the widely used negative exponential function: f Ž x . s 1 y eyx
Ž 5.
Both ´ and Pg,max depend on CO 2 and temperature, and these effects are incorporated in several leaf photosynthesis models Že.g. Goudriaan et al., 1985; Acock, 1991.. Especially at high light levels the stomatal resistance may limit photosynthesis. Consequently, effects of stomatal resistance on photosynthesis are often incorporated in models by simulating a negative influence of stomatal resistance on Pg,max ŽThornley, 1976; Goudriaan et al., 1985.. The control and modelling of stomatal resistance has recently been reviewed by several authors Že.g. Gijzen, 1995b; Leuning, 1995; Monteith, 1995.. In the biochemical approach of Farquhar et al. Ž1980., the photosynthetic properties of the leaf are expressed in the basic characteristics of Rubisco enzyme kinetics and electron transport capacity. This approach enables an explanatory description of the temperature and CO 2 dependence of photosynthesis, and is therefore a big step forward. The equations predict an optimum temperature for light saturated leaf photosynthesis, which will shift to higher temperatures with increasing ambient CO 2 concentrations. Leaf and canopy photosynthesis proceed at a higher rate when the ambient CO 2 concentration is higher. This is not only caused by faster diffusion of CO 2 through the physical barrier of the stomatal pores, but also by suppression of the binding of Rubisco with oxygen, which is the cause of photorespiration. This effect will also occur at low radiation levels, which explains why CO 2 enrichment can increase photosynthesis even far below light saturation. The enzyme Rubisco does not have a high affinity to CO 2 , and therefore large quantities are needed to reach a reasonable rate of photosynthesis. Normally, this enzyme contains as much as 25–40% of the total leaf nitrogen, so that it is understandable that leaf nitrogen and leaf photosynthetic capacity are strongly correlated ŽPons et al., 1990.. Nitrogen can be considered as a costly resource for the plant, and it will economize on its use where possible. This explains why leaf nitrogen content as well as leaf photosynthetic capacity decrease from top to bottom ŽPons et al., 1990.. At the top of the canopy, at higher radiation levels, the costly nitrogen is used more effectively. Respiration increases with temperature and also with nitrogen content, which is another reason for an upper limit to leaf nitrogen, especially when temperatures are high. Under high light conditions andror high CO 2 concentrations, the supply of photosynthetic products may exceed the demand, especially when there are only a few sinks available. The photosynthetic products will build up in the leaves, and finally this may cause feed-back inhibition of leaf photosynthesis Že.g. Stitt, 1991.. Some models calculate photosynthesis to be sink driven Že.g. Wermelinger et al., 1991; Gutıerrez et ´
L.F.M. Marcelis et al.r Scientia Horticulturae 74 (1998) 83–111
95
al., 1994.. Although this sink effect has been proved to exist, its practical meaning in greenhouse horticulture is quite limited ŽMarcelis, 1991; Heuvelink and Buiskool, 1995.. Probably the occurrence of feed-back inhibition depends on crop species and cultivation conditions. Canopy photosynthesis can be simulated by applying the total intercepted radiation in the equation for leaf photosynthesis ŽEq. Ž3.; Leutscher and Vogelezang, 1990., but with different parameter values. This approach can be classified as the ‘big leaf’ approach. More accurately, the earlier mentioned exponential radiation profile ŽSection 3.2. can be used to calculate irradiation per leaf, find its rate of photosynthesis from the leaf properties and proceed with the numerical integration over the leaf canopy. In a few cases Že.g. rectangular hyperbola., an analytical solution is possible ŽAcock et al., 1978., so that a numerical result can be checked, but this is an exception. The numerical integration over the leaf canopy can be done simply by splitting the canopy into layers and adding their contributions layerwise, or more efficiently, by using Gaussian integration ŽGoudriaan and Van Laar, 1994.. This numerical procedure is more general than an analytical approach, and it can also handle the situation of a vertical profile of leaf photosynthetic properties. In the case of direct sunshine, it is also necessary to distinguish at each canopy level between directly illuminated leaves and shaded leaves, because the radiation levels to which they are exposed are very different. Within the group of sunlit leaves a further variation exists because of different leaf orientations with respect to the incident solar beam. This necessitates a second numerical integration, nested within the earlier mentioned integration over the leaf canopy, but again Gaussian integration can reduce the computational load. For most cases the assumption of a spherical leaf angle distribution Žrandom distribution. is satisfying ŽGoudriaan and Van Laar, 1994.. Even in the odd case of an outspoken deviating leaf angle distribution, no more than three leaf angle classes are needed ŽGoudriaan, 1988.. Further refinement of these modules does not seem necessary at the present state of the art. In comparison with radiation distribution, the problems of growth of leaf area, formation of leaves and determination of their photosynthetic properties are much more urgent issues. Modelling of canopy photosynthesis is largely independent of plant species. Plant type comes in at the parameter values of leaf photosynthetic properties, and of radiation interception such as extinction coefficient and leaf angle distribution. The maximum rate of leaf photosynthesis, but not the initial light use efficiency, shows significant genetic differences within C 3 and C 4 plant types ŽCharles-Edwards, 1978; Flore and Lakso, 1989.. However, these genetic differences are not necessarily correlated with differences in DM production ŽCharles-Edwards, 1978.. In fact, plant breeding has not done much in terms of photosynthesis, but much more in terms of partitioning ŽGifford et al., 1984.. 3.4. Respiration In most crop growth models, respiration is subdivided into two components: growth and maintenance ŽAmthor, 1989.. Respiration for ion uptake may be an important third component ŽJohnson, 1990; Bouma et al., 1996.. Probably, due to the limited knowledge
96
L.F.M. Marcelis et al.r Scientia Horticulturae 74 (1998) 83–111
available on respiratory costs for ion uptake, most crop models do not consider this component of respiration explicitly. As nutrient uptake correlates with the growth rate ŽBoone and Veen, 1994., in most crop models the energy costs for nutrient uptake are considered as a part of growth respiration. Maintenance respiration is usually calculated as the product of dry weight and the maintenance coefficient Žspecific respiratory costs for maintenance.. Maintenance respiration is assumed to have priority above growth. First the amount of assimilates needed for maintenance respiration Ž R m . is subtracted from gross photosynthesis Ž Pg . and the remaining assimilates are available for dry mass increase ŽdWrdt . dWrdt s Yg ) Ž Pg y R m .
Ž 6.
where Yg is the growth conversion efficiency, which is the weight of dry mass formed per unit weight of assimilates; 1rYg s 1 q g where g is the growth coefficient of respiration Žspecific respiratory costs for growth.. Although there are some attempts to model maintenance respiration based on the underlying processes such as protein turnover and ion fluxes ŽBouma, 1995., this approach is still not feasible for crop growth models. In most models the maintenance coefficient is calculated as a function of temperature and organ type. The maintenance coefficient usually increases with temperature, according to a Q10 of about 2 ŽAmthor, 1984.. Typical values for maintenance coefficients of leaves, stems, roots and storage organs at 258C are 0.03, 0.015, 0.015 and 0.01 g CH 2 O gy1 DM dy1 , respectively ŽPenning de Vries and Van Laar, 1982.. The maintenance coefficients may decrease with crop age and decreasing crop growth rate ŽMcCree, 1982, 1988; Amthor, 1989. probably as a result of decreased metabolic activity ŽAmthor, 1984.. Therefore, De Wit et al. Ž1978. simulated the maintenance costs as a function of the quantities of proteins and minerals present in the biomass and the crop metabolic activity. According to Van Keulen and Seligman Ž1987. the effect of crop age may be accounted for by relating the maintenance coefficient to the N content, but McCree Ž1988. showed that the N content does not totally explain the ontogenetic changes in maintenance costs. When N content is not simulated, it might be an option to make the maintenance coefficient of each organ a function of its age ŽJohnson and Thornley, 1983. or relative growth rate of the crop ŽHeuvelink, 1995a.. Effects of CO 2 on respiration are not yet well understood, but the maintenance coefficient is likely to decrease at increased CO 2 concentration ŽWullschleger et al., 1994.. Growth respiration is usually calculated as the product of dry weight growth rate and a growth coefficient Žspecific respiratory costs for growth.. The growth coefficient mainly depends on the chemical composition of the biomass formed and that of the substrate from which it is derived ŽPenning de Vries et al., 1974; Amthor, 1989.. It can be calculated as a function of six chemical components ŽPenning de Vries et al., 1974; Penning de Vries and Van Laar, 1982. or as a function of C and N concentration or C and ash concentration ŽVertregt and Penning de Vries, 1987.. For vegetative biomass, a value of Yg of 0.7 will often do fairly well ŽPenning de Vries and Van Laar, 1982.. In most models Yg Žor g . is a function of the species and organ type. Although there is some experimental evidence that temperature may affect the growth coefficient ŽAmthor, 1989; Gifford, 1995., in simulation models the simulated growth coefficient is usually
L.F.M. Marcelis et al.r Scientia Horticulturae 74 (1998) 83–111
97
independent of environmental factors including temperature, because the pathways of converting assimilates into plant material are thought to remain the same ŽPenning de Vries et al., 1974.. A possible decrease in growth coefficient at raised CO 2 concentration ŽWullschleger et al., 1994. is not considered in crop models. Some authors ŽMcCree, 1982; Bunce, 1989; Gifford, 1995. reported that in several cases the daily respiration costs as a fraction of the assimilates produced may be fairly constant Ž40%. in the long term and therefore they proposed that respiration could be simply modelled as a constant fraction of gross photosynthesis. However, this might be an oversimplification as there is strong evidence that respiration costs as a fraction of the assimilates produced may vary strongly with growth rate Žassimilate supply., temperature and plant size ŽAmthor, 1984.. Poorter et al. Ž1990., studying 24 species, reported this fraction to vary between 27 and 50%. The simulated amounts of assimilates used for maintenance respiration as a fraction of the gross assimilate production over a whole growth cycle were about 30% for greenhouse tomato ŽHeuvelink, 1995a., 33% for peach ŽGrossman and DeJong, 1994. and depending on latitude and harvest date it varied between 30–80% for apple ŽWagenmakers, 1995.. Due to the uncertainty about maintenance respiration substantial errors in predicting DM production may occur ŽHeuvelink, 1995a.. This may be particularly relevant for greenhouse production when large crops Že.g. roses, fruit vegetables. are grown under low light conditions and relatively high temperatures. For example, Kool and De Koning Ž1996. unrealistically simulated a dry weight decrease of a rose crop during some periods, where this was presumably the result of an overestimation of maintenance respiration. There is reasonable consensus concerning the simulation of growth respiration ŽThornley and Johnson, 1990.. However, the simulation of maintenance respiration is still an area of great uncertainty. Although the functional separation of respiration into a growth and maintenance component is embraced by many modellers because of its relative simplicity, the physiology of it might be more complicated than usually assumed ŽAmthor, 1989.. Therefore, Johnson Ž1990. proposed to model plant respiration to be composed of five instead of two components, while Shinano et al. Ž1996. suggested to subdivide respiration into current photosynthate respiration and storage substance respiration instead of growth and maintenance respiration. 3.5. Dry matter partitioning Although there is considerable information on the operation of individual processes in plants such as photosynthesis, sugar metabolism, translocation, and cell expansion, the controls which actually regulate the partitioning of DM at the crop level are still only poorly understood ŽWardlaw, 1990.. However, there has recently been quite some progress in quantifying and modelling DM partitioning in fruits Že.g. Wermelinger et al., 1991; Grossman and DeJong, 1994. and fruit vegetables Že.g. Dayan et al., 1993a,b; Marcelis, 1994; De Koning, 1994; Heuvelink, 1996a.. There seems to be a great diversity in the way a crop partitions its assimilates. Consequently, the simulation models available at the moment are rather species specific. The most suitable simulation approach depends on the type of crop studied and the aim of the model. Besides genotype, developmental stage of the plant, many growth conditions and internal
98
L.F.M. Marcelis et al.r Scientia Horticulturae 74 (1998) 83–111
regulation by the plant may also affect DM partitioning Že.g. Marcelis, 1996.. Only the DM partitioned into the harvestable organs contributes to the yield of the crop, indicating the importance of correctly simulating DM partitioning. However, for rapid growth of small Žyoung. plants, DM partitioning into the leaves is important, because a large fraction of the light is not yet intercepted by the leaves. Besides, in many crops like fruit vegetables, where harvestable organs are produced over an extended period, an optimum balance between partitioning into the harvestable organs Žshort-term productivity. and the other plant parts Žvegetative parts: future production capacity. should be maintained. Palmer Ž1986. suggested that for a regular perennial production pattern of apple fruits the fraction of assimilates partitioned into the fruits should not exceed 60–65%. In addition, partitioning relates to product quality, e.g. plant shape of ornamentals or number vs. size of individual fruits and shoots. Cannell and Dewar Ž1994. distinguished six functional relationships when reviewing models of partitioning in trees, while Marcelis Ž1993a. distinguished three main approaches for simulation of DM partitioning: descriptive allometry, functional equilibrium and sink regulation, roughly representing an empirical, a teleonomic and a mechanistic approach, respectively ŽThornley and Johnson, 1990.. 3.5.1. DescriptiÕe allometry In descriptive allometry models, a predetermined ratio between growth rates or relative growth rates is assumed ŽPenning de Vries and Van Laar, 1982; Wilson, 1988.. This ratio may be a constant or a function of developmental stage of the crop Žtime, temperature sum or plant size.. Effects of climatic conditions are often not considered, although the ratios might be made a function of environmental factors Že.g. Williams et al., 1989; Hoogenboom et al., 1992.. This simulation approach provides a simple description of DM partitioning, contains a high level of empiricism and is the one mostly used in crop growth models ŽMarcelis, 1993a.. As in many situations both quantitative and mechanistic informations on DM partitioning is limited, a more detailed simulation approach is often not feasible. The model results may agree rather well with experimental results. However, these models describe DM distribution often only under a limited range of growth conditions ŽFick et al., 1975; Wilson, 1988.. Moreover, it is not valid for a dynamic simulation of DM partitioning in indeterminately growing crops such as fruit vegetables where DM partitioning between vegetative and generative growth may fluctuate irrespective of crop age or growth conditions ŽDe Koning, 1989; Marcelis, 1992a. or, in perennial fruit trees, with alternate bearing ŽMonselise and Goldschmidt, 1982.. 3.5.2. Functional equilibrium The functional equilibrium approach Že.g. Brouwer and De Wit, 1969; De Willigen and Van Noordwijk, 1987. proposes that the DM distribution between root and shoot is regulated by an equilibrium between root activity Žwater or nutrient absorption. and shoot activity Žphotosynthesis.. This approach can be formulated as: WrrWs A SsrSr Ž 7. where Wr is root mass; Ws is shoot mass; Ss is specific photosynthesis rate of the shoot and Sr is specific absorption rate of the root. In this approach environmental conditions
L.F.M. Marcelis et al.r Scientia Horticulturae 74 (1998) 83–111
99
that reduce the specific activity of the roots such as a decrease in water supply or nutrients, a decrease in water potential, and temperature above or below the optimum temperature for root functioning, or conditions that increase the specific activity of the shoot, such as an increase in light intensity or CO 2 concentration, increase the DM partitioning toward the roots ŽWilson, 1988; Enoch, 1990.. In some models root and shoot activity affect DM partitioning indirectly as the DM distribution is related to the ratio of the C:N concentration of the plant ŽReynolds and ˚ Thornley, 1982; Makela, and Ingestad, ¨ ¨ 1986. or the N concentration of the plant ŽAgren 1987; Van der Werf et al., 1993.. Closely related to the functional equilibrium models are coordination models ŽReynolds and Chen, 1996; Chen and Reynolds, 1997.. In coordination models some plant phenomenon Že.g. relative growth rate. is regulated by the balance between two or more processes Že.g. growth rate as determined by carbon supply and growth rate as determined by water supply.. These models assume that the balance is maintained by various means of ‘coordination’ Že.g. allocation., while changing external conditions tend to drive the plant towards an imbalance. The functional equilibrium models can be considered as teleonomic models ŽThornley and Johnson, 1990.. Teleonomic models are applicable to goal-directed behaviour and are formulated explicitly in terms of goals. For instance, the proportionality between WrrWs and SsrSr in Eq. Ž7. can be considered as a goal or it can be interpreted as that the plant ‘seeks’ more carbon by partitioning more DM to the shoot when the supply of carbon is reduced; similarly, it ‘seeks’ more nitrogen by partitioning more growth to the root when the supply of nitrogen is reduced ŽThornley and Johnson, 1990.. Many teleonomic models assume that DM partitioning between shoot and root is regulated in such a way that the relative growth rate of the plant is maximized Že.g. Hilbert, 1990; Kastner-Maresch and Mooney, 1994.. Thornley Ž1995. concluded that optimization models are useful for simulating equilibrium states, but may fail to simulate ontogenetic effects or effects of dynamically changing growth conditions. According to Reynolds and Chen Ž1996. and Chen and Reynolds Ž1997. part of the flaws of optimization models can be overcome by coordination models. Although the functional equilibrium approach is often rather successful in simulating the ratio between shoot and root dry weight in vegetative plants, it is not easily applicable to ratios between other plant organs and the underlying mechanism is quite complicated and not well understood ŽFarrar, 1992; Buysse et al., 1996; see also special issue of Plant and Soil, 185, 1996.. For partitioning in reproductive plants a teleonomic approach might be useful, although examples in horticulture are unknown to us. The goal of a reproductive plant could be to optimize either the instantaneous growth rate or the final weight or number of the reproductive organs. 3.5.3. Sink regulation In the sink regulation approach DM partitioning is primarily regulated by the sinks or by the sinks and the transport path. Several authors ŽThornley, 1976; Minchin et al., 1993; Dewar, 1993. have developed mechanistic models, where the transport of assimilates andror nitrogen from source to sink organs is simulated to be proportional to an osmotically generated pressure gradient or differences in concentration of labile
L.F.M. Marcelis et al.r Scientia Horticulturae 74 (1998) 83–111
100
carbon andror nitrogen divided by a transport resistance. The simulated labile carbon andror nitrogen in the sink organs is used for growth according to Michaelis–Menten kinetics. This mechanistic approach has been used with some success to simulate the distribution between shoot and root of young tomato ŽCooper and Thornley, 1976. and barley plants ŽMinchin et al., 1994.. Its main disadvantages are its complexity and the difficulties to measure the relevant parameters like labile carbon concentrations and transport resistance ŽReynolds and Thornley, 1982; Marcelis, 1993a., although the transport resistance might be estimated numerically from anatomical data ŽSheehy et al., 1995.. Therefore, the possibilities for application of this approach in crop production models will be limited. Some models ignore the resistance of the transport path, e.g., models with a priority concept for sinks. In these models each organ has a different response to substrate Žcarbon reserves or water.. The simulation results of this approach agreed rather well with measurements on DM partitioning in sugar beet ŽFick et al., 1975.. In many crops the source nor the transport path are dominating factors in regulating DM partitioning at the whole plant level and DM partitioning among plant organs is primarily regulated by the sink strengths of the organs ŽMarcelis, 1996.. Accordingly, models have been developed where the fraction of DM partitioned into each organ Ž f i . is determined by its sink strength Ž Si . relative to the total sink strength of all organs together ŽÝS .: f i s SirÝS
Ž 8.
The sink strength can be defined as the potential demand or potential capacity of an organ for assimilate accumulation. This potential demand or capacity can be quantified by the potential growth rate of the organ, i.e. the growth rate under conditions of non-limiting assimilate supply ŽMarcelis, 1996.. The potential growth rate of an organ may change with, for example, its developmental stage or temperature. Potential growth can be measured when plants are grown at high irradiance andror low number of sinks on the plant. However, sometimes problems may arise in measuring the potential growth rate as reported by Lieth and Pasian Ž1991. for rose leaves and Marcelis Ž1994. and Heuvelink Ž1996a. for vegetative growth in cucumber and tomato, while in sweet pepper potential growth rate of the fruits is hardly measurable as in many fruits blossom-end rot occurs when assimilate supply is high ŽMarcelis, unpublished data.. For cucumber fruits, the simulation of the partitioning among individual fruits was improved when the sink strength of each fruit was not only related to its potential demand for assimilates but also to its affinity or priority for assimilates ŽMarcelis, 1994.. In some models Eq. Ž8. is used in combination with a priority sequence for groups of organs: first, Eq. Ž8. is used to distribute DM among a group of organs and only if supply exceeds demand of these organs Že.g. fruits, leaves and stems., assimilates are distributed to other organs Že.g. roots. ŽWermelinger et al., 1991; Grossman and DeJong, 1994.. In these models with sink strengths the number and timing of organs have a strong impact on simulation results. The number and timing of organs depends on the rates of initiation, abortion, harvest andror senescence of the organs. These rates are usually mainly a function of temperature ŽKiniry et al., 1991; Karlsson et al., 1991; De Koning,
L.F.M. Marcelis et al.r Scientia Horticulturae 74 (1998) 83–111
101
1994.. In addition, the sourcersink ratio and photoperiod may have some effects ŽKinet, 1977; Marcelis, 1994.. In many situations the number of organs is limited by abortion rather than initiation ŽBakker, 1991; Marcelis, 1992a.. The fraction or number of non-aborting fruits is often simulated as a function of the sourcersink ratio Že.g. Goldschmidt et al., 1992; Bertin and Gary, 1993; Marcelis, 1994.. However, a better understanding of this process is necessary because simulation results of fruit abortion are usually not very accurate, while they have a strong impact on the simulation of DM partitioning. Incorporation of stochastic elements or hormonal control might improve these models. Developing a truly predictive submodel of fruit set will be a great challenge. Most models assume that there is one common assimilate pool in the plant, which seems to be a reasonable assumption ŽHeuvelink, 1995b.. In some crops Že.g. cucumber; Marcelis, 1994. storage of assimilates seems not to be important, but in perennial fruit trees it may play an important role in interactions between the current and subsequent growth cycle ŽMonselise and Goldschmidt, 1982.. Most of the applications of the modelling approach based on sink strengths or potential demands are found in reproductive crops, like sweet pepper ŽFig. 3., cucumber, tomato, peach, grapevine, kiwifruit, citrus, rose and bean ŽTable 1.. In general, model results seem to agree rather well with measured data. This approach has some mechanistic aspects and can be used to model DM partitioning between any plant part. As discussed by Challa Ž1997., this approach could have a wider application in growth of vegetative organs and plant morphogenesis. Effects of environmental conditions, pruning strategies and plant densities can be simulated through their effects on the sink
Fig. 3. Measured ŽB. and simulated ŽI. weekly harvest of fruits and simulated dry matter ŽDM. production Žline. of greenhouse-grown sweet pepper during a growing season. Simulation of DM production according to the model HORTISIM ŽGijzen et al., 1998. with simulated DM partitioning based on sink strengths ŽMarcelis et al., unpublished data..
102
L.F.M. Marcelis et al.r Scientia Horticulturae 74 (1998) 83–111
strengths of individual organs, number of organs or indirectly through effects of source strength on organ formation. Even at constant growth conditions cyclic fluctuations in DM partitioning, as a result of internal regulation, can be simulated ŽMarcelis, 1994.. Due to its simplicity and lack of knowledge, descriptive allometry models which are entirely empirical, are the most widely used models. For simulation of partitioning between shoot and root in vegetative plants, the functional equilibrium approach often seems to be suitable. The use of the most detailed sink regulation models Žwith transport and utilization of assimilates. is limited in crop growth models due to their complexity and difficulties in parameter estimation. Sink regulation models based on the potential demand Žsink strength. of the organs have some mechanistic aspects and can be applied in many situations. 3.6. Dry matter content Many horticultural products are characterized by a low DM content, e.g., about 3% for cucumber ŽMarcelis, 1992b, 1993b,c., 4% for radish ŽMarcelis et al., 1997., 5% for tomato ŽDe Koning, 1993., 5% for lettuce ŽBlom-Zandstra et al., 1988., 18% for apple ŽSalunkhe and Kadam, 1995. and 15–25% for stone fruits ŽSalunkhe and Kadam, 1995; DeJong, unpublished data, Univ. California Davis.. As many of these products are sold by fresh weight, the yield is determined by fresh weight, rather than dry weight. Moreover, product quality often relates to the DM content. The mechanistic photosynthesis-based models primarily simulate DM production. Attempts to model DM
Fig. 4. Time course of measured Žsymbols. and simulated Žlines. DM content of harvestable cucumber fruits during a growing season in a greenhouse at a daily temperature of 23.2"0.48C. DM content was simulated as . or a positive a function of fruit age, temperature and fresh weight, according to Marcelis Ž1992b. Ž linear relation to the sourcersink ratio of the past 5 days was added to the formula Ž- - - - - -.; this relation was derived from the experiment shown. Experimental conditions and calculation of sourcersink ratio are described by Marcelis Ž1992a, 1994..
L.F.M. Marcelis et al.r Scientia Horticulturae 74 (1998) 83–111
103
content are scarce and a fixed value for DM content is usually assumed to translate dry weight to fresh weight. Marcelis Ž1992b, 1993b,c. showed how temperature, supply and demand of assimilates and fruit age caused DM content of harvestable cucumber fruits Žaveraged over an extended growing period. to vary between 2.7 and 3.8%, while in Fig. 4 a variation between 2.6 and 4.3% during a growing season can be seen. Hence, an error of more than 25% in predicted fresh weight may arise when a constant DM content is assumed. Similarly, De Koning Ž1993, 1994. observed the DM content of tomato fruits to vary between 5.1 and 6.4% and he modelled DM content as a function of day of the year Žseason., the cultivar, the temperature and salinity of the root medium. The relationship between growth in fresh matter and DM, which determines the DM content, is still poorly understood. Ehret and Ho Ž1986. and Ho et al. Ž1987. found evidence that to some extent the accumulation of water might be independent of the accumulation of DM. For a mechanistic simulation of DM content more research on this subject is needed and the currently quite separate literatures on growth as an increase in DM and growth as an increase in volume—water content—should be combined ŽFarrar, 1993.. Models, in which carbon production and partitioning are combined with water uptake and transpiration Že.g. Marcelis, 1989; Gijzen, 1994. may be the first step in the direction of a more mechanistic model for DM content.
4. Conclusions An increasing number of models for simulation of biomass production and yield of horticultural crops becomes available. Only few models are well-validated at the moment. Moreover, many models only simulate part of the crop production system such as photosynthesis, partitioning, development, while they are not yet integrated in complete crop growth models. For a reliable simulation of crop growth and yield, more attention should be paid to validation of the models under a wide range of conditions using independent data sets. Descriptive models may have a good predictive value only if they are used within the range of experimental data from which they were derived. Models based on plant growth analysis ŽRYR, DAR, LAR. have proved to be useful for young plants rather than closed canopies. The simulation of leaf area development is often not very accurate and in some models LAI is still an input parameter. When LAI is known, light interception and gross photosynthesis can be simulated quite well. However, maintenance respiration is a weak feature of crop models, which may be particularly relevant for greenhouse production when large crops Že.g. roses, fruit vegetables. are grown under low light conditions and relatively high temperatures. There has recently been good progress in modelling DM partitioning, in particular with respect to sink regulation models. In contrast to photosynthesis, the modelling of DM partitioning is rather species specific. The relationship between growth in dry weight and fresh weight is an area which should receive more attention in experiments and models. Moreover, the modelling of product quality is still in its infancy. In conclusion, strong features of photosynthesis-based crop growth models are the simulation of light intercep-
104
L.F.M. Marcelis et al.r Scientia Horticulturae 74 (1998) 83–111
tion and gross photosynthesis and weak features are the simulation of leaf area development, maintenance respiration, organ abortion, DM content and product quality.
Acknowledgements We thank H. Gijzen, J.P.F.G. Helsper and A.J.C. de Visser for their comments on an earlier version of this paper. We also thank T.M. DeJong and R.M. Gifford for discussion and providing useful information.
References Acock, B., 1991. Modelling canopy photosynthetic response to carbon dioxide, light interception, temperature, and leaf traits. In: Boote, K.J., Loomis, R.S. ŽEds.., Modelling crop photosynthesis—from biochemistry to canopy. Crop Sci. Soc. Am., Special Publication 19. Madison, WI, pp. 41–55. Acock, B., Charles-Edwards, D.A., Fitter, D.J., Hand, D.W., Ludwig, L.J., Warren Wilson, J., Withers, A.C., 1978. The contribution of leaves from different levels within a tomato crop to canopy net photosynthesis: an experimental examination of two canopy models. J. Exp. Bot. 29, 815–827. ˚ Agren, G.I., Ingestad, T., 1987. Root: shoot ratio as a balance between nitrogen productivity and photosynthesis. Plant Cell Environ. 10, 579–586. Amthor, J.S., 1984. The role of maintenance respiration in plant growth. Plant Cell Environ. 7, 561–569. Amthor, J.S., 1989. Respiration and Crop Productivity. Springer-Verlag, New York, 215 pp. Arkebauer, T.J., Weiss, A., Sinclair, T.R., Blum, A., 1994. In defense of radiation use efficiency: a response to Demetriades-Shah et al. Ž1992.. Agric. For. Meteorol. 68, 221–227. Armitage, A.M., Carlson, W.H., Cress, C.E., 1981. Determination of flowering time and vegetative habit of Tagetes patula through response surface techniques. J. Am. Soc. Hortic. Sci. 106, 632–638. Bakker, J.C., 1991. Analysis of humidity effects on growth and production of glasshouse fruit vegetables. Dissertation. Wageningen Agric. Univ., Wageningen, 155 pp. Barnes, A., 1977. The influence of the length of the growth period and planting density on total crop yield. Ann. Bot. 41, 883–895. Baumgartner, J., Graf, B., Zahner, P., Genini, M., Gutıerrez, A.P., 1986. Generalizing a population model for ¨ ´ simulating ‘Golden delicious’ apple tree growth and development. Acta Hortic. 184, 111–122. Benschop, M., 1985. TUCROS: een simulatiemodel voor de tulpecultivar ‘Apeldoorn’. Simulation Report CABO-TT no. 6, 83 pp. Bertin, N., Gary, C., 1993. Tomato fruit-set: a case study for validation of the model TOMGRO. Acta Hortic. 328, 185–193. Bierhuizen, J.F., Wagenvoort, W.A., 1974. Some aspects of seed germination in vegetables: I. The determination and application of heat sums and minimum temperature for germination. Sci. Hortic. 2, 213–219. Blom-Zandstra, M., Lampe, E.M., Ammerlaan, H.M., 1988. C and N utilization of two lettuce genotypes during growth under non-varying light conditions and after changing the light intensity. Physiol. Plant. 74, 147–153. Boone, F.R., Veen, B.W., 1994. Mechanisms of crop responses to soil compaction. In: Soane, B.D., Van Ouwerkerk, C. ŽEds.., Soil Compaction in Crop Production. Elsevier, Amsterdam, pp. 237–264. Bot, G.P.A., 1983. Greenhouse climate: from physical processes to a dynamic model. Dissertation. Wageningen Agric. Univ., Wageningen, 240 pp. Bouma, T.J., 1995. Utilization of respiratory energy in higher plants: requirements for ‘maintenance’ and transport processes. Dissertation. Wageningen Agric. Univ., Wageningen, 144 pp. Bouma, T.J., Broekhuysen, A.G.M., Veen, B.W., 1996. Analysis of root respiration of Solanum tuberosum as related to growth, ion uptake and maintenance of biomass. Plant Physiol. Biochem. 34, 795–806.
L.F.M. Marcelis et al.r Scientia Horticulturae 74 (1998) 83–111
105
Brøndum, J.J., Heins, R.D., 1993. Modelling temperature and photoperiod effects on growth and development of dahlia. J. Am. Soc. Hortic. Sci. 118, 36–42. Brouwer, R., De Wit, C.T., 1969. A simulation model of plant growth with special attention to root growth and its consequences. In: Whittington, W.J. ŽEd.., Root Growth. Butterworth, London, pp. 224–244. Bunce, J.A., 1989. Growth rate, photosynthesis and respiration in relation to leaf area index. Ann. Bot. 63, 459–463. Bussell, W.T., Falloon, P.G., Stevenson, E., 1988. Comparison of predicted and actual yields of asparagus. Proc. Annu. Conf. Agron. Soc. New Zealand 18, 119–121. Buwalda, J.G., 1991. A mathematical model of carbon acquisition and utilization by kiwifruit vines. Ecol. Model. 57, 43–64. Buysse, J., Van den Broeck, H., Merckx, R., 1996. Growth and growth substrate levels in spinach under non-steady state conditions of nitrogen nutrition. Physiol. Plant. 98, 838–844. Cannell, M.G.R., Dewar, R.C., 1994. Carbon allocation in trees: a review of concepts for modelling. In: Begon, M., Fitter, A.H. ŽEds.., Advances in Ecological Research. Academic Press, London, pp. 59–103. Chalabi, Z.S., Milford, G.F.J., Day, W., 1986. Stochastic model of the leaf area expansion of the sugar beet plant in a field crop. Agric. For. Meteorol. 38, 319–336. Challa, H., 1997. Growth of vegetative plant organs: the result of interacting ontogenetic patterns. Acta Hortic. 435, 160–168. Charles-Edwards, D.A., 1978. An analysis of photosynthetis and productivity of vegetative crops in the United Kingdom. Ann. Bot. 42, 717–731. Chen, J.-L., Reynolds, J.F., 1997. A coordination model of whole-plant carbon allocation in relation to water stress. Ann. Bot. 80, 45–55. Cockshull, K.E., 1988. The integration of plant physiology with physical changes in the greenhouse climate. Acta Hortic. 229, 113–123. Cooper, A.J., Thornley, J.H.M., 1976. Response of dry matter partitioning, growth and carbon and nitrogen levels in the tomato plant to changes in root temperature: experiment and theory. Ann. Bot. 40, 1139–1152. Critten, D.L., 1993. A review of the light transmission into greenhouse crops. Acta Hortic. 328, 9–31. Dayan, E., Van Keulen, H., Jones, J.W., Zipori, I., Shmuel, D., Challa, H., 1993a. Development, calibration and validation of a greenhouse tomato growth model: I. Description of the model. Agric. Syst. 43, 145–163. Dayan, E., Van Keulen, H., Jones, J.W., Zipori, I., Shmuel, D., Challa, H., 1993b. Development, calibration and validation of a greenhouse tomato growth model: II. Field calibration and validation. Agric. Syst. 43, 165–183. De Koning, A.N.M., 1989. The effect of temperature on fruit growth and fruit load of tomato. Acta Hortic. 248, 329–336. De Koning, A.N.M., 1993. Growth of a tomato crop: measurements for model validation. Acta Hortic. 328, 141–146. De Koning, A.N.M., 1994. Development and dry matter distribution in tomato: a quantitative approach. Dissertation. Wageningen Agric. Univ., Wageningen, 240 pp. De Koning, A.N.M., 1996. Quantifying the responses to temperature of different plant processes involved in growth and development of glasshouse tomato. Acta Hortic. 406, 99–104. Del Real-Laborde, J.I., Anderson, J.L., Seeley, S.D., 1990. An apple tree dormancy model for subtropical conditions. Acta Hortic. 276, 183–191. Demetriades-Shah, T.H., Fuchs, M., Kanemasu, E.T., Flitcroft, I.D., 1994. Further discussions on the relationship between cumulated intercepted solar radiation and crop growth. Agric. For. Meteorol. 68, 231–242. De Visser, C.L.M., 1994. ALCEPAS, an onion growth model based on SUCROS87: I. Development of the model. J. Hortic. Sci. 69, 501–518. De Visser, C.L.M., Schoneveld, J.A., Zwart-Roodzant, M.H., 1995. Ontwikkeling van een gewasgroeimodel voor peen op basis van SUCROS87. PAGV-verslag no. 199, 124 pp. Dewar, R.C., 1993. A root–shoot partitioning model based on carbon–nitrogen–water interactions and Munch ¨ phloem flow. Funct. Ecol. 7, 356–368.
106
L.F.M. Marcelis et al.r Scientia Horticulturae 74 (1998) 83–111
De Willigen, P., Van Noordwijk, M., 1987. Roots, plant production and nutrient use. Dissertation. Wageningen Agric. Univ., Wageningen, 282 pp. De Wit, C.T., 1965. Photosynthesis of leaf canopies. Agric. Res. Rep. 663. Pudoc, Wageningen, 57 pp. De Wit, C.T. et al., 1978. Simulation of assimilation, respiration and transpiration of crops. Simulation Monographs. Pudoc, Wageningen, 141 pp. Ehler, N., Brogaard, M., Fisher, P., Heins, R., Lieth, H., 1996. Integration of the greenhouse care system with an environmental computer to control flowering and elongation of Lilium longiflorum. Acta Hortic. 417, 69–73. Ehret, D.L., Ho, L.C., 1986. The effects of salinity on dry matter partitioning and fruit growth in tomatoes grown in nutrient film culture. J. Hortic. Sci. 61, 361–367. Enoch, H.Z., 1990. Crop responses to aerial carbon dioxide. Acta Hortic. 268, 17–32. Erez, A., Fishman, S., Linsley-Noakes, G.C., Allan, P., 1990. The dynamic model for rest completion in peach buds. Acta Hortic. 276, 165–174. Erwin, J.E., Heins, R.D., 1990. Temperature effects on lily development rate and morphology from the visible bud stage until anthesis. J. Am. Soc. Hortic. Sci. 115, 644–646. Esau, K., 1953. Plant Anatomy. Wiley, New York, 418 pp. Farquhar, G.D., Von Caemmerer, S., Berry, J.A., 1980. A biochemical model of photosynthetic CO 2 assimilation in leaves of C 3 species. Planta 149, 78–90. Farrar, J.F., 1992. The whole plant: carbon partitioning during development. In: Pollock, C.J., Farrar, J.F., Gordon, A.J. ŽEds.., Carbon Partitioning Within and Between Organisms. BIOS Scientific Publishers, Oxford, pp. 163–179. Farrar, J.F., 1993. Sink strength: what is it and how do we measure it? Summary. Plant Cell Environ. 16, 1045–1046. Fick, G.W., Loomis, R.S., Williams, W.A., 1975. Sugar beet. In: Evans, L.T. ŽEd.., Crop Physiology. Cambridge Univ. Press, Cambridge, pp. 259–295. Fisher, P.R., Heins, R.D., 1996. The greenhouse care system: a decision support system for height control and scheduling of potted flowering plants. Acta Hortic. 417, 41–45. Fisher, P.R., Lieth, J.H., Heins, R.D., 1996. Modelling flower bud elongation in Easter lily Ž Lilium longiflorum Thunb.. in response to temperature. HortScience 31, 349–352. Flore, J.A., Lakso, A.N., 1989. Environmental and physiological regulation of photosynthesis in fruit crops. Hortic. Rev. 11, 111–157. Gary, C., Jones, J.W., Longuenesse, J.J., 1993. Modelling daily changes in specific leaf area of tomato: the contribution of the leaf assimilate pool. Acta Hortic. 328, 205–210. Gary, C., Barczi, J.F., Bertin, N., Tchamitchian, M., 1995. Simulation of individual organ growth and development on a tomato plant: a model and a user-friendly interface. Acta Hortic. 399, 199–205. Gary, C., Jones, J.W., Tchamitchian, M., 1998. Crop models in horticulture: state of the art. Sci. Hortic., this volume. Gifford, R.M., 1995. Whole plant respiration and photosynthesis of wheat under increased CO 2 concentration and temperature: long-term vs. short-term distinctions for modelling. Glob. Change Biol. 1, 385–396. Gifford, R.M., Thorne, J.H., Hitz, W.D., Giaquinta, R.T., 1984. Crop productivity and photo-assimilate partitioning. Science 225, 801–807. Gijzen, H., 1992. Simulation of photosynthesis and dry matter production of greenhouse crops. Simulation Report CABO-TT 28. CABO-DLO, Wageningen, 69 pp. Gijzen, H., 1994. Development of a simulation model for transpiration and water uptake and of a comprehensive crop growth model. Report 18. AB-DLO, Wageningen, 90 pp. Žin Dutch.. Gijzen, H., 1995a. Short term crop responses. In: Bakker, J.C., Bot, G.P.A., Challa, H., van de Braak, N.J. ŽEds.., Greenhouse Climate Control, An Integrated Approach. Wageningen Pers, Wageningen, pp. 16–35. Gijzen, H., 1995b. Interaction between CO 2 uptake and water loss. In: Bakker, J.C., Bot, G.P.A., Challa, H., van de Braak, N.J. ŽEds.., Greenhouse Climate Control, An Integrated Approach. Wageningen Pers, Wageningen, pp. 51–62. Gijzen, H., Goudriaan, J., 1989. A flexible and explanatory model of light distribution and photosynthesis in row crops. Agric. For. Meteorol. 48, 1–20. Gijzen, H., Heuvelink, E., Marcelis, L.F.M., Dayan, E., Cohen, S., Fuchs, M., Challa, H., 1998. HORTISIM: A model for greenhouse crops and greenhouse climate. Acta Hortic. 456, in press.
L.F.M. Marcelis et al.r Scientia Horticulturae 74 (1998) 83–111
107
Goldschmidt, E.E., Harpaz, A., Gal, S., Rabber, D., Gelb, E., 1992. Simulation of fruitlet thinning effects in Citrus by a dynamic growth model. Proc. Int. Citricult. 1, 515–519. Goudriaan, J., 1988. The bare bones of leaf angle distribution in radiation models for canopy photosynthesis and energy exchange. Agric. For. Meteorol. 43, 155–169. Goudriaan, J., Monteith, J.L., 1990. A mathematical function for crop growth based on light interception and leaf area expansion. Ann. Bot. 66, 695–701. Goudriaan, J., Van Laar, H.H., 1994. Modelling Potential Crop Growth Processes. Kluwer Acad. Publishers, Dordrecht, 238 pp. Goudriaan, J., Van Laar, H.H, Van Keulen, H., Louwerse, W., 1985. Photosynthesis, CO 2 and plant production. In: Day, W., Atkin, R.K. ŽEds.., Wheat Growth and Modelling. NATO ASI Series, Series A: Life Sciences, 86, pp. 107–122. Grashoff, C., Stokkers, R., 1992. Effect of pattern of water supply on Vicia faba L.: IV. Simulation studies on yield variability. Neth. J. Agric. Sci. 40, 447–468. Grevsen, K., 1990. Prediction of harvest in cauliflower based on meteorological observations. Acta Hortic. 267, 313–322. Grossman, Y.L., DeJong, T.M., 1994. PEACH: a simulation model of reproductive and vegetative growth in peach trees. Tree Physiol. 14, 329–345. Gutıerrez, A.P., Williams, D.W., Kido, H., 1985. A model of grape growth and development: the mathematical ´ structure and biological considerations. Crop Sci. 25, 721–728. Gutıerrez, A.P., Mariot, E.J., Cure, J.R., Wagner Riddle, C.S., Ellis, C.K., Villacorta, A.M., 1994. A model of ´ bean Ž Phaseolus Õulgaris L.. growth types I–III: factors affecting yield. Agric. Syst. 44, 35–63. Hackett, C., 1973. An exploration of the carbon economy of the tobacco plant: I. Inferences from a simulation. Aust. J. Biol. Sci. 26, 1057–1071. Harper, J.L., 1989. Canopies as populations. In: Russel, G., Marshall, B., Jarvis, P.G. ŽEds.., Plant Canopies: Their Growth, Form and Function. Seminar Series Soc. Exp. Biol. 31. Cambridge Univ. Press, Cambridge, pp. 105–128. Heuvelink, E., 1995a. Dry matter production in a tomato crop: measurements and simulation. Ann. Bot. 75, 369–379. Heuvelink, E., 1995b. Dry matter partitioning in a tomato plant: one common assimilate pool?. J. Exp. Bot. 46, 1025–1033. Heuvelink, E., 1996a. Dry matter partitioning in tomato: validation of a dynamic simulation model. Ann. Bot. 77, 71–80. Heuvelink, E., 1996b. Tomato growth and yield: quantitative analysis and synthesis. Dissertation. Wageningen Agric. Univ., Wageningen, 326 pp. Heuvelink, E., Buiskool, R.P.M., 1995. Influence of sink–source interaction on dry matter production in tomato. Ann. Bot. 75, 381–389. Heuvelink, E., Marcelis, L.F.M., 1996. Influence of assimilate supply on leaf formation in sweet pepper and tomato. J. Hortic. Sci. 71, 405–414. Heuvelink, E., Batta, L.G.G., Damen, T.H.J., 1995. Transmission of solar radiation by a multispan Venlo-type glasshouse: validation of a model. Agric. For. Meteorol. 74, 41–59. Hilbert, D.W., 1990. Optimization of plant root:shoot ratios and internal nitrogen concentration. Ann. Bot. 66, 91–99. Ho, L.C., Grange, R.I., Picken, A.J., 1987. An analysis of the accumulation of water and dry matter in tomato fruit. Plant Cell Environ. 10, 157–162. Hoogenboom, G., Jones, J.W., Boote, K.J., 1992. Modelling growth, development and yield of grain legumes using SOYGRO, PNUTGRO and BEANGRO: a review. Trans. Am. Soc. Agric. Eng. 35, 2043–2056. Hopper, D.A., Hammer, P.A., Wilson, J.R., 1994. A simulation model of Rosa hybrida growth response to constant irradiance and day and night temperatures. J. Am. Soc. Hortic. Sci. 119, 903–914. Hunt, R., 1982. Plant Growth Curves: the Functional Approach to Plant Growth Analysis. Edward Arnold, London, 248 pp. Johnson, I.R., 1990. Plant respiration in relation to growth, maintenance, ion uptake and nitrogen assimilation. Plant Cell Environ. 13, 319–328. Johnson, I.R., Thornley, J.H.M., 1983. Vegetative crop growth model incorporating leaf area expansion and senescence, applied to grass. Plant Cell Environ. 6, 721–729.
108
L.F.M. Marcelis et al.r Scientia Horticulturae 74 (1998) 83–111
Jones, H.G., Tardieu, F., 1998. Modelling water relations of horticultural crops: a review. Sci. Hortic. 74, 21–45. Kano, A.K., Van Bavel, C.H.M., 1988. Design and test of a simulation model of tomato growth and yield in a greenhouse. J. Jpn. Soc. Hortic. Sci. 56, 408–416. Karlsson, M.G., Heins, R.D., Erwin, J.E., 1988. Quantifying temperature-controlled leaf unfolding rates in ‘Nellie White’ Easter lily. J. Am. Soc. Hortic. Sci. 113, 70–74. Karlsson, M.G., Heins, R.D., Gerberick, J.O., Hackmann, M.E., 1991. Temperature driven leaf unfolding rate in Hibiscus rosasinensis. Sci. Hortic. 45, 323–331. Kastner-Maresch, A.E., Mooney, H.A., 1994. Modelling optimal plant biomass partitioning. Ecol. Model. 75r76, 309–320. Kinet, J.M., 1977. Effect of light conditions on the development of the inflorescense in tomato. Sci. Hortic. 6, 15–26. Kiniry, J.R., Rosenthal, W.D., Jackson, B.S., Hoogenboom, G., 1991. Predicting leaf development of crop plants. In: Hodges, T. ŽEd.., Predicting Crop Phenology. CRC Press, Boca Raton, FL, USA, pp. 30–42. Kish, A.J., Ogle, W.L., 1980. Improving the heat unit system in predicting maturity date of snap beans. HortScience 15, 140–141. Kool, M.T.N., 1996. Long-term flower production of a rose crop: II. The importance of new basal-shoot formation. J. Hortic. Sci. 71, 445–452. Kool, M.T.N., De Koning, J.C.M., 1996. Analysis of rose crop production. Acta Hortic. 424, 79–86. Krug, H., Liebig, H.P., 1979. Analyse, Kontrolle und Programmierung der Pflanzenproduktion in Gewachshausern mit Hilfe beschreibender Modelle: II. Produktion von Radies Ž Raphanus satiÕus Õar. ¨ ¨ satiÕus .. Gartenbauwiss. 44, 202–213. Krug, H., Liebig, H.P., 1988. Static regression models for planning greenhouse production. Acta Hortic. 230, 427–430. Krug, H., Liebig, H.P., 1994. Model for planning and control of transplant production in climate controlled greenhouses: I. Production planning. Gartenbauwiss. 59, 108–115. Krug, H., Liebig, H.P., 1995. Models for planning and control of transplant production in climate controlled greenhouses: II. Production control. Gartenbauwiss. 60, 22–28. Krug, H., Liebig, H.P., Bazlen, E., 1989. Production planning–germination period. Acta Hortic. 248, 167–174. Lakso, A.N., Johnson, R.S., 1990. A simplified dry matter production model for apple using automatic programming simulation software. Acta Hortic. 276, 141–147. Larsen, R.U., 1988. A prediction model of the developmental rate of the pot plant Senecio= hybridus Hyl: a case study. Acta Hortic. 230, 381–388. Larsen, R.U., 1990. Plant growth modelling by light and temperature. Acta Hortic. 272, 235–242. Larsen, R.U., Hiden, ´ C., 1995. Predicting leaf unfolding in flower induced shoots of greenhouse grown chrysanthemum. Sci. Hortic. 63, 225–239. Le Bot, J., Adamowicz, S., Robin, P., 1998. Modelling plant nutrition of horticultural crops: a review. Sci. Hortic. 74, 47–81. Lentz, W., 1998. Model applications in horticulture: a review. Sci. Hortic. 74, 151–174. Leuning, R., 1995. A critical appraisal of a combined stomatal-photosynthesis model for C 3 plants. Plant Cell Environ. 18, 339–355. Leutscher, K.J., Vogelezang, J.V.M., 1990. A crop growth simulation model for operational management support in pot plant production. Agric. Syst. 33, 101–114. Liebig, H.P., 1980. A growth model to predict yield and economical figures of the cucumber crop. Acta Hortic. 118, 165–174. Liebig, H.P., Krug, H., 1990. Response of cucumber to climate. Acta Hortic. 287, 47–50. Lieth, J.H., Pasian, C.C., 1991. A simulation model for the growth and development of flowering rose shoots. Sci. Hortic. 46, 109–128. Lieth, J.H., Merritt, R.H., Kohl, H.C., 1991. Crop productivity of petunia in relation to photosynthetically active radiation and air temperature. J. Am. Soc. Hortic. Sci. 116, 623–626. Lieth, J.H., Fisher, P.R., Heins, R.D., 1996. A phasic model for the analysis of sigmoid patterns of growth. Acta Hortic. 417, 113–117.
L.F.M. Marcelis et al.r Scientia Horticulturae 74 (1998) 83–111
109
Longuenesse, J.J., Gary, C., Tchamitchian, M., 1993. Modelling CO 2 exchanges of greenhouse crops: a matter of scales and boundaries. Acta Hortic. 328, 33–47. Ludlow, M.M., 1987. Defining root water status in the most meaningful way to relate to physiological processes. In: Hanks, R.J., Brown, R.W. ŽEds.., Measurement of Soil and Plant Water Status, 2. Utah Agric. Exp. Stat., Logan, UT, pp. 47–53. Makela, ¨ ¨ A.A., 1986. Partitioning coefficients in plant models with turn-over. Ann. Bot. 57, 291–297. Marcelis, L.F.M., 1989. Simulation of plant–water relations and photosynthesis of greenhouse crops. Sci. Hortic. 41, 9–18. Marcelis, L.F.M., 1991. Effects of sink demand on photosynthesis in cucumber. J. Exp. Bot. 42, 1387–1392. Marcelis, L.F.M., 1992a. The dynamics of growth and dry matter distribution in cucumber. Ann. Bot. 69, 487–492. Marcelis, L.F.M., 1992b. Non-destructive measurements and growth analysis of the cucumber fruit. J. Hortic. Sci. 67, 457–464. Marcelis, L.F.M., 1993a. Simulation of biomass allocation in greenhouse crops—a review. Acta Hortic. 328, 49–67. Marcelis, L.F.M., 1993b. Fruit growth and biomass allocation to the fruits in cucumber: I. Effect of fruit load and temperature. Sci. Hortic. 54, 107–121. Marcelis, L.F.M., 1993c. Fruit growth and biomass allocation to the fruits in cucumber: II. Effect of irradiance. Sci. Hortic. 54, 123–130. Marcelis, L.F.M., 1993d. Leaf formation in cucumber as influenced by fruit load, light and temperature. Gartenbauwiss. 58, 124–129. Marcelis, L.F.M., 1994. A simulation model for dry matter partitioning in cucumber. Ann. Bot. 74, 43–52. Marcelis, L.F.M., 1996. Sink strength as a determinant of dry matter partitioning in the whole plant. J. Exp. Bot. 47, 1281–1291. Marcelis, L.F.M., Gijzen, H., 1998. A model for prediction of yield and size distribution of cucumber fruits. Scientia Hortic., submitted. Marcelis, L.F.M., Heuvelink, E., Van Dijk, D., 1997. Pithiness and growth of radish tubers as affected by irradiance and plant density. Ann. Bot. 79, 397–402. McCree, K.J., 1982. Maintenance requirements of white clover at high and low growth rates. Crop Sci. 22, 345–356. McCree, K.J., 1988. Sensitivity of sorghum grain yield to ontogenetic changes in respiration coefficients. Crop Sci. 28, 114–120. Minchin, P.E.H., Thorpe, M.R., Farrar, J.F., 1993. A simple mechanistic model of phloem transport which explains sink priority. J. Exp. Bot. 44, 947–955. Minchin, P.E.H., Thorpe, M.R., Farrar, J.F., 1994. Short term control of root: shoot partitioning. J. Exp. Bot. 45, 615–622. Monselise, S.P., Goldschmidt, E.E., 1982. Alternate bearing in fruit trees. Hortic. Rev. 4, 128–173. ¨ Monsi, M., Saeki, T., 1953. Uber den Lichtfaktor in den Pflanzengesellschaften und seine Bedeutung fur ¨ die Stoffproduktion. Soc. Jpn. J. Bot. 14, 22–52. Monteith, J.L., 1994. Validity of the correlation between intercepted radiation and biomass. Agric. For. Meteorol. 68, 213–220. Monteith, J.L., 1995. A reinterpretation of stomatal responses to humidity. Plant Cell Environ. 18, 357–364. Morisot, A., 1996. A first step to validating ‘PP. Rose’, an empirical model of the potential production of cut roses. Acta Hortic. 417, 127–138. Moss, R.A., Loomis, W.E., 1952. Absorption spectra of leaves: I. The visible spectrum. Plant Physiol. 27, 370–391. Mutsaers, H.J.W., 1983. Leaf growth in cotton Ž Gossypium hirsutum L..: I. Growth in area of main-stem and sympodial leaves. Ann. Bot. 51, 503–520. Nilwik, H.J.M., 1981. Growth analysis of sweet pepper Ž Capsicum annuum L..: II. Interacting effects of irradiance, temperature and plant age in controlled conditions. Ann. Bot. 48, 137–145. Ottoson, L., 1973. Some aspects on heat unit calculations for sowing-programs of vining peas. Acta Hortic. 27, 279–280. Palmer, J.W., 1986. Light interception and dry matter production by apple orchards. In: Lakso, A.N., Lenz, F.
110
L.F.M. Marcelis et al.r Scientia Horticulturae 74 (1998) 83–111
ŽEds.., The Regulation of Photosynthesis in Fruit Trees. Symp. NY State Agric. Exp. Sta., Geneva, NY, USA, pp. 24–27. Palmer, J.W., 1989. The effect of row orientation, tree height, time of year and latitude on light interception and distribution in model apple hedgerow canopies. J. Hortic. Sci. 64, 137–145. Pearson, S., Hadley, P., Wheldon, A.E., 1994. A model of the effects of temperature on the growth and development of cauliflower Ž Brassica oleracea L. botrytis.. Sci. Hortic. 59, 91–106. Penning de Vries, F.W.T., Van Laar, H.H. ŽEds.., 1982. Simulation of growth processes and the model BACROS. Simulation of Plant Growth and Crop Production. Pudoc, Wageningen, pp. 114–135. Penning de Vries, F.W.T., Brunsting, A.H.M., Van Laar, H.H., 1974. Products, requirements and efficiency of biosynthesis: a quantitative approach. J. Theor. Biol. 45, 339–377. Penning de Vries, F.W.T., Jansen, D.M., Ten Berge, H.F.M., Bakema, A., 1989. Simulation of ecophysiological processes of growth in several annual crops. Simulation Monographs, 29. Pudoc, Wageningen, 271 pp. Pons, T.L., Schieving, F., Hirose, T., Werger, M.J.A., 1990. Optimization of leaf nitrogen allocation for canopy photosynthesis in Lysimachia Õulgaris. In: Lambers, H., Cambridge, M.L., Konings, H., Pons, T.L. ŽEds.., Causes and Consequences of Variation in Growth Rate and Productivity of Higher Plants. Acad. Publ., The Hague, pp. 175–186. Poorter, H., Garnier, E., 1996. Plant growth analysis: an evaluation of experimental design and computational methods. J. Exp. Bot. 47, 1343–1351. Poorter, H., Remkes, C., Lambers, H., 1990. Carbon and nitrogen economy of 24 wild species differing in relative growth rate. Plant Physiol. 94, 621–627. Prusinkiewicz, P., 1998. Modelling of spatial structure and development of plants in horticulture: a review. Sci. Hortic. 74, 113–149. Pytlinski, J., Krug, H., 1989. Modelling Pelargonium zonale response to various day and night temperatures. Acta Hortic. 248, 75–84. Reynolds, J.F., Chen, J.-L., 1996. Modelling whole-plant allocation in relation to carbon and nitrogen supply: coordination vs. optimization: opinion. Plant Soil 185, 65–74. Reynolds, J.F., Thornley, J.H.M., 1982. A shoot: root partitioning model. Ann. Bot. 49, 585–597. Ross, J., 1981. The Radiation Regime and Architecture of Plant Stands. Dr Junk Publishers, The Hague, 391 pp. Salunkhe, D.K., Kadam, S.S. ŽEds.., 1995. Handbook of Fruit Science and Technology: Production, Composition, Storage and Processing. Marcel-Dekker, New York, 611 pp. Scaife, A., Cox, E.F., Morris, G.E.L., 1987. The relationship between shoot weight, plant density and time during the propagation of four vegetable species. Ann. Bot. 59, 325–334. Sheehy, J.E., Mitchell, P.L., Durand, J.-L., Gastal, F., Woodward, F.I., 1995. Calculation of translocation coefficients from phloem anatomy for use in crop models. Ann. Bot. 76, 263–269. Shinano, T., Osaki, M., Tadano, T., 1996. Problems in methods of estimation of growth and maintenance respiration. Soil Sci. Plant Nutr. 42, 773–784. Spitters, C.J.T., 1986. Separating the diffuse and direct component of global radiation and its implications for modelling canopy photosynthesis: II. Calculation of canopy photosynthesis. Agric. For. Meteorol. 38, 231–242. Spitters, C.J.T., 1987. An analysis of variation in yield among potato cultivars in terms of light absorption, light utilization and dry matter partitioning. Acta Hortic. 214, 71–84. Spitters, C.J.T., Van Keulen, H., Van Kraalingen, D.W.G., 1989. A simple and universal crop growth simulator: SUCROS87. In: Rabbinge, R., Ward, S.A., Van Laar, H.H. ŽEds.., Simulation and Systems Management in Crop Protection. Simulation Monographs, 32. Pudoc, Wageningen, pp. 147–181. Stitt, M., 1991. Rising CO 2 levels and their potential significance for carbon flow in photosynthetic cells. Plant Cell Environ. 14, 741–762. Termaat, A., Passioura, J.B., Munns, R., 1985. Shoot turgor does not limit shoot growth of NaCl-affected wheat and barley. Plant Physiol. 77, 869–872. Thornley, J.H.M., 1976. Mathematical Models in Plant Physiology. Academic Press, London, 318 pp. Thornley, J.H.M., 1995. Shoot: root allocation with respect to C, N and P: an investigation and comparison of resistance and teleonomic models. Ann. Bot. 75, 391–405. Thornley, J.H.M., Hurd, R.G., 1974. An analysis of the growth of young tomato plants in water culture at different light integrals and CO 2 concentrations: II. A mathematical model. Ann. Bot. 38, 389–400.
L.F.M. Marcelis et al.r Scientia Horticulturae 74 (1998) 83–111
111
Thornley, J.H.M., Johnson, I.R., 1990. Plant and Crop Modelling: A Mathematical Approach to Plant and Crop Physiology. Clarendon Press, Oxford, 669 pp. Uragami, A., Nagai, M., Yoshikawa, H., 1995. Possibility of early evaluation of yield and spear traits in asparagus cultivars. J. Jpn. Soc. Hortic. Sci. 63, 767–772. Van der Werf, A., Enserink, T., Smit, B., Booij, R., 1993. Allocation of carbon and nitrogen as a function of the internal nitrogen status of a plant: modelling allocation under non-steady-state situations. Plant Soil 155r156, 183–186. Van Henten, E.J., 1994. Validation of a dynamic lettuce growth model for greenhouse climate control. Agric. Syst. 45, 55–72. Van Keulen, H., Seligman, N.G., 1987. Simulation of water use, nitrogen nutrition and growth of a spring wheat crop. Simulation Monographs. Pudoc, Wageningen, 310 pp. Van Keulen, H., Penning de Vries, F.W.T., Drees, E.M., 1982. A summary model for crop growth. In: Penning de Vries, F.W.T., Van Laar, H.H. ŽEds.., Simulation of Plant Growth and Crop Production. Simulation Monographs. Pudoc, Wageningen, pp. 87–97. Van Straten, G., 1996. On-line optimal control of greenhouse crop cultivation. Acta Hortic. 406, 203–211. Vertregt, N., Penning de Vries, F.W.T., 1987. A rapid method for determining the efficiency of biosynthesis of plant biomass. J. Theor. Biol. 128, 109–119. Wagenmakers, P.S., 1995. Light relations in orchard systems. Dissertation. Wageningen Agric. Univ., Wageningen, 151 pp. Wardlaw, I.F., 1990. The control of carbon partitioning in plants. New Phytol. 116, 341–381. Wermelinger, B., Baumgartner, J., Gutıerrez, A.P., 1991. A demographic model of assimilation and allocation ¨ ´ of carbon and nitrogen in grapevines. Ecol. Model. 53, 1–26. ¨ Wiebe, H.J., 1975. Zur Ubertragung von Ergebnissen aus Klimakammern auf Freilandbedingungen mit Hilfe eines Simulationsmodells bei Blumenkohl. Gartenbauwiss. 40, 70–74. Wilkerson, G.G., Jones, J.W., Boote, K.J., Ingram, K.T., Mishoe, J.W., 1983. Modelling soybean growth for crop management. Trans. Am. Soc. Agric. Eng. 26, 63–73. Williams, J.R., Jones, C.A., Kiniry, J.R., Spanel, D.A., 1989. The EPIC crop growth model. Trans. Am. Soc. Agric. Eng. 32, 497–511. Wilson, J.B., 1988. A review of evidence on the control of shoot:root ratio, in relation to models. Ann. Bot. 61, 433–449. Wullschleger, S.D., Ziska, L.H., Bunce, J.A., 1994. Respiratory responses of higher plants to atmospheric CO 2 enrichment. Physiol. Plant. 90, 221–229. Wurr, D.C.E., Fellows, J.R., Suckling, R.F., 1988. Crop continuity and prediction of maturity in the crisp lettuce variety Saladin. J. Agric. Sci. 111, 481–486. Wurr, D.C.E., Fellows, J.R., Sutherland, R.A., Elphinstone, E.D., 1990. A model of cauliflower curd growth to predict when curds reach a specified size. J. Hortic. Sci. 65, 555–564. Wurr, D.C.E., Fellows, J.R., Hambridge, A.J., 1992. The effect of plant density on calabrese head growth and its use in a predictive model. J. Hortic. Sci. 67, 77–85. Zur, B., Jones, J.W., 1981. A model for the water relations, photosynthesis, and expansive growth of crops. Water Resour. Res. 17, 311–320.