IOP Conference Series: Earth and Environmental Science
PAPER • OPEN ACCESS
Modelling landscape change in paddy fields using logistic regression and GIS To cite this article: E E Franjaya et al 2018 IOP Conf. Ser.: Earth Environ. Sci. 149 012002
View the article online for updates and enhancements.
This content was downloaded from IP address 173.211.86.33 on 17/05/2018 at 02:18
LISAT 2017 IOP Conf. Series: Earth and Environmental Science 149 (2018) 1234567890 ‘’“” 012002
IOP Publishing doi:10.1088/1755-1315/149/1/012002
Modelling landscape change in paddy fields using logistic regression and GIS E E Franjaya1, Syartinilia1 and Y Setiawan2 1
Department of Landscape Architecture, Faculty of Agriculture, Bogor Agricultural University, Kampus IPB Darmaga, Bogor 16680, Indonesia 2 Center for Environmental Research, Bogor Agricultural University, Kampus IPB Darmaga, Bogor 16680, Indonesia E-mail:
[email protected] Abstract. Paddy field in karawang district, as an important agricultural land in west java, has been decreased since 1994. From previous study, paddy fields dominantly turned into built area. The changes were almost occured in the middle area of the district where roadways, industries, settlements, and commercial buildings were existed. These were estimated as driving forces. But, we still need to prove it. This study aimed to construct the paddy field probability change model, subsequently the driving forces will be obtained. GIS combined with logistic regression using environmental variables were used as main method in this study. Ten environmental variables were elevation 0–500 m, elevation>500 m, slope8%, CBD, build up area, river, irrigation, toll and national roadway, and collector and local roadway. The result indicated that four variables were significantly played as driving forces (slope>8%, CBD area, build up area, and collector and local roadway). Paddy field has high, medium, and low probability to change which covered about 27.8%, 7.8%, and 64.4% area in Karawang respectively. Based on landscape ecology, the recommendation that suitable with landscape change is adaptive management.
1. Introduction Rice paddy is one of the important agricultural commodity in Indonesia [1]. Even in the world, Indonesia is known as one of the top three rice paddy producers. This is because paddy is staple food for Indonesian people [2]. But nowadays, the paddy fields faced the alteration. From previous study, we know that paddy fields has been changed a lot in the middle area of Karawang District. The paddy mostly turned into built area. There are much thing that make this happened. From other researches, we got that the development of physical and economic growth has become the main factor for the changed [3,4]. The location of Jakarta that so close to Karawang has an influence, as we know that Jakarta is a metropolitan city. The increasing of socio-economic activities in Jakarta have led to massive land use changes [5] and urbanization [6,7]. But, for the spesific and detailed reason about driving forces that causing the alteration happened in Karawang District, we need to do a deeper analysis. We need land cover change map from previous result, some environmental variables related to the changes, and presence and absence point. This research aimed to constructing the paddy field probability
Content from this work may be used under the terms of the Creative Commons Attribution 3.0 licence. Any further distribution of this work must maintain attribution to the author(s) and the title of the work, journal citation and DOI. Published under licence by IOP Publishing Ltd 1
LISAT 2017 IOP Conf. Series: Earth and Environmental Science 149 (2018) 1234567890 ‘’“” 012002
IOP Publishing doi:10.1088/1755-1315/149/1/012002
change model (1994-2015) in Karawang District-West Java. Using this probability change model, we can give recommendations so that more changing would not be happen in the future.
2. Materials and methods 2.1. Study area This study was conducted in Karawang District-West Java, which located on latitude S5º56′ - S6º34′ and longitude E107º02′ - E107º40′.
Figure 1. Study area. 2.2. Data collection The main data used in this research is land cover change map from previous research. Besides the land cover change map, this research also need Indonesia Digital Map (RBI) and Aster GDEM map for landscape change modelling analysis. The tools that used in this research were varied. The main tools are ArcGIS software, Erdas Imagine 9.1, and SPSS program to get the value and as an input for constructing the probability change model.
2
LISAT 2017 IOP Conf. Series: Earth and Environmental Science 149 (2018) 1234567890 ‘’“” 012002
IOP Publishing doi:10.1088/1755-1315/149/1/012002
Table 1. Research’s material, source, and its function. Material Digital Map (RBI)
Unit Vector
Source Geospatial Information Agency
Tool’s function Landscape change modelling analysis and environmental variables
Land cover change map (1994-2015)
Raster 30x30 m pixel resolution
National Aeronautics and Space Administration
Landscape change modelling analysis and environmental variables
Aster GDEM
Raster 30x30 m pixel resolution
National Aeronautics and Space Administration
Elevation and Slope fr environmental variables
2.3. Landscape change modelling analysis On this stage, the result of land cover analysis from previous study will be processed further to detect the driving forces using Logistic Regression (figure 2). Presence and absence points data is needed to get value from each environmental variables. The environmental variables used in this research are stated on the figure of list of environmental variables below (table 2). The data will be executed in Model Maker ArcGIS and SPSS using Logistic Regression method [8]. The result of analysis is land cover change variables that significant enough as driving forces [9]. This driving force variables will be executed to construct the probability change model. The validation is needed to evaluate the model in the end.
Figure 2. Study flowchart.
3
LISAT 2017 IOP Conf. Series: Earth and Environmental Science 149 (2018) 1234567890 ‘’“” 012002
IOP Publishing doi:10.1088/1755-1315/149/1/012002
Table 2. List of environmental variables. No
Environmental variables
Abbreviation
Preferences
Sources
Elevation 1.
Euclidean distance to Elevation 0-500 m above sea level
JTE1
2.
Euclidean distance to Elevation >500 m above sea level
JTE2
Suitability level in planting paddies and geographical condition of Karawang County
Extracted from ASTER GDEM Data that become euclidean distance map
Slope 3.
Euclidean distance to Slope 8%
JTS2
Suitability level of slope on planting paddies and geographical condition of Karawang County
Extracted from ASTER GDEM Data that become euclidean distance map
Land Cover and Infrastructures 5.
Euclidean distance to River
JTSu
One of water sources of paddy field
Extracted from RBI Map that become euclidean distance map
6.
Euclidean distance to Main Irrigation
JTIr
Water Canal
7.
Euclidean distance to CBD Area
JTPe
Land, social, and cultural value
8.
Euclidean distance to Build Up Area
JTAt
Land, social, and cultural value
Extracted from land cover map that become euclidean distance map
9.
Euclidean distance to National and Arterial road
JTJ1
Accesibility, land, social, and cultural value
10.
Euclidean distance to Collector and Local road
JTJ2
Accesibility, land, social, and cultural value
Extracted from RBI Map that become euclidean distance map
3. Results and discussions Based on the result at logistic regression process, there are 4 environmental variables that significantly has an influence as driving factors. Those are JTS2, JTPE, JTAt, and JTJ2 (Table 3). Model is proper based on Hosmer and Lemeshow test, because the model have a value more than 5% (93 %). Nagelkerke R2 also showed that 86.7% from paddy field land change probability model can be explained by variable on model. Overall, this result will produce logistic regression formula as stated on figure 3.
4
LISAT 2017 IOP Conf. Series: Earth and Environmental Science 149 (2018) 1234567890 ‘’“” 012002
IOP Publishing doi:10.1088/1755-1315/149/1/012002
Table 3. T-test, Coefficient, Hosmer and Lemeshow, and Nagelkerke R2 Stepwise method. Variabel
β
p-value (Sig.)
Hosmer and Lemeshow
Nagelkerke R2
JTS2
-0.0234
0.000
93%
86,7%
JTPe
-0.0015
0.000
JTAt
-0.0152
0.000
JTJ2
0.0015
0.003
Constants
7.9371
0.000
Figure 3. Logistic regression formula of paddy field land change probability model.
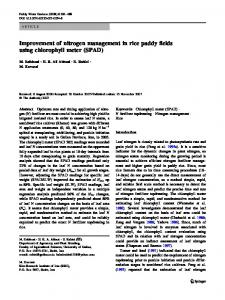
From table 3 and figure 3, we know that Slope > 8%, CBD Area, Build Up Area, and Collector & Local road are the main factors for the alteration in Karawang District. The increasing of human population that illustrated from the development of build up area and the exictence of CBD area have affected the change in paddy field area. Along with the geographical condition and development of infastructures, they become a significant driving forces in Karawang District. The probability change model is the development of the logistic regression formula. From 4 significant driving forces, we will get the map of probability change model (figure 4). From the figures 4, the red colour area shows the high probability, it means that the paddy field in red area is easily to change to another land cover. It is covered 27.8 % of all area of Karawang District. The orange colour area is a medium level of change, covered just 7.8% of total area. The green colour area is the biggest area in the map, took up more than half of total area (64.4%). This area is an area that does not affected by the alteration. The area in each probability has several significant subdistrict. In high probabilty consists of subdistrict Cikampek, Jatisari, Kotabaru, Klari, Teluk Jambe Timur, Karawang Timur, Banyusari, Lemahabang, Telaga Sari, Rengasdengklok, Tegalwaru, Batujaya, Tempuran, Jayakerta, and Pedes. Medium probability consists of subdistrict Tirtamulya, Purwasari, Telukjambe Timur, Pangkalan, Klari, Rawamerta, Tempuran, Cilamaya, Cilebar, Pedes, and Jayakerta. Low probabilty area consists of subdistrict Pakisjaya, Tirtajaya, Tirtajaya, Cilebar, Cilamaya, Rawamerta, Tirtamulya, Klari, and Ciampel.
5
LISAT 2017 IOP Conf. Series: Earth and Environmental Science 149 (2018) 1234567890 ‘’“” 012002
IOP Publishing doi:10.1088/1755-1315/149/1/012002
Figure 4. Probability change model
6
LISAT 2017 IOP Conf. Series: Earth and Environmental Science 149 (2018) 1234567890 ‘’“” 012002
IOP Publishing doi:10.1088/1755-1315/149/1/012002
4. Recommendation The recommendation is given based on each kind of probability. The recommendation for high probability are such collecting the data of paddy field & strategic value of Landscape Services, collecting the data of strategic food protection area: Subdistrict Karawang Timur, Teluk Jambe Timur, Cikampek, Jatisari, and Kotabaru, applying policies: free tax, seed incentive, fertilizer, etc, applying adaptive management [10]: Agroedutourism/Agrotourism/Integrated farming, applying law and rule enforcement about RTRW and agricultural area, and do supervision of the development of 4 driving forces. The recommendation for medium probability are like applying law and rule enforcement about strategic food protection area (Subdistrict Teluk Jambe and Klari) and adaptive management, agricultural elucidation and ease of access of saprotan, and do supervision of the development of RTRW and 4 driving forces. The last one, recommendation for low probability are such applying agricultural elucidation and ease of access of saprotan, and do supervision of the development of RTRW and 4 driving forces. Acknowledgments We gratefully acknowledged for the help that given by Badan Informasi Geospasial (en: Geospatial Information Agency, abbreviation: BIG), Staff of Pusat Penelitian Lingkungan Hidup (en: Center for Environmental Research, abbreviation: PPLH), and the government of Karawang so that this research is well done. We should also thanks to the other for the helpful suggestions. References [1] [2]
[3]
[4] [5] [6]
[7] [8] [9]
BPS 2013 The table of crop area, productivity, production of paddy throughout Indonesia. Retrieved from http://www.bps.go.id. on February 28th, 2014; Dated 2013 (in Indonesian) Franjaya EE, Syartinilia, Setiawan Y 2017 Monitoring of landscape change in paddy fields: Case study of Karawang District - West Java Province IOP Conf. Ser.: Earth Environ. Sci. 54 012016 Rodriguez MP, Butsic V, Gartner P, Macchi L, Baumann M, Pizzaro GG, Volante JN, Gasparri IN, Kuemmerle T 2018 Drivers of agricultural land-use change in the Argentine Pampas and Chaco regionsApplied Geography 91 111-122 Kumar R, Nandy S, Agarwal R, Kushwaha SPS 2014 Forest cover dynamics analysis and prediction modeling using logistic regression model Ecological Indicators 45 444-455 Indraprahasta GS 2013 The potential of urban agriculture development in Jakarta Procedia Environmental Sciences 17 11-19 Rustiadi E, Panuju DR and Trisasongko BH 2009 Environmental impacts of urbanization in Jabodetabek area S Uchida et al Bogor Proc. of The ICALRD-JIRCAS Workshop on Enhancement of Remote Sensing and GIS Technologies for Sustainable Utilization of Agricultural Resources in Indonesia Indonesian Center for Agricultural Land Resources Research and Development Ministry of Agriculture p 44-55 Handayani W 2013 Rural-urban transition in central java: population and economic structural changes based on cluster analysis Land 2 419-436 Hendayana R 2013 Application Method of Logistic Regression on analyzing the Agricultural Technology Adoption Informatika Pertanian 22 1-9
Xie C, Huang B, Claramunt C, Chandramouli M 2005 Spatial Logistic Regression and GIS to Model Rural-Urban Land Conversion. In Second International Colloquium on the Behavioral Foundations of Integrated Land-use and Transportation Models:
7
LISAT 2017 IOP Conf. Series: Earth and Environmental Science 149 (2018) 1234567890 ‘’“” 012002
IOP Publishing doi:10.1088/1755-1315/149/1/012002
Frameworks, Models and Applications. 2005 July; Toronto, Canada. [10] Liu J, Taylor WW 2004 Integrating Landscape Ecology into Natural Resource Management.
Cambridge (UK): Cambridge University Press.
8