Modelling Population Interactions: the PySAL and Open Source Way Lorraine Barry School of Geography, Archaeology & Palaeoecology Queen’s University Belfast, Northern Ireland.
[email protected] Supervisors: Dr Ian Shuttleworth, Dr Jennifer McKinley
Abstract
Regionalization
This research outlines the main limitations of the use of current aggregate data for the analysis of commuting flows using the example of Northern Ireland. Current aggregations at ward level vary greatly in size and internal commuting flows and are therefore a highly unsuitable geography for the basis of spatial interaction modelling and the understanding of commuting patterns based on socio-demographic population characteristics. This research aims to create data driven functional regions to investigate population variables which influence patterns of movement. Such research investigates interactions at regional and local scales; efficiently displays voluminous flows and patterns; and demonstrates applicability to a wider academic, census and industry setting. Creating regionalization geographies of consistent internal flows for modelling, visualising voluminous and complex data flows, and regression modelling of population characteristics can only be attempted by a move to open source developments and adaptation. Python libraries in particular PySAL* provide an invaluable platform to custom create a maximum number of zones with consistent commuter flows. QGIS offers a customisable platform for clear visualization of bulk directional movements. R programming provides a flexible structure to model interactions and demographics. Why Northern Ireland? Issues of segregation, gender and religion feature heavily within the province. Are these related to observed commuting patterns? The ability to properly model these issues through open source developing methods are important for understanding and evaluation and are demonstrated through the presentation of custom maps, scripts and statistics.
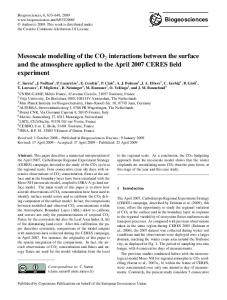
Geovisualization D3 Open Chord Diagram For Sample Belfast Wards
Goal to obtain geography of consistent internal flows for modelling
Based on example by Stewart Noyce
Regionalization
Regionalisation is the clustering or grouping of spatial units into spatially contiguous regions whilst maximising a particular objective function. (Guo, 2009).
Flow Density Map (Rae, 2011)
Source: Rey & Anselin, 2007
• Creation of purpose-specific zones • Zones of consistent internal flows • Generalisations from voluminous datasets
*PySAL Pthon Spatial Analysis Library, Sergio Rey & Luc Anselin, ASU GeoDa Center.
• Diminish effects of irregular zones
Background to Research
PySAL Region Building Code
Region Internal Flow Calculation Code
Northern Ireland Wards – Variation in Size and Internal Flows
Summary of Thresholds and Results
Spatial Interaction Modelling
MAUP EF Small Cell Scale Unit
SIM - a technique to evaluate the patterns between volume of flows and the underlying socio-economic tendencies of the origin and destination zones. (Lloyd et al, 2011)
Methods
Poisson Regression
Objectives: •To seek out more applicable functional areas / regions for interaction data. •To source and investigate methods for the regionalization of interaction data. •To draw out and investigate the key population variables which influence patterns of movement. •To investigate patterns at a regional scale and a local community scale. •To employ interaction data from Northern Ireland to serve as a case study to model methods, theories and outcomes which are applicable to national levels.
Regionalization Spatial Interaction Modelling
Geovisualization
Data Driven Models
Summary Choice of Regionalization Method and Objective Function: Max-P is the algorithm of primary focus for the intelligent aggregation of wards into regions. Max-p is python based and therefore benefits from being open source and highly customisable. It does not depend on a predefined number of regions so therefore the regionalization is driven by the data rather than an enforced arbitrary number of output groupings. (Spielman & Folch, 2015). The aim of this method is to reduce the amount of aggregation necessary to satisfy usability of the data and to create a maximum number of regions. As part of any regionalization algorithm, the objective function is crucial to output zonings. The choice of Max-p algorithm through the python library PySAL is important as it minimises the amount of aggregation and also allows flexibility in the structuring of the objective function. Currently the default objective function with Max-p is to optimize a homogeneity measure – the total sum of squared deviations SSD. At present results show that created regions have inconsistent proportions of flows largely due to the objective function. The aim of the next crucial stage of research is to modify the associated objective function to optimise for the aims of this research; that is to create flow consistent regions for spatial interaction modelling. Although challenging to adopt an objective function, Spielman & Folch propose that in combination with Max-p algorithm a modification of the objective function is possible to evaluate and shape regions (Spielman & Folch, 2015). The three strands of this research – Regionalization, Geovisualization and Spatial Interaction Modelling – are vital to understanding population flows and only possible through an adoption and development of open source methodologies. The methods presented are largely applicable to any aggregate analysis of interaction data - commuting, migration, and travel and consumer patterns. The use of both python and new or improved regionalization and visualization methods are being actively applied to the study of lifestyle data (Folch & Spielman 2014)
References Alvanides, S., Openshaw, S. and Duke-Williams, O. (2000) Designing zoning systems for flow data. In P. M. Atkinson and D. J. Martin (Eds.) Innovations in GIS 7: GIS and Geocomputation. London: Taylor and Francis, pp. 115–134. Congdon P & Lloyd C, (2012) A spatial random effects model for interzone flows: commuting in Northern Ireland, Journal of Applied Statistics, 39, 199-213. Duque, J. C., Church, R. L. and Middleton, R. S. (2011a), The p-Regions Problem. Geographical Analysis, 43: 104–126. Duque, J., L. Anselin and S. Rey. 2012. The Max-p-Regions Problem. Journal of Regional Science 52 (3): 397-419 Duque, J. C., L. Anselin and S. J. Rey. 2010. “The max-p region problem” Working Paper. GeoDa Center for Geospatial Analysis and Computation. Farmer C J Q, Stewart Fotheringham A, 2011, "Network-based functional regions" Environment and Planning A 43(11) 2723 – 2741. Folch , D and Spielman, S.E (2014) Identifying Regions based on Flexible User Defined Constraints. International Journal of Geographic Information Science. Guo, D. (2009) Flow Mapping and Multivariate Visualization of Large Spatial Interaction Data. IEEE Transactions on Visualization and Computer Graphics, Vol. 15:6, 1041-1048. Lloyd, C. D. Shuttleworth, I. G. and Catney, G. (2008) Origin-specific models for analysing commuting flows in Northern Ireland: scale effects and other problems. In D. Lambrick (Ed.) GISRUK 2008. Proceedings of the GIS Research UK 16th Annual Conference. Manchester Metropolitan University, 2nd–4th April 2008. Manchester: Manchester Metropolitan University, pp. 145–149. Martin D, (2000) Automated zone design in GIS. In: Atkinson P, Martin D (eds) GIS and Geocomputation, Innovations in GIS 7: Taylor and Francis, London, pp. 103–113 Masser I, Brown P J B, 1975, "Hierarchical aggregation procedures for interaction data" Environment and Planning A 7(5) 509 – 523 Openshaw, S. and Taylor, P. J. (1981) The modifiable areal unit problem. In N. Wrigley and R. J. Bennett (Eds.) Quantitative Geography: A British View. London: Routledge and Kegan Paul, pp. 60–69. Rae, A. (2011) Flow data analysis with geographical information systems: a visual approach. Environment and Planning B: Planning and Design. 2011, vol 38, 776-794. Rey, S. and L. Anselin. (2007) PySAL: A Python Library of Spatial Analytical Methods. The Review of Regional Studies 37(1), 2007: 5–27. Spielman, S.E. and Folch, D.F. (2015) Reducing Uncertainty in the American Community Survey through Data-Driven Regionalization. PLOSOne. Tobler W, 1987, “Experiments in migration mapping by computer” The American Cartographer 14(2) 155-163.