Coastal Engineering 145 (2019) 65–83
Contents lists available at ScienceDirect
Coastal Engineering journal homepage: www.elsevier.com/locate/coastaleng
Numerical modelling of interactions of waves and sheared currents with a surface piercing vertical cylinder
T
L.F. Chena,b,∗, D. Stagonasf, H. Santod,e,g, E.V. Buldakovc, R.R. Simonsc, P.H. Taylorb,e, J. Zanga a
WEIR Research Unit, Department of Architecture and Civil Engineering, University of Bath, Bath, BA2 7AY, UK Oceans Graduate School, Faculty of Engineering and Mathematical Sciences, University of Western Australia, Crawley, WA, 6009, Australia c Department of Civil, Environmental and Geomatic Engineering, University College of London, Gower St, London, WC1E 6BT, UK d Office of the Deputy President (Research and Technology), National University of Singapore, Singapore, 119077, Singapore e Department of Engineering Science, University of Oxford, Oxford, OX1 3PJ, UK f Cranfield University, College Rd, Wharley End, Bedford, MK43 0AL, UK g Technology Centre for Offshore and Marine, Singapore (TCOMS), Singapore, 118411, Singapore b
ARTICLE INFO
ABSTRACT
Keywords: Focussed wave groups Sheared currents Wave-on-current focussing methodology Lagrangian wave-current flume Harmonic reconstruction OpenFOAM
Vertical surface piercing cylinders, such as typical coastal wind turbine foundations and basic elements of many coastal structures, are often exposed to combined loading from waves and currents. Accurate prediction of hydrodynamic loads on a vertical cylinder in a combined wave-current flow is a challenging task. This work describes and compares two different approaches for numerical modelling of the interaction between focussed wave groups and a sheared current, and then their interactions with a vertical piercing cylinder. Both approaches employ an empirical methodology to generate a wave focussed at the location of the structure in the presence of sheared currents and use OpenFOAM, an open source Computational Fluid Dynamics (CFD) package. In the first approach, the empirical wave-on-current focussing methodology is applied directly in the OpenFOAM domain, replicating the physical wave-current flume. This approach is referred to as the Direct Method. In the second approach, a novel Lagrangian model is used to calculate the free surface elevation and flow kinematics, which are then used as boundary conditions for a smaller 3-D OpenFOAM domain with shorter simulation time. This approach is referred to as the Coupling Method. The capabilities of the two numerical methods have been validated by comparing with the experimental measurements collected in a wave-current flume at UCL. The performance of both approaches is evaluated in terms of accuracy and computational effort required. It is shown that both approaches provide satisfactory predictions in terms of local free surface elevation and nonlinear wave loading on the vertical cylinders with an acceptable level of computational cost. The Coupling Method is more efficient because of the use of a smaller computational domain and the application of the iterative wave-current generation in the faster Lagrangian model. Additionally, it is shown that a Stokes-type perturbation expansion can be generalized to approximate cylinder loads arising from wave groups on following and adverse sheared currents, allowing estimation of the higher-order harmonic shapes and time histories from knowledge of the linear components alone.
1. Introduction The review articles by Peregrine and Jonsson (1983a; b), Thomas and Klopman (1997) and Wolf and Prandle (1999) have shown that wave-current interaction is one of the important physical processes in coastal waters. The presence of a background current modifies the wave dispersion, wave-induced velocities and shear stress near the seabed etc., so has an effect on wave loads on structures and wave propagation near coastlines. Coastal engineering applications, such as the design of
coastal protection and structures as well as the evaluation of sediment transport and coastal erosion, would benefit from an enhanced knowledge of this complex process and its effect on coastal structures. In existing design methods, the current profile is usually assumed to be uniform with depth. The uniform current approximation may apply for large-scale ocean currents and deep tidal flows, but it fails to model wind-driven currents and tidal flows in shallow coastal waters that exhibit some degree of variation in the vertical direction (Chakrabarti, 1996; Forristall and Cooper, 1997; Stacey et al., 1999; Gunn and Stock-
∗ Corresponding author. Oceans Graduate School, Faculty of Engineering and Mathematical Sciences, University of Western Australia, Crawley, WA, 6009, Australia. E-mail addresses:
[email protected],
[email protected] (L.F. Chen).
https://doi.org/10.1016/j.coastaleng.2019.01.001 Received 9 August 2018; Received in revised form 19 November 2018; Accepted 2 January 2019 Available online 04 January 2019 0378-3839/ © 2019 Elsevier B.V. All rights reserved.
Coastal Engineering 145 (2019) 65–83
L.F. Chen et al.
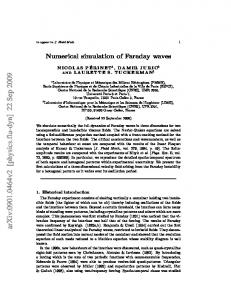
Fig. 1. Schematic side view of the UCL wave-current flume showing two wavemakers at each end of the flume, and locations of inlet and outlet of the current discharge. FP stands for Focus Point, and AMP means the location for amplitude matching.
Williams, 2013). Previous studies demonstrated that the velocity shear modifies the wave dispersion relation (Swan et al., 2001), produces changes in water-surface elevation (Tsao, 1959; Brink-Kjaer, 1976; Kishida and Sobey, 1988), and causes significant effect on the tendency of surface waves to break (Peregrine and Jonsson, 1983; Yao and Wu, 2005) in a different way when compared to depth-uniform currents. This work considers a current profile which varies with depth so has a significant depth-varying vorticity distribution. Such a profile is a more realistic representation of a current flow in some regions in the open sea. The vorticity dynamics due to wave-shear current interaction can be described by the vorticity transport equations, which are obtained by taking the curl of the momentum equations. Analytical solutions of the vorticity transport equations exist only for the constant-vorticity case (the current is linearly sheared) (Thomas, 1981, 1990; Nwogu, 2009). For more realistic profiles that vary arbitrarily with depth, the computation is more difficult because of the changing vorticity field in space and time. For initially uniform vorticity, Kelvin's circulation theory applies and the vorticity remains uniformly distributed. Then the wave motion can be treated as an irrotational disturbance, as described by Teles Da Silva and Peregrine (1988). Approximations are necessary if analytical solutions are to be sought for the cases with arbitrary vorticity. Various techniques have been developed (Kirby and Chen, 1989; Swan and James, 2001; Ko and Krauss, 2008; Smeltzer and Ellingsen, 2016), yet these have limited range of applicability; the wave is linear or weakly nonlinear, and the current strength lies within a certain range (either weak, moderate or strong). The difficulties inherent to problems associated with strongly sheared currents have necessitated the use of Computational Fluid Dynamics (CFD), which is a promising tool for modelling the interactions between waves and current, and both with structures. Much previous numerical work based on CFD has primarily concentrated on regular wave interactions with currents (Santo et al., 2017; Zhang et al., 2014; Markus et al., 2013; Li et al., 2007; Park et al., 2001). However, Tromans et al. (1991) suggested the use of NewWavetype focussed wave groups as design waves representing individual
extreme events in random seas. Jonathan and Taylor (1997), Taylor and Williams (2004), Santo et al. (2013), Christou and Ewans (2014), among others, confirmed that this theory is applicable to a wide range of wave conditions. The original NewWave theory was developed for deep water waves. Later it was demonstrated that it can be applied to waves on shallow water (Whittaker et al., 2016). The use of NewWavetype wave groups for wave-structure interaction has been demonstrated by Zang et al. (2006, 2010) for a ship-shaped fixed body and for a surface piercing cylinder, respectively. Further work using wave groups on cylinders is described in the papers by Fitzgerald et al. (2014) and Chen and co-workers (2014, 2016, 2018), and for jacket-type structures in Santo et al. (2018). Wind turbines with cylindrical foundations are likely to be located in areas with severe wave conditions, with intermediate and shallow water depths and with significant currents generated by tides, storm wind shear etc. Thus, the interaction of focussed wave groups propagating on either following or adverse sheared currents with surfacepiercing cylinders has direct practical applications. The primary challenge in the numerical modelling of focussed wave groups on sheared currents is the simultaneous and controlled generation of focussed wave groups on flow with non-uniform vorticity. The co-existence of waves and currents alters both the evolution of the waves and the profile of the currents in a way unpredictable by existing analytical approaches. As such, neither the point of focus nor the elevation of the wave and the underlying flow field are known a-priori. Various approaches are used to achieve wave focussing at a particular location and time in the absence of currents, including a dispersive focussing method and various iterative techniques. The dispersive focussing method calculates the initial phase shift of each wave component based on linear wave theory. This inevitably results in a shift of the actual focus position due to non-linear wave-wave interactions (Rapp and Melville, 1990; Baldock et al., 1996; Johannessen and Swan, 2001). The iterative methods reconcile this issue by iteratively correcting either only the initial phases (Chaplin, 1996; Yao and Wu, 2005) or both the initial phases and the amplitudes (Schmittner et al., 2009; Fernandez et al., 2014; Buldakov et al., 2017) of different wave frequency components in a wave group. The iterative approach derived in Buldakov et al. (2017) calculates the corrected input for the wavemaker considering only the linearized part of wave spectrum and therefore it differs from any previous methodology. This approach has been successfully applied to physical experiments of focussed wave groups on sheared currents (Stagonas et al., 2018a). The wave focussing methodologies discussed previously were mainly used in physical experiments; however, its application to a numerical wave flume is straightforward and can be implemented in a similar way to that in a physical flume (Stagonas et al., 2018b). For either 2-D or 3-D CFD simulations, a computationally expensive fine grid is necessary to accurately resolve the non-linear evolution of focussed wave groups, and the complex flow-structure interaction. Applying empirical wave-on-current focussing techniques in CFD-based models, even in 2-D, may yield substantial increases of the
Fig. 2. Photograph of the conditioning and profiling system. 66
Coastal Engineering 145 (2019) 65–83
L.F. Chen et al.
Fig. 3. (a) Schematic diagram of side view of the cylinder model illustrating the location of the two load cells used to measure horizontal loads. (b) Photograph of the installed cylinder model. (c) Photograph showing the four props supporting the weight of the cylinder and the second/bottom load cell connected to the bed of the flume.
computational effort required. To accommodate this, a faster numerical model may be used alternatively to produce the input wave-current kinematics for CFD-based models. This work describes and compares two CFD modelling approaches building on the widely used opensource CFD platform OpenFOAM. In the first approach, the wave-oncurrent focussing methodology (Stagonas et al., 2014, 2018a; 2018b) is applied directly to a CFD numerical wave flume, replicating the physical wave-current flume. 2-D simulations are performed first to calculate iteratively the boundary conditions required to produce focussed wave groups on different flow conditions - namely, quiescent flow without a current, adverse and following sheared current – and the interaction with the structure is then modelled in 3-D. This approach is referred to as the Direct Method hereafter unless otherwise stated. In the second approach, a novel Lagrangian model (Buldakov et al., 2015) is coupled with the CFD model. Differentiating it from recent one-way ‘online’ coupling approaches used to, e.g., model the interaction of waves with cylinders (Paulsen et al., 2014a, 2014b), the time histories of the surface elevation and flow kinematics are pre-computed using the Lagrangian model and are then used as inlet boundary conditions for the CFD model. In this ‘offline’ coupling, all reflections are dealt by the CFD simulation, eliminating the need for simultaneous computation and exchange of information between the two models. This approach is referred to as the Coupling Method. We note that such a method of domain decomposition, i.e. one-way coupling of simpler models with more advanced models, was also applied by Biausser et al. (2004), Drevard et al. (2005), Christensen et al. (2009), among others for various flow problems but excluding the effect of flow currents. Here, the 3-D numerical flume used in the Coupling Method is considerably shorter than that of the Direct Method, and the iterative wavecurrent generation is applied in the faster Lagrangian model. The performance of both approaches is validated against experimental measurements and is evaluated in terms of accuracy and computational effort. The rest of the paper is organized as follows. The physical experiments on wave-sheared current-cylinder interactions are described in Section 2. Details of the CFD and Lagrangian models are provided in Section 3. The results of both numerical modelling methodologies are compared with the experimental results in Section 4. Section 5 reconstructs the higher order harmonic forces using linear components alone. Conclusions are given in Section 6.
Fig. 4. Example of free surface elevation time histories recorded at x = −4.7 m, for U = −0.2 m/s and AL = 0.07 m. Solid line: free surface elevation profile measured with the larger cylinder installed in the flume. Dashed line: free surface elevation profile measured with the smaller cylinder installed in the flume.
2. Experimental setup and methodology A set of experiments on wave-sheared current interactions with a vertical surface-piercing cylinder of two different sizes was carried out and used to validate the proposed two CFD-based numerical models in this work. This section describes the experimental setup and the applied methodology briefly. 2.1. Experimental setup All experiments were conducted in a 20 m long, 1.2 m wide and 1 m deep recirculating wave-current flume at University College London (UCL) with a water depth of 0.5 m. Two Edinburgh Design Limited (EDL) force-feedback ‘piston-type’ wavemakers, one at each end of the facility, were used to generate and actively absorb the waves. The flow entered vertically into the working section of the flume with the inlet 67
Coastal Engineering 145 (2019) 65–83
L.F. Chen et al.
and outlet located approximately 1 m in front of each wavemaker, as shown in Fig. 1. A Cartesian coordinate system Oxz is introduced in both physical and numerical wave flumes such that the origin O is the plane of the undisturbed free surface, x = 0 is the focus point, and z positive upwards. The critical challenge of generating controlled and stable sheared currents was addressed through the use of two carefully designed flow conditioners/profilers installed on top of the inlet and the outlet. The conditioners/profilers consisted of 0.5 m long, 1.2 m wide and 0.88 m deep box sections consisting of vertically and horizontally placed cylindrical elements. Each cylindrical element had a diameter of 8 cm and was constructed using a 5 cm porous galvanised wire mesh, see Fig. 2. Compared to previous work, the flow shaping approach used here has the comparative advantage of producing sheared currents with variable vorticity distribution without considerable interference to the generation of waves, see for example Steer et al. (2017) and for more details see Stagonas et al. (2018a). Flow kinematics were measured with a high speed, time resolved Particle Image Velocimetry (PIV) system produced by TSI Incorporated. The system employs a 5 W water cooled Argon Ion laser operated at a pulsating frequency of 1 kHz. A light arm was used to direct the laser sheet upwards through the bottom of the wave flume (the bed) and measurements were taken at the focus point (FP in Fig. 1) and at a distance of approximately 27 cm from the side wall; these were also the locations of the free surface elevation measurements. The flow was seeded with 50 μm polyamide particles and PIV images with a resolution of 1024 × 1024 pixels were recorded at a frame rate of 250 fps. An example of the kinematics measured for adverse and following currents will be given in the following section. The velocity measurements are available from still water level (z = 0 m) to approximately 15 cm from the bed, beyond which the camera view was blocked by the support structure of the flume. Surface elevation measurements are used not only for validation but also for providing the inlet boundary conditions for the numerical models. Focussed wave groups were produced using a Gaussian target spectrum on a water depth of 0.5 m. The same target spectrum was used for waves on adverse and following currents and without a current. The peak frequency was set to 0.6 Hz and the point of focus was 8.7 m from the wavemaker (FP in Fig. 1). The phases of different components in a wave group were forced to come to focus at the focus point and the amplitudes were matched to the target spectrum at a distance of 4 m upstream of the focus point (AMP in Fig. 1). In this way, focussed wave groups with the same spectrum at a relatively short distance (1 m) from the inlet were produced for all flow conditions. The evolution to focus was measured in the physical wave-current flume using a set of wave gauges, providing the means to validate the numerical results not only at the focus point but also in terms of the evolution of the wave group along the flume. Free surface elevations in the flume were measured using 7 twinwire resistance-type wave gauges positioned at x = −4.7 m, −3 m, −1.8 m, −1 m, −0.5 m, −0.25 m, and 0 m, and sampled at 100 Hz. A return period of 128 s and a focus time of 64 s were selected for the wave generation. Discrete input spectra consisting of 256 frequency components with Δf = 1/128 Hz were used as input to the wavemaker. For simplicity, the wave groups produced were categorized based on the linear sum of the target amplitude components, AL. Only the results of nonlinear wave groups with AL = 0.07 m are used in the present work. The methodology employed to generate these wave groups and sheared currents both in the physical and numerical wave flumes will be described in the following subsection. Experiments were also conducted with two different cylinders positioned at x = 0 m; for these cases an additional wave gauge was placed at the front face of the cylinder. The smaller cylinder had a diameter of 0.165 m and the larger one 0.25 m. For the smaller cylinder, flow induced loads were measured using the load cell set-up described and used in Santo et al. (2017). However, in order to more effectively
Fig. 5. Comparisons of sheared current profile with depth obtained from the experiment and the numerical simulations at the location of the model cylinder for the cases with a sheared current and without waves. A – Adverse current; B – following current.
support the weight of the larger cylinder, a different arrangement was developed to measure the fluid induced horizontal force. The larger cylinder was a polyvinyl chloride (PVC) tube with a diameter of D = 0.25 m. The PVC tube/cylinder was connected to an aluminium rectangular column, marked as 'strut' in Fig. 3, via circular rings. The strut had dimensions of 0.09 m (breadth) × 0.09 m (width) × 1 m (height), and was connected to a load cell rated at 100 kg from the top through a hinge. This load cell, labelled as Load cell No 1, was rigidly fixed on the steel H-frame that was in turn tightly fixed on the flume walls. Another load cell, labelled as Load cell No 2, was located approximately 10 cm above the flume's floor and was tightly fixed on the bottom of the cylinder/strut, see Fig. 3(a) and (b). The opposite end of the second load cell was connected through rod end bearings to an aluminium base, which was in turn fixed on the bed of the flume. Four props, also made using rod ends, supported the weight of the structure resulting in a preload-free cell, see Fig. 3(c). The overall arrangement consisting of a strut, connecting rings and two load cells was mounted on rather than suspended from a steel H-frame. The latter arrangement was used in this study for the smaller cylinder as aforementioned and in previously reported tests by Santo et al. (2017). A piece of PVC was used to model the bottom of the cylinder, labelled as Lid No 1, which was approximately 10 cm above the bed of the flume. Another piece of PVC, labelled as Lid No 2, was used to extend the model cylinder down to approximately 5 mm from the bed and compartmentalise the model cylinder, see Fig. 3 (a) and (b). The compartment below the Lid No 1 was flooded and therefore a waterresistant load cell (Load cell No 2 in Fig. 3) was used. Both load cells were sampled at 1 kHz and the experimental apparatus was calibrated for both tension and compression using dead weights at the beginning and the end of every testing cycle. Surface elevation measurements recorded at x = −4.7 m (AMP in Fig. 1) for different test cases illustrate a satisfactory level of repeatability. Representative results for experiments with waves on an adverse current with the small (solid line) and the large (dashed line) cylinder in place are presented in Fig. 4. The repeatability in load cell measurements for the same testing conditions was also tested. Standard deviations of 0.11 N/0.2 N were calculated from 15 horizontal force records acquired in consecutive repeat tests with the smaller/larger cylinder exposed to waves on the adverse current. These horizontal force results are representative of all the cases considered. It is to be noted that an iterative methodology is used in both physical and numerical wave flumes to generate focussed wave groups and sheared currents in a controlled manner. In the following sections, the iterative methodology is presented first and then the numerical flumes and implementation are described. 68
Coastal Engineering 145 (2019) 65–83
L.F. Chen et al.
Fig. 6. Layout of the computational domain. D is the diameter of the vertical cylinder and λp is the peak wavelength. The truncated inlet demonstrates the inlet boundary for the Coupling Method; the computational flumes for the Coupling and the Direct Methods are bounded by the dashed grey lines and the solid black lines, respectively.
preselected target spectrum. Iterations continue until the measured linearized amplitude spectrum matches the target amplitude spectrum, and the phases of the linearized part are zero at the desired location in the flume. By matching the measured amplitude spectrum to the target spectrum, NewWave-type focussed wave groups are generated in either physical or numerical wave flumes. The methodology has also been successfully applied to generate breaking waves by focussing in a CFD wave flume (Stagonas et al., 2018b) and in the present work it is applied to a CFDbased numerical model and a Lagrangian numerical flume with following and adverse sheared currents.
Table 1 Parameters and computational costs used for two OpenFOAM-based models. Parameters
Direct Method
Coupling Method
Overall length (m) Overall width (m) Distance from inlet to cylinder (m) Distance from cylinder to outlet (m) Length of damping (relaxation) zone (m) Cell number (million) Maximum Courant number Co Computational costs (hrs) Each 3-D Each 2-D Total
13.7 (∼4λp) 1.2 (∼5D) 8.7 (∼2.7λp) 4.75 (∼1.5λp) 3 (∼λp) ∼17.2 0.25 ∼12 ∼1 ( × 12)a ∼24b
10 (∼3λp) 1.2 (∼5D) 5 (∼1.5λp) 4.75 (∼1.5λp) 3 (∼λp) ∼12.6 0.25 ∼15.5 – ∼15.5
3. Numerical setup
a
In total 3 sets of 2-D simulations are required, and each set of 2-D simulations consists of 4 runs with successive additional phase shifts of π/2, in total 12 2-D simulations are required, and each 2-D simulation requires ∼1 h computational time. b Total time is calculated as the summary of the computational time required to calculate the corrected inlet conditions using either the 2-D CFD model or the Lagrangian model and the time spent for the 3-D simulations.
Two approaches are used to replicate wave-current conditions generated in the physical flume, thus providing input conditions for the 3-D CFD model with the structure in place. In the first approach, the iteration scheme in physical experiments described in Section 2.2 is applied directly in the 2-D CFD model, while in the second approach, a Lagrangian model (Buldakov et al., 2015) is used to provide input conditions for the 3-D CFD model to reduce the size of the 3-D numerical CFD flume and shorten the simulation time. In this section, we first present a general description of OpenFOAMbased numerical models and then the methodologies used for replicating the wave-current flow generated in the physical wave-flume are detailed. The accuracy and the efficiency of the methodologies are validated by comparing with the experimental measurements.
2.2. Generation of focussed waves on adverse and following currents A methodology to accurately generate focussed waves without a current is described in Buldakov et al. (2017) and for waves on sheared currents in Stagonas et al. (2018b). The linearized part of the wave spectrum is isolated by linearly combining four non-linear free surface elevation time histories measured in the wave flume. Initially, a crest focussed wave is produced in the flume and the remaining three wave groups are generated with phase shifts of π, π/2 and 3π/2. The measured spectrum (written as a complex variable a+ib) is then decomposed as
S0 = S1 = S2 = S3 =
s0 + s1 + s2 + s3 4 s0 is1 s2 + is3 4 s0 s1 + s2 s3 4 s0 + is1 s2 is3 4
3.1. OpenFOAM-based numerical model The CFD model based on OpenFOAM solves the Navier-Stokes (NS) equations or the Reynolds-averaged Navier-Stokes (RANS) equations coupled with the continuity equation for the two-phase combined flow of water and air with the incompressibility assumption,
(1)
u + t
where, sn are complex spectra of the fully nonlinear surface elevation signals with 0, π/2, π and 3π/2 phase shifts. S0 is the complex spectrum of the 2nd order difference components and S1, S2 and S3 are complex spectra of nonlinear super-harmonics for 1st (linear), 2nd (+) and 3rd harmonic, respectively. New input amplitudes are then calculated based on the measured and the target amplitudes. In the same way input phases are also calculated
=
n 1 in (fi ) n
+(
tgt (fi )
n 1 out (fi ))
( uu )
(µ u ) =
p
gX
+
(
)+
(4)
where ρ and μ are the density and the dynamic viscosity of the mixed fluid, respectively, which are calculated following equation (6) based on the Volume-of-Fluid (VOF) technique, which will be discussed below. u = (u, v, w) is the fluid velocity field in Cartesian coordinates, and p* is the pressure in excess of hydrostatic pressure, defined as p* = p - (g·X)ρ. g is the acceleration due to gravity and X = (x, y, z) is the position vector. The stress tensor τ is defined in a standard way (Jacobsen et al., 2012) and may include viscous and Reynolds stresses depending on solver settings. Various turbulence closure models are implemented in OpenFOAM (e.g. Brown et al., 2016). However, the laminar flow model of OpenFOAM-2.4.0 is used in all computations reported here as both the external wave fields and the wave force on the cylinder are dominated by inertial (potential flow) effects (Chen et al., 2014, 2018). The reasonably good agreement between the numerical and experimental data shown in the following sections indicates that the consequences of
n 1 ainn (fi ) = ainn 1 (fi ) atgt (fi )/ aout (fi ) n in (fi )
(3)
u=0
(2)
n
where ain (fi) and ϕin (fi) are the amplitude and phase of an input spectral component at frequency fi, respectively. aoutn(fi) and ϕoutn(fi) are the amplitude and phase of the corresponding spectral components of the measured/recorded output spectrum, respectively. The superscript n indicates the n-th iteration. atgt(fi) and ϕtgt(fi) are set by the 69
Coastal Engineering 145 (2019) 65–83
L.F. Chen et al.
Fig. 7. Comparisons of the free surface elevation time histories for cases with and without a sheared current. Left: x = −4.7 m (amplitude matching position); Right: x = 0 m (phase focus position). From top to bottom: following current, no current, and adverse current. All the results presented consider cases without the structure in place.
viscosity and flow turbulence on the free surface elevation and wave forces on the cylinder that are of interest in this study are negligible as expected and supports the use of the laminar flow model. It is useful to note that turbulence modelling may be important if drag forces and the formation of wakes are significant (Santo et al., 2015). The last term on the right-hand side of equation (4) is the effect of surface tension in which σ is the surface tension coefficient and κ is the curvature of the interface. The presence of surface tension is found to have minor effects in most civil engineering applications (Jacobsen et al., 2012; Larsen et al., 2018), thus, σ = 0 is used in this study. The Volume-of-Fluid (VOF) technique is applied in OpenFOAM to locate and track the free surface (interface between air and water), with the following transport equation,
t
+
( u) +
( (1
)u ) = 0
(5)
in which α is the volume fraction function of water within each computational cell. This equation is similar to that proposed in Hirt and Nichols (1981), but with an additional compression technique (the last term on the left-hand side in which uα is an artificial compression term) to limit the numerical diffusion of the interface profile. The compression technique is developed by OpenCFD, and details can be found in Berberovic' et al. (2009). The properties of the fluid at each cell are then calculated by weighting with the VOF function α, which ranges from 0 (if there is no traced fluid inside a cell) to 1 (when the cell is full of the traced fluid),
= 70
water
+ (1
)
air ;
µ = µ water + (1
) µair
(6)
Coastal Engineering 145 (2019) 65–83
L.F. Chen et al.
conditions and other boundary conditions follow the same set-up as described in Chen et al. (2014) and Santo et al. (2017). The time step in OpenFOAM simulations is not fixed, but dynamically calculated to maintain a prescribed maximum Courant number Co = uΔt/Δx throughout the whole domain at all times. Δt is the time step, Δx is the cell size in the direction of the velocity and u is the magnitude of the velocity at that location (Courant et al., 1967). In this study an adjustable time step is used to achieve Co = 0.25, which is again determined by numerical experimentation, and not shown here for brevity. For details refer to Larsen et al. (2018). OpenFOAM offers the extensive choice of numerical schemes and the iterative solvers/algorithm settings for various terms in equations (3)–(5) (Greenshields, 2015a, b). These settings may have significant effects on the performance of the CFD solvers in terms of accuracy and efficiency (Larsen et al., 2018). The best choice can usually be determined from previous experience or on a case-by-case basis by numerical experimentation. The scheme and solver choices used in this study are summarized in Table A1 and detailed description of schemes, solvers and algorithms can be found in Greenshields (2015a, b). The combination of these choices in Table A1 has proved to work well and yield good results when applied to nonlinear wave interactions with a vertical cylinder for ranges of flow conditions studied in this work.
Fig. 8. Velocity profiles under the wave crest for focussed wave groups for all three cases considered. Numerical calculations and experimental measurements are included. A – Adverse current; B – no current; C – following current.
equations (3)–(5) are solved with the finite volume method in which the whole computational domain is discretised into a number of cells (Ferziger and Peric, 2002). The merged Pressure Implicit Splitting Operator (PISO) algorithm is then applied for each cell to decouple pressure from the momentum equation (Issa, 1986). Both 3-D CFD models in this study use standard implementations of boundary conditions available at OpenFOAM (with the exception of inlet and outlet boundaries which will be discussed later). Detailed descriptions of available types of OpenFOAM boundary conditions are available in Greenshields (2015a, b). We are modelling waves on sheared current by disturbing the original parallel sheared flow, which is specified by the prescribed current profile. The profile results from the current boundary layer developed on the solid bed and therefore originally satisfies no-slip conditions. Waves propagating over the current perturb the flow and lead to the development of a secondary wave boundary layer near the bed. However, we consider a fast evolving transient wave. The wave boundary layer does not have time to evolve and occupies only a very narrow region near the bed without affecting the rest of the flow. Considerable number of additional mesh points are required to resolve this layer with no considerable impact on the overall wave behaviour. We therefore using a standard OpenFOAM free-slip condition with zero gradient of tangential velocity as a bed/bottom condition. This allows smooth flow behaviour near the wall without high mesh resolution. The same condition is applied on the side walls. We use a no-slip boundary condition on the cylinder surface, and a computational mesh near the surface of the cylinder having the widths of cells ten times smaller than those away from the cylinder surface in order to resolve the boundary layer. The wall-normal mesh size is selected to ensure that the dimensionless wall distance (y+) is smaller than 5 based on the flat-plate boundary layer theory. The mesh dimensions for the regions away from the cylinder are determined by convergence tests to ensure that there are sufficient cells per wavelength to resolve propagating incident waves and wave-current-structure interactions; this will be discussed in more detail in the following section. It is found that further refining the mesh inside the boundary layer has negligible influence on the flow-induced forces on the cylinder. The Reynolds number Re (=ωηm2/ν) and the maximum local Keulegan-Carpenter number KC (=2 ωηm/D) in this study are approximately 8.5 × 10⁴ and 2.3, respectively. ω is the peak wave angular frequency, ν is the kinematic viscosity and ηm is the maximum free surface elevation which is about 0.15 m in this study. The initial
3.2. Direct application of the iterative wave generation methodology in CFD models This study uses and extends the toolbox ‘waves2Foam’ developed and released by Jacobsen et al. (2012) to realize wave generation and absorption in numerical wave flumes in OpenFOAM. The boundary conditions for generating waves are given analytically according to the linear wave theory, i.e. corresponding velocities and free surface elevations are specified at the input boundary faces. In this study, linear superposition of velocities of the spectral components of a wave group calculated using a desired spectrum (the spectrum of extracted linearized waves used here will be discussed later) is used to generate the focused wave group in the computational domain through a vertical wall. A new boundary condition is developed within the framework of ‘waves2Foam’ to produce a vertically sheared current. The sheared current profile is defined by a second-order polynomial which is obtained by curve fitting the measured horizontal velocity profile at the model cylinder location. Fig. 5 demonstrates the current profiles used in the CFD-based numerical simulations in this paper, and their comparison with measured experimental profiles. The combined wave and current conditions are then generated by linearly superimposing the focussed wave group and sheared current at the inlet. The boundary condition for generating sheared current is also used at the outlet to ensure mass conservation. The wave-on-current focussing methodology described in Section 2.2 is now applied to generate focussed waves on various flow conditions in the numerical wave flume. All iterations are performed in a 2-D numerical flume replicating the physical flume at UCL. Although the target spectrum used in the physical wave flume can be used as inputs for the first set of simulations, the linearized spectrum extracted from the actual experimental measurements is used instead to ensure a faster convergence to the experimental measurements (i.e. ain0 = atgt = aLinearexp and ϕin0 = ϕtgt = ϕLinearexp in equation (2)). The free surface elevations at x = −4.7 m (AMP in Fig. 1) and x = 0 m (FP in Fig. 1) in the numerical flume are recorded and used for performing the amplitude and phase corrections following equations (1) and (2). Generally, satisfactory/convergent results for all flow conditions considered in this work are obtained within 1 or 2 iterations following the first set of simulations, i.e. in total three sets of 2-D simulations are
71
Coastal Engineering 145 (2019) 65–83
L.F. Chen et al.
Fig. 9. Comparisons of the free surface elevation time histories at the front of the cylinder (left) and the horizontal forces on the cylinder (right) for the larger cylinder (D = 0.25 m). From top to bottom: following current; no current; adverse current.
required. The final corrected set of boundary conditions is then used as input for the 3-D numerical model shown in Fig. 6. Previously, the same approach has been successfully used to simulate extreme forces induced by focussed waves on a following uniform current to a jacket structure, see Santo et al. (2018). The 3-D numerical flume (which is shown in Fig. 6) consists of a rectangular domain with a vertical cylinder located at the centre of the flume. The total length of the flume is 13.7 m (∼4λp) with a distance of L0 between the inlet boundary and the vertical cylinder. The last 3 m (∼λp) of the numerical flume is occupied by the relaxation zone used to minimise wave reflections from the outlet. λp is the peak wavelength, which is ∼3.2 m in this study. The width of the computational domain is 1.2 m, and the water depth h is 0.5 m, the same as those in the experiments. In the Direct Method, L0 = 8.7 m (∼2.7 λp), the same as that in the experiments. The optimum set-up for the computational domain including its size and the mesh resolution is determined using numerical experimentation (not shown here for brevity but more details are given in Chen et al., 2014). The principle is to have the smallest possible domain size, thus minimum computational effort, while still maintaining the correct flow field around the structure. Overall, the computational domain is divided into two areas, one with a coarser and one with a finer mesh resolution. In particular, the area near the vertical cylinder and the layers near the air-water interface are resolved with a finer mesh. Horizontal and vertical grid sizes for the coarser mesh are about λp/240 and Hp/12, respectively; λp and Hp are the peak wavelength and the peak wave height, respectively. The cell size of the finer mesh is decreased by half, and cell sizes are graded
so that the size of the cells between the two areas varies smoothly. The simulations were performed using the supercomputing facility at the Pawsey Supercomputing centre which supports researchers in Western Australia. Utilising 48 cores for 3-D simulations, the computational time is approximately 12 h to obtain the results within the time scale of interest, i.e. ∼20 s of modelled time corresponding to propagation of the wave group and its interaction with the model structure. Each 2-D simulation used to calibrate the incoming wave group takes about 1 h using 24 cores. The geometric parameters used for 3-D simulations and computational costs required for both 2-D and 3-D simulations are summarized in Table 1. 3.3. Generation of the incoming wave-current flow by coupling the Lagrangian and CFD models The second method of generating wave-current conditions is based on reconstructing experimental surface elevation and kinematics of incoming waves on sheared currents by applying the iterative wave generation methodology (Section 2.2) to a Lagrangian numerical wavecurrent flume. The Lagrangian kinematics and the free surface elevation are then fed into a truncated numerical CFD wave flume with the cylinder present using an external forcing subroutine built onto waves2Foam and OpenFOAM-based numerical models. A general Lagrangian formulation for two-dimensional flow of inviscid fluid with a free surface can be found in Buldakov et al. (2006). We consider time evolution of coordinates of fluid particles x(a, c, t) and z(a, c, t) as functions of Lagrangian labels (a, c). The formulation includes the Lagrangian continuity equation,
72
Coastal Engineering 145 (2019) 65–83
L.F. Chen et al.
Fig. 10. Comparisons of the free surface elevation time histories at the front of the cylinder (left) and the horizontal forces on the cylinder (right) for the smaller cylinder (D = 0.165 m). From top to bottom: following current; no current; adverse current.
(x , z ) = J (a, c ), (a , c )
Therefore, waves on a sheared current with an undisturbed profile V (z0) are described by equations (7) and (8) with the free surface boundary condition (9), the bottom condition (10) and the vorticity distribution given by (11). Fig. 5 demonstrates velocity profiles for adverse and following currents we are using in this paper and their comparison with measured experimental profiles. The current profiles applied for the Coupling Method (CFD: Coupling Method in Fig. 5) are obtained from PIV and ADV (Acoustic Doppler Velocimetry) measurements of the current velocity using a Bezier smoothing algorithm. For convenience and efficiency of numerical realisation, we modify the original problem (7–9) and write it in the following form,
(7)
the Lagrangian form of vorticity conservation,
(x t , x ) + (a , c )
(z t , z ) = (a , c )
(a , c )
(8)
and the dynamic free-surface condition,
x tt x a + z tt z a + gz a |c = 0 = 0.
(9)
Functions J(a, c) and Ω(a, c) are given functions of Lagrangian coordinates and are defined by the initial conditions. J(a, c) is defined by initial positions of fluid particles associated with labels (a, c), and Ω(a, c) is the vorticity distribution defined by the velocity field at t = 0. It is convenient to select initial undisturbed positions of fluid particles as Lagrangian labels (a, c) = (x0, z0). This gives J = 1. For waves over a flat bed this defines a rectangular Lagrangian domain with c = 0 being the free surface and c = -h being the bottom, where h is the undisturbed water depth. The boundary condition at the lower boundary can then be specified as,
z (a ,
h, t ) =
h
t(
(c ) = V (c )
t(
(x t , x ) + (a , c )
(z t , x ) )=0 (a , c )
(12)
and
x tt x a + z tt z a + gz a = RHS (a, t )|c = 0 ,
(13)
where the operator Δt denotes the change between time steps and the right-hand side of the dynamic surface conditions includes various service terms. For calculations presented in this paper we use the following additional terms,
(10)
The presented Lagrangian formulation offers a simple treatment of vortical flows and therefore is suitable for modelling waves on vertically sheared currents. A sheared current can be defined by specifying vorticity depending only on the vertical Lagrangian coordinate c. For our choice of Lagrangian labels the parallel current can be specified as x = a + V(c)t; z = c, where V(c) = V(z0) is the current profile. Substitution to (8) gives,
(a , c ) =
(x , z ) ) = 0; (a , c )
1 2 a x aa, tt
RHS = ( 6
k (a)((x t
11 g 2z ) 12 t a, tt
V (c )) xa + z t z a ) + Px (a, t ),
(14)
where δa and δt are the numerical mesh step in a-direction and the time discretization step. The first term in (14) is the dispersion correction term, which increases the accuracy of the numerical dispersion from second to fourth order. The second term enforces dissipation of surface perturbations. It is used for absorbing reflections, and the dissipation
(11)
73
Coastal Engineering 145 (2019) 65–83
L.F. Chen et al.
Fig. 11. Harmonic components of the free surface elevation at the front face of the larger cylinder (D = 0.25 m). From top to bottom: Amplitude spectra of the free surface elevation, 2nd order difference harmonic, linear harmonic, 2nd order sum harmonic, and 3rd harmonic. From left to right: following current; no current; adverse current.
strength is regulated by the coefficient k(a). The last term in (14) is the prescribed time varying surface pressure gradient which is used for wave generation. The numerical wave-current flume is created by specifying inlet and outlet boundary conditions, distribution of surface dissipation k(a) and the surface pressure gradient Px(a,t) providing free in- and outflow of the current to and from the computational domain, generation of waves on/over the current and absorption of waves reflected from domain boundaries. The dissipation coefficient in the Lagrangian scheme is set to zero in the working section of the flume and gradually grows to a large value near the inlet and outlet boundaries. This results in a steady horizontal free surface at these boundaries which remain at their initial position z = 0 providing parallel inlet and outlet flows. This serves a double purpose. First, reflections from the boundaries are significantly reduced. Second, the boundary conditions at the inlet and outlet can be specified as the undisturbed velocity profile at the inlet and as a parallel flow at the outlet,
x t (ain , c, t ) = V (c ); za (aout , c, t ) = 0.
formulation on sheared currents is continuous deformation of the original physical domain. The accuracy of computations for strongly deformed computational cells reduces considerably. In addition, parts of the deformed physical domain can move outside the region of interest. To avoid these difficulties, we perform sheared deformation of the Lagrangian domain to compensate for the deformation of the physical domain. The deformation takes place after several time steps and moves boundaries of the physical domain back to the original vertical lines. After this Lagrangian labels are re-assigned to new values to preserve the rectangular shape of the Lagrangian computational domain with vertical and horizontal lines of the computational grid. To reproduce experimental free surface elevation records, we use the iterative procedure described in Section 2.2. Amplitudes and phases of spectral components of a pressure control signal are modified iteratively to match amplitudes and phases of the calculated linearized surface elevation spectrum at selected wave probes with target spectra. Linearized spectra of the actual experimental surface elevation at locations x = −4.7 m (amplitude matching position) and x = 0 m (focus point) are used as targets for the iterative procedure. Each numerical wave is generated with phase shifts of nπ/2, with n = 0, 1, 2, 3. This allows calculation of the linearized output signal of free surface elevation. The linearized output is then compared with the target, and corrections to the input spectrum for next iteration are calculated using the method described in Section 2.2. For further details of the iterative wave matching methodology refer to Buldakov et al. (2017). We apply the procedure to generate incoming waves for experimental cases presented in Section 2.1.
(15)
The wave is generated by creating an area in front of one of the wave absorbers where pressure distribution of a prescribed shape is defined. Time-varying amplitude of this pressure disturbance is used as a control input for wave generation. The problem is then solved numerically using a finite-difference technique. More details of the numerical method can be found in Buldakov (2013, 2014). An additional difficulty with numerical realisation of the Lagrangian
74
Coastal Engineering 145 (2019) 65–83
L.F. Chen et al.
Fig. 12. Harmonic components of the wave loading on the larger cylinder (D = 0.25 m). From top to bottom: Amplitude spectra of the force, 2nd order difference harmonic, linear harmonic, 2nd order sum harmonic, and 3rd order harmonic. From left to right: following current; no current; adverse current.
Lagrangian computations of the free surface elevation and flow kinematic time histories closer to the structure are used as boundary conditions for a new, truncated 3-D numerical CFD wave flume (when compared to the CFD domain of the Direct Method; dashed lines in Fig. 6). The model cylinder is centrally located in the new domain and the inlet is set at a distance of 5 m upstream from the cylinder. Although Lagrangian calculations cover the full extent of the numerical flume, only the results at the inlet location (truncated inlet in Fig. 6) are used in the 3-D CFD model using the Coupling Method. The Lagrangian results are stored every 0.025 s (40 Hz) and are linearly interpolated to match the internal time step of the CFD simulation. The same outlet relaxation zone (damping zone) used in the Direct Method is used in the Coupling Method to minimise wave reflection and absorb outgoing mass fluxes. In contrast to the Direct Method, all iterations for the Coupling Method are conducted in the Lagrangian wave flume therefore allowing for a shorter CFD wave flume. The layout of the computational domain is also shown in Fig. 6. Compared with the Direct Method, the distance between the (truncated) inlet boundary and the vertical cylinder is now 3 m smaller with L0 = 5 m, reducing total length of the numerical flume from 13.7 m to 10 m. More details about the CFD domains are summarized in Table 1, where it is also seen that the Coupling Method is in total (including the time required for the iterations) approximately 1.5 times faster than the Direct Method despite the fact that 3-D simulations with the former method are found to require more computational time than simulations with the latter method. This increase in computational
time is attributed to the additional time required for the communications between the externally provided inlet boundary conditions and the OpenFOAM model. In particular, small fluctuations in inlet boundary conditions require a smaller time step to ensure the stability of the simulations. 3.4. Validation of wave-current generation methods The computational results with both modelling approaches for wave-current interactions without the structure in place are now validated against experimental measurements. Free surface elevation time histories at x = −4.7 m (amplitude matching position) and at x = 0 m (focus point) with following and adverse sheared currents and without a current are presented in Fig. 7. The outputs of the Lagrangian numerical model are also included and are referred to as LaNM. An overall good agreement between experimental results and results from both the Direct and Coupling Methods is observed, with slightly larger differences being found for the Direct Method. As discussed previously, wave-current generation is different between the two numerical methods (Direct and Coupling Methods) and between numerical methods and experiments, and thus the generation of different spurious waves is expected. This explains the main differences between the methods and between calculations and experiments. The generation of spurious long waves will be discussed in more detail in the following section. It is clear from Fig. 7 that the wave shapes at the phase focussing
75
Coastal Engineering 145 (2019) 65–83
L.F. Chen et al.
Fig. 13. Harmonic components of the free surface elevation at the front face of the smaller cylinder (D = 0.165 m). From top to bottom: Amplitude spectra of the free surface elevation, 2nd order difference harmonic, linear harmonic, 2nd order sum harmonic, and 3rd order harmonic. From left to right: following current; no current; adverse current.
4. Wave-current-structure interactions
position (right panels) for the cases with and without sheared currents are similar to each other as a result of the carefully controlled wave generation. The linearized spectrum at the focus point is the same for the experiments and computations for all the current cases considered (following, no-current and adverse current), while nonlinear contributions from higher order harmonics of the focussed wave group for different current cases are rather different. This leads to the differences in the main focused wave crests and the following crests at the focussed position. Further analysis on the harmonic structure of the free surface elevation will be presented in the following section. Additionally, it can be seen that the wave shapes at the amplitude matching position (left panels) are rather different from each other for all the current cases considered. This is due to the fact that the dispersion relations are different for waves on following, zero and adverse currents. Flow kinematics computed at and below the peak of the main wave crest at focus are compared with PIV measurements in Fig. 8. It can be seen from Fig. 8 that the two CFD models (Direct and Coupling Methods) and the Lagrangian model all provide very good predictions for the flow kinematics below still water level (0 m). The largest discrepancies between the two CFD models (Direct and Coupling Methods), the Lagrangian and experimental measurements are seen to occur in the vicinity of wave crests. This difference in the velocity profile is partly caused by the inaccuracy of the numerical velocity profile (Fig. 5). The limitation of the VOF method in reconstructing very steep and sharp free-surfaces is also responsible for this difference around the interface (Wroniszewski et al., 2014). There is a sharp discontinuity of density at the interface, and the density-weighted velocity of air using the VOF factor α above the interface is close to zero, the velocity across the small interface between air and water is smeared accordingly.
Wave-current input conditions generated by the Direct Method and the Lagrangian model are now used to simulate the wave-currentstructure interaction using CFD-based models. We consider six cases, including waves on following and adverse currents and without a current interacting with cylinders of two diameters D = 0.25 m and D = 0.165 m. Comparisons between computed and measured time histories of the horizontal load on the cylinder and the free surface elevation at the front of the cylinder are presented in Figs. 9 and 10. Results for maximum free surface elevation and peak forces are summarized in Table A2 of Appendix 2. Considering the cases with the larger cylinder (Fig. 9), the time histories of the non-linear elevation and horizontal force are predicted sufficiently well by either of the two approaches and the differences are observed mostly in the amplitude of the first and the main crests which are also illustrated in Fig. 8. The peak free surface elevation and horizontal force are generally very slightly under-predicted by both approaches. An equally good comparison between experimental and numerical results is reported in Fig. 10 for the cases with the smaller cylinder. Differences in computed elevations are relatively larger than those for the larger cylinder, but differences in peak force predictions are as small as those for the larger cylinder. In all six cases considered the highest discrepancies between experimental and numerical force results are seen for the cases with adverse currents and in particular for the smaller cylinder. Computational results presented so far demonstrate a sufficient capacity of both CFD approaches (Direct and Coupling Methods) to model wave-current-structure interactions. 76
Coastal Engineering 145 (2019) 65–83
L.F. Chen et al.
Fig. 14. Harmonic components of the wave loading on the smaller cylinder (D = 0.165 m). From top to bottom: Amplitude spectra of the force, 2nd order difference harmonic, linear harmonic, 2nd order sum harmonic, and 3rd order harmonic. From left to right: following current; no current; adverse current.
In the same time, CFD model cross-comparisons, by referring to the predicted elevation and force profiles, Figs. 9 and 10, and the peak elevation and force, Table A2, show a good agreement and neither of the two approaches appears to be clearly superior to the other. Nevertheless, to further explore the source of the small differences observed between computations and between both computations and measurements, the fully non-linear elevation and force time histories are decomposed into their linear and non-linear components using the methodology described in Section 2.2. The decomposed spectrum and the inverse Fourier transformation of each spectral part (e.g. time histories of the 2nd order difference, linearized, 2nd order sum parts etc.) are shown in Figs. 11–14. The root mean square error for each spectral part is calculated as:
RMSE =
N i=1
(api N
ami )2
they are summarized in Table A3 of Appendix 2. Considering the 2nd order difference harmonics, discrepancies are seen in the inverse Fourier time histories of surface elevation and horizontal force on both cylinders. Given that waves are generated linearly in the physical flume the occurrence of, e.g., the 2nd order spurious wave crests at approximately −3 s < t < 0 s in Figs. 11 and 13 is not surprising. It is also worth noting that the same methodology (Section 2.2) was used to reproduce the experimental results in the Coupling Method and the Direct Method. As such, the presence of spurious wave crests in the numerical results is also not surprising. The Coupling Method is seen to somehow reproduce more closely 2nd order difference harmonics with the experimental results, especially for the tests without currents. Given the variability in wave generation methods between the flumes, and since the 2nd order wave generation is not employed, the differences in the elevation of the 2nd order difference harmonic are expected. The best agreement between experimental and numerical results is observed for the linearized part of the spectra. This is an expected outcome since with the iterative methodology the computations are forced to match the linearized part extracted from the experimental spectrum. However, it is illustrated by the time histories in Figs. 11–14 and the RMS errors in Table A3, the Coupling Method is more efficient in reproducing the experimental results. In contrast to spurious long waves (2nd order difference harmonic), spurious short-wave components (2nd order sum harmonic) travel with a celerity smaller than that of the wave group and thus they arrive at and interact with the structure after the focused wave. As a result, the agreement between experimental (elevation and force) measurements and computations for the 2nd order sum harmonics improves, see for example S2 for −1 s < t < 1 s in Figs. 11–14. Particularly, for tests
(16)
where api and ami are the spectral amplitudes of the ith (i = 0, 1, 2, 3) frequency predicted by the computations, and measured in the experiments, respectively. N is the number of frequencies considered in the calculations of the RMS error. N varies from 256 to 80, being larger for the linearized part and decreasing for the nonlinear part. The range of frequencies considered for calculating the RMSE is 0 < f/fp < 1 for the 2nd order difference part (S0), 0 < f/fp < 3 for the linearized part (S1), 1 < f/fp < 3 for the 2nd order sum part (S2), and 1.5 < f/ fp < 3.5 for the third order part (S3). It is noted that each frequency range was selected to include frequency components with non-negligible energy. As such, the integral spectral error calculated with equation (16) is used as an integral measure to evaluate the level of agreement between experimental and numerical results. The RMS errors for both methods and for all test cases are shown in Figs. 11–14 and 77
Coastal Engineering 145 (2019) 65–83
L.F. Chen et al.
Fig. 15. The reconstruction of horizontal wave loading on the larger cylinder (D = 0.25 m). From top to bottom: Total force, linear harmonic, 2nd order sum harmonic, 3rd order harmonic, and 4th order harmonic. From left to right: following current; no current; adverse current.
with the smaller cylinder, the RMS error for the forces predicted by the Coupling Method is smaller but once again the difference with the errors calculated for the Direct Method is not significant. Similar conclusions are drawn from Figs. 11–14 and Table A3 about the 3rd order sum harmonics albeit the agreement between the 3rd order horizontal forces is not as impressive as the agreement between experimental and numerical free surface elevation. Although the combination of four phase shifted elevation/force signals is sufficient to efficiently isolate the 3rd order harmonics (Buldakov et al., 2017), the very small amplitude of the 3rd order harmonics challenges the accuracy limits of experimental measurements. With this in mind, the performance of both Methods is considered to be satisfactory with the Coupling Method results being slightly closer to the experiments. Despite the small amplitudes, the 3rd order force harmonics are still important since they are often related to the ‘ringing’ phenomenon. With regards to the inter-comparison of the two numerical approaches, Figs. 11–14 reveal no significant differences and neither model is seen to outperform the other. The small differences in the performance of the Coupling and the Direct Method are likely due to the fact that the Lagrangian model reconstructs the experimental input conditions with slightly higher precision; see also Fig. 7. Small discrepancies in the 2nd order difference components can be attributed to the different wave generation methods adopted, but they are not seen to result in significant discrepancies in the overall computations of free surface elevation and force time series, e.g. Figs. 9 and 10. In general, RMS errors for the Coupling Method tend to be smaller than those for the Direct Method. This in combination with the smaller computational effort required (Table 1) shows an advantage in favour of the Coupling Method.
5. Force decomposition We have demonstrated in Figs. 12 and 14 that the harmonic structure of forces on a cylinder in waves and sheared currents can be accurately decomposed into harmonic contributions using the four-phase based decomposition method in Section 2.2. Chen et al. (2018) showed that the harmonic structure of force on a vertical cylinder in a wave group without current can be adequately modelled based on only the linear component as follows. We write the linear component in time as
F1 =
(17)
1f1
where 1 is the peak of the envelope of F1 in time and f1 carries all the phase information and group structure in time. Then the assumed form of the total force in time is F = gR3
1 [f ] + SFF 2 ( 13 ) 2 [ FF 2 (f12 gR3 1 gR
+ SFF 3 (
1 3 ) [ FF 3 f1 (f12 gR3
+ SFF 4 (
1 4 ) [ FF 4 (f14 gR3
f12H ) + FF 2 (2f1 f1H )]
2f12H ) + FF 3 (f1H (3f12
f12H ))]
6f12 f12H + f14H ) + FF 4 (4f1 f1H (f12
f12H ))] + ...
(18)
The force approximation contains Stokes-like amplitude terms gR3 based on the peak amplitude of the linear force component, non-dimensional force coefficients at each order SFFn and phase coef2 2 + FFn = 1. R = D/2 is the radius of the ficients ( FFn, FFn ) with FFn cylinder. The subscript H denotes the Hilbert transform of the f1 function in time, and the increasingly complicated products of f1 and f1H denote the shape of the nth harmonic in time. The coefficients SFFn and αFFn, βFFn are estimated by weighted fits, as described in Chen et al. (2018). Chen et al. (2018) showed that this approximate form works well for all the harmonics up to the 5th but that the 3rd harmonic fits are less good. Here we briefly demonstrate that these decompositions work 1/
78
Coastal Engineering 145 (2019) 65–83
L.F. Chen et al.
Fig. 16. The reconstruction of horizontal wave loading on the smaller cylinder (D = 0.165 m). From top to bottom: Total force, linear harmonic, 2nd order sum harmonic, 3rd order harmonic and 4th order harmonic. From left to right: following current; no current; adverse current.
equally well for forces from waves on sheared currents, and that the form of the current affects the force coefficients SFFn significantly, but the phase terms ( FFn, FFn ) only slightly. The coefficient values are given in Table A4 of Appendix 2. We note in passing that the assumed form of the inline force on the cylinder (equation (18)) neglects drag completely. Clearly, for the flow conditions reported here, unsteady inviscid components dominate the force time histories. The reconstructed harmonics up to the 4th harmonic are compared to the extracted experimental harmonics in Fig. 15 for the larger cylinder, and in Fig. 16 for the smaller cylinder. The experimental harmonics are extracted with the four phase decomposition method of Section 2.2 and Fitzgerald et al. (2014) and the 4th sum harmonic is separated from the 2nd order difference term by digital filtering. It can be seen from the figures that the reconstructions of the 2nd and 4th harmonics work well, and for both cylinders the amplitudes of the harmonics are largest for the following current and smallest for the adverse current. These bracket the case with no current. The 3rd harmonic contributions are fitted less well with significant structure outside the time range of the (linear envelope)3 as discussed by Chen et al. (2018) for cases without current. That is, obvious wiggles outside the envelopes of 3rd harmonics are observed as shown in Figs. 15 and 16; the envelopes of 3rd harmonics are approximated by raising the linear envelope to the power three, and then scaled to fit the measured envelopes of the 3rd harmonic component by a least-squares method (Chen et al., 2018). Further analysis of the forces and scattered waves is left for a follow-on paper.
a combined wave-current flow and a vertical surface piercing cylinder, with applications to problems in coastal engineering. Both approaches employ an iterative wave-on-current focussing methodology to ensure controlled wave-current generation. In the first approach, i.e. the Direct Method, the iterative methodology is applied directly in a 2-D OpenFOAM model to provide input conditions for a 3-D OpenFOAM model, while in the second approach, i.e. the Coupling Method, the input wave-current kinematics of the 3-D OpenFOAM model is created in a faster numerical model. In this study, a Lagrangian numerical wave-current flume is used as the fast model for reconstructing experimental surface elevation and kinematics of incoming focussed waves on sheared currents. There is no necessity to have such a long distance between the wavemaker and the structure to ensure a full development of the combined wave-current flow before the complex interactions with the structure. Thus using the Coupling Method allows a smaller 3-D computational domain and shorter simulation time for modelling wave-current-structure interactions when compared to the Direct Method. It is worth noting that the wave-on-current focussing methodology applied in this study considers only the linearized part of wave group spectrum, and phase and amplitude corrections are performed at different locations to improve the effectiveness and convergence of the iterative procedure; the phases are corrected at the pre-selected focus location, and amplitudes are corrected at a location well before the focus position. Good agreement between the experimental and numerical results demonstrates that both numerical methods are capable of replicating experimental wave-current flows, and then accurately modelling interactions between surface piercing cylinders and focussing waves on sheared currents. It is found that the Coupling Method is computational cheaper due to the application of the iterative wave-on-current focussing methodology in the faster Lagrangian model. More
6. Conclusions Two approaches are proposed and used in this numerical study to generate nonlinear focussed wave groups propagating on a sheared current so as to allow an investigation of complex interactions between 79
Coastal Engineering 145 (2019) 65–83
L.F. Chen et al.
specifically, for the simulations considered in this study the computational efficiency is increased by a factor of approximately 1.5. Overall, both approaches can be recommended as practical methods for studies of wave-current interactions with structures, especially the Coupling Method that has a higher computational efficiency. It is worth mentioning that the Lagrangian model can be coupled with various models and solvers, and is thus applicable for a wide range of wave-currentstructure interaction problems. It is also found that the Stokes-wave perturbation expansion of Chen et al. (2018) can be generalized to cylinder loads arising from wave groups on adverse and following currents and without a current. The higher-order harmonic shapes can be estimated from knowledge of the linear components alone, and the actual time history at each harmonic can be reconstructed to a reasonable approximation from the linear component time history, using an amplitude coefficient and a phase angle at each harmonic. The 2nd and 4th harmonic force coefficients are found to be the largest on a following current, and the smallest on
an adverse current. The results for waves without a current sit in between. The 3rd harmonic forces fit the simple expansion less well, as observed by Chen et al. (2018) for the case of no current. The application of this reconstruction method to a wide range of wave-current conditions will be considered in future work. Acknowledgement The authors thank EPSRC for providing partial support for this work within the Supergen MARine TechnologY challenge (Grant EP/ J010316/1). Resources provided by the Pawsey Supercomputing Centre with funding from the Australian Government and the Government of Western Australia are acknowledged. The technicians at UCL provided a high quality facility and technical service. We would also like to acknowledge the use of the NUS High Performance Computing (HPC) facility and the High Performance Computing (HPC) facility at the University of Bath in carrying out parts of this work.
Appendix 1. Numerical schemes and solvers The selected numerical schemes used to discretize the different terms in the governing equations, and the settings for the linear solvers and for the solution algorithm are summarized in Table A1. In OpenFOAM, they can be specified in the fvSchemes and fvSolution files, respectively. The treatment of the first order time derivative terms (∂/∂t) in the momentum equations is specified in the ddt scheme. Three transient schemes are widely used for engineering applications including Euler, Backwards and CrankNicolson (CN). The Euler scheme corresponds to the first-order forward Euler scheme, while Backwards is a second-order implicit time discretization scheme in which the results from the current and two previous time steps are used. A blending factor is introduced in the CrankNicolson (CN) scheme to improve its stability and robustness; the blending factor of 1 corresponds to a pure CN scheme with a second-order accuracy, and 0 corresponds to pure Euler. The simulations with the Euler scheme are faster but may lead to a heavy diffusion of the air-water interface. The use of a CN scheme is recommended for waves with long propagation distances and times (Larsen et al., 2018). One of major challenges in CFD calculations is the treatment of convective/advective terms in the governing equations. Different schemes are specified for different convective terms as they are fundamentally different. The standard finite volume discretization of Gaussian integration is implemented in OpenFOAM in which the integral over a control volume is converted to a surface integral using the Gauss theorem. Accordingly, the word “Gauss” is specified in the numerical schemes. The Gaussian integration requires the interpolation of the field variable from cell centres to face centres using for example central/linear or upwind differencing. The former is second-order accurate, but may cause oscillations (unboundedness) in the solution, while the latter is first order accurate, thus, is more diffusive. In lieu of this, various total variation diminishing (TVD) and normalized variable diagram (NVD) schemes that utilize combined upwind and linear differencing are implemented in OpenFOAM, including schemes of limitedLinear and vanLeer. The use of upwind differencing or linear upwind differencing for the momentum flux is preferable if the loads on the structure are of main concern, such as the cases in this study. A similar conclusion is presented in Larsen et al. (2018). Generally, the linear schemes are used for calculating the gradients and the interpolation from cell centres to face centres although higher order accurate schemes are available. The laplacian scheme requires the specification of an interpolation scheme for e.g. the dynamic viscosity μ, and a surface normal gradient scheme for e.g. ▽u. Again, linear schemes are often used with orthogonality corrections for surface normal gradients. For more detailed descriptions on various numerical schemes in OpenFOAM, the reader is referred to the OpenFOAM user's guide (Greenshields, 2015a, b) and programmer's guide (Greenshields, 2015a, b) as well as Larsen et al. (2018). The iterative solvers, solution tolerances and algorithm settings for solving the discretised algebraic equations are specified in the fvSolution file. Various iterative solvers are implemented in OpenFOAM, including preconditioned (bi-) conjugate gradient solvers (PCG/PBiCG) and smoothSolver in which the specification of preconditioning of matrices (preconditioner) and smoother is required, respectively. The generalized geometric-algebraic multi-grid (GAMG) solver is also commonly used in which the initial guess of the accurate solution on the finer simulation mesh is obtained by mapping the quicker solutions on a coarser mesh to this finer mesh. Generally, the GAMG solver is quicker than the smoothSolver, whereas the latter may yield more accurate results. The use of PCG/PBiCG solver sits in between. Detailed descriptions refer to the OpenFOAM user's and programmer's guides (2015). In this study, the compression velocity uα in equation (5) equals to the flow velocity at the interface by specifying cAlpha to be 1. A larger value of cAlpha leads to a sharper interface but also the appearance of wiggles in the air-water interface which is found to be responsible for un-physical steepening of waves and over-estimations of wave celerity (Larsen et al., 2018). Whereas, the use of a smaller cAlpha reduces the wiggles but at the same time leads to a more significant smearing interface. Another two important controls over the α equation are nAlphaCorr and nAlphaSubCycles; the former specifies how many times the α field should be solved within a time step, and the latter represents the number of sub-cycles for the α equation within a given time step. As aforementioned, the PISO algorithm is applied in this study, thus, nOuterCorrectors = 1, and the parameter nCorrectors is the number of pressure corrector iterations in the PISO loop and the momentumPredictor is a switch that controls solving of the momentum predictor. Each time step will be begun by solving the momentum equation rather than the pressure equation if the momentum predictor is turned on.
80
Coastal Engineering 145 (2019) 65–83
L.F. Chen et al.
Table A1
The selected numerical schemes and iterative solvers. Numerical schemes Terms in equations
Representation in OpenFOAM Time derivatives ddt Gradients grad Divergence (momentum flux) div(rho*phi, U) Divergence (mass flux) div(phi, alpha) Divergence div (phib, alpha) Laplacian laplacian Interpolation interpolation Surface normal gradient snGrad
Discretization schemes
Description First order forward Euler scheme – Second order, upwind-biased, specification of velocity gradient is required. Total variation diminishing (TVD) – Interpolation and snGrad schemes are required. – Linear with orthogonality correction
Loop starts by solving the pressure equation PISO is used, otherwise, PIMPLE is used. pressure corrector iterations α corrector iterations Number of sub-cycles
Equations Pressure p* Velocity U
Variable field pcorr/p_rgh/p_rghFinal U
VOF function α
alpha.water
Artificial compression term uα PISO loop PIMPLE loop PISO loop Loop over the α equation
cAlpha
Euler Gauss linear Gauss linearUpwind, grad(U) Gauss vanLeer Gauss linear Gauss linear corrected linear corrected Iterative solvers Solvers PCG, DIG, 1e-5, 0 smoothSolvers, symGaussSeidel, 1e-06, 0 smoothSolvers, symGaussSeidel, 1e-08, 0 Algorithm controls 1
momentumPredictor nOuterCorrectors nCorrectors nAlphaCorr nAlphaSubCycles
no 1 3 2 1
Left to right are: solver, preconditioner/smoother, tolerance, relative tolerance
uα = u in which u is the flow velocity at the interface
Appendix 2. Detailed model comparisons and coefficients used for the reconstruction Table A2 summarized the results for maximum surface elevation and peak forces, and all differences in Table A2 are calculated with respect to the experimental data and they are only used for a qualitative model comparison. Integral spectra errors are reported in Table A3 and used as an approach demonstrating model accuracy in depth. Table A4 summarized the coefficients used for reconstructing the higher order harmonics from the linear components alone, as shown in Figs. 15–16. Table A2
Comparisons between the two models in terms of wave crests/troughs and peak forces Cases Cylinders D=
0.25 m
Parameters Wave crest (m) Wave trough (m) Positive peak forces (N) Negative peak forces (N)
D = 0.165 m
Wave Crest (m) Wave trough (m) Positive peak forces (N) Negative peak forces (N)
Exp. Current (Heading) Following No current Adverse Following No current Adverse Following No current Adverse Following No current Adverse Following No current Adverse Following No current Adverse Following No current Adverse Following No current Adverse
0.144 0.118 0.107 −0.077 −0.064 −0.042 54.17 48.10 46.90 −49.04 −51.25 −46.03 0.100 0.105 0.090 −0.053 −0.059 −0.040 22.51 22.51 22.00 −24.53 −25.71 −23.04
81
Direct Method
Coupling Method
Num.
Differences (%)
Num.
Differences (%)
0.135 0.108 0.107 −0.065 −0.055 −0.046 53.07 48.10 43.89 −44.75 −48.07 −48.33 0.120 0.096 0.085 −0.049 −0.054 −0.055 23.84 20.93 18.28 −18.67 −19.66 −20.9
−6 −8 0 −16 −14 10 −2 0 −6 −9 −6 5 20 −9 −6 −8 −8 38 6 −7 −17 −24 −24 −9
0.135 0.114 0.093 −0.070 −0.061 −0.043 52.67 49.70 45.46 −48.90 −53.63 −44.94 0.120 0.105 0.091 −0.055 −0.051 −0.047 22.51 21.69 18.28 −20.17 −22.64 −19.90
−6 −3 −13 −9 −5 2 −3 3 −3 0 5 −2 20 0 1 4 −14 18 0 −4 −17 −18 −12 −14
Coastal Engineering 145 (2019) 65–83
L.F. Chen et al.
Table A3
Root-mean-square errors for various harmonics in spectra space Cases Cylinders
Direct Method
Parameters
D= 0.25 m
Free surface elevations ( × 10−2 m) Forces (N)
D= 0.165 m
Free surface elevations ( × 10−2 m) Forces (N)
Current (Heading) Following No current Adverse Following No current Adverse Following No current Adverse Following No current Adverse
2nd order dif.
Linearized
0.46 0.23 0.23 0.56 0.48 0.19 0.42 0.13 0.05 1.03 0.07 0.62
0.84 0.68 1.05 0.96 0.70 0.58 0.17 0.12 0.14 0.55 0.58 0.32
Coupling Method
2nd order sum 3rd order 2nd order dif. 0.52 0.31 0.19 0.76 0.43 0.51 0.15 0.08 0.07 0.35 0.23 0.25
0.18 0.12 0.11 0.27 0.12 0.073 0.06 0.04 0.04 0.11 0.068 0.051
0.21 0.12 0.22 0.31 0.88 0.89 0.15 0.05 0.2 0.71 0.09 0.31
linearized
2nd order sum 3rd order
0.82 0.68 0.94 0.88 0.97 0.85 0.17 0.10 0.11 0.35 0.33 0.44
0.50 0.34 0.17 0.28 0.82 0.29 0.09 0.03 0.04 0.61 0.22 0.26
0.16 0.13 0.11 0.11 0.11 0.09 0.06 0.03 0.02 0.15 0.08 0.051
Table A4
Coefficients for reconstructing the higher order harmonics for all three flow conditions kR
kh
0.242 (larger cylinder)
0.97
Order
Amplitude (SFFn)
2 3 4 2 3 4 2 3 4 2 3 4
Phase (deg.) (αFFn, βFFn)* 0.160 (smaller cylinder)
0.97
Amplitude (SFFn) Phase (deg.) (αFFn, βFFn)*
*.Phase = arctan(
Coefficients Following
No current
Adverse
3.03 0.34 0.98 97 49 145 2.01 0.12 0.33 99 183 165
2.58 0.27 0.54 94 305 123 1.89 0.34 0.22 99 245 128
2.06 0.18 0.23 73 148 68 1.51 0.32 0.09 81 190 48
FFn / FFn )
Appendix C. Supplementary data Supplementary data related to this article can be found at https://doi.org/10.1016/j.coastaleng.2019.01.001.
Chaplin, J., 1996. On frequency-focusing unidirectional waves. Int. J. Offshore Polar Eng. 6 (2), 131–137. Chen, L.F., Zang, J., Hillis, A.J., Morgan, G.C.J., Plummer, A.R., 2014. Numerical investigation of wave – structure interaction using OpenFOAM. Ocean Eng. 88, 91–109. Chen, L.F., Zang, J., Taylor, P.H., Stagonas, D., Buldakov, E., Simons, R., 2016. Numerical investigation of unsteady hydrodynamic loads on a vertical cylinder in waves and sheared currents. In: 31th International Workshop on Water Waves and Floating Bodies, 3rd-6th April, Plymouth, MI, USA, Available at: http://www.iwwwfb.org/ Abstracts/iwwwfb31/iwwwfb31_05.pdf. Chen, L.F., Zang, J., Taylor, P.H., Sun, L., Morgan, G.C.J., Grice, J., Orszaghova, J., Ruiz, M.T., 2018. An experimental decomposition of nonlinear forces on a surface-piercing column: Stokes-type expansions of the force harmonics. J. Fluid Mech. 848, 42–77. Christensen, E.D., Bredmose, H., Hansen, E.A., 2009. Transfer of Boussinesq Waves to a Navier–Stokes Solver. Application to Wave Loads on an Offshore Wind Turbine Foundation. pp. 917–926 Paper No. OMAE2009-79629. Christou, M., Ewans, K., 2014. Field measurements of rogue water waves. J. Phys. Oceanogr. 44 (9), 2317–2335. Courant, R., Friedrichs, K., Lewy, H., 1967. On the partial difference equations of mathematical physics. IBM J. Res. Dev. 11 (2), 215–234. Drevard, D., Marcer, R., Grilli, S.T., Asce, M., Fraunie, P., Rey, V., 2005. Experimental validation of a coupled BEM-Navier–Stokes model for solitary wave shoaling and breaking. In: Ocean Waves Measurements and Analysis, Fifth International Symposium WAVES 2005, Madrid, pp. 1–10. Fernandez, H., Sriram, V., Schimmels, S., Oumeraci, H., 2014. Extreme wave generation using self-correcting method – revisited. Coast. Eng. 93, 15–31. Ferziger, J.H., Peric, M., 2002. Computational Methods for Fluid Dynamics, third ed. Springer, Berlin. Fitzgerald, C., Taylor, P.H., Eatock Taylor, R., Grice, J., Zang, J., 2014. Phase manipulation and the harmonic components of ringing forces on a surface-piercing column. Proc. R. Soc. A. 470, 20130847. Forristall, G.Z., Cooper, C.K., 1997. Design current profiles using empirical orthogonal
References Berberovic´, E., van Hinsberg, N.P., Jakirlic´, S., Roisman, I.V., Tropea, C., 2009. Drop impact onto a liquid layer of finite thickness: dynamics of the cavity evolution. Phys. Rev. E - Stat. Nonlinear Soft Matter Phys. 79 (3), 036306. Baldock, T., Swan, C., Taylor, P.H., 1996. A laboratory study of nonlinear surface waves on water. Philos. Trans. Roy. Soc. A Math. Phys. Eng. Sci. 354 (1707), 649–676. Biausser, B., Fraunie, P., Grilli, S.T., Marcer, R., 2004. Numerical analysis of the internal kinematics and dynamics of 3-D breaking waves on slopes. Int. J. Offshore Polar Eng. 14, 247–256. Brink-Kjaer, O., 1976. Gravity waves on a current: the influence of vorticity, a sloping bed and dissipation. In: Series Paper 12. Inst. Of Hydrodyn. & Hydraulic Engng. Tech. University of Denmark. Brown, S.A., Greaves, D.M., Magar, V., Conley, D.C., 2016. Evaluation of turbulence closure models under spilling and plunging breakers in the surf zone. Coast Eng. 114, 177–193. Buldakov, E., 2013. Tsunami generation by paddle motion and its interaction with a beach: Lagrangian modelling and experiment. Coast Eng. 80, 83–94. Buldakov, E., 2014. Lagrangian modelling of fluid sloshing in moving tanks. J. Fluid Struct. 45, 1–14. Buldakov, E., Taylor, P.H., Eatock Taylor, R., 2006. New asymptotic description of nonlinear water waves in Lagrangian coordinates. J. Fluid Mech. 562, 431–444. Buldakov, E., Stagonas, D., Simons, R., 2015. Lagrangian numerical wave-current flume. In: 30th International Workshop on Water Waves and Floating Bodies, 12-15th April, Bristol, UK, Available at: http://www.iwwwfb.org/Abstracts/iwwwfb30/ iwwwfb30_07.pdf. Buldakov, E., Stagonas, D., Simons, R., 2017. Extreme wave groups in a wave flume: controlled generation and breaking onset. Coast Eng. 128, 75–83. Chakrabarti, S.K., 1996. Shear current and its effect on fixed and floating structures. Adv. Coas. Ocean Eng. 2, 231–276.
82
Coastal Engineering 145 (2019) 65–83
L.F. Chen et al.
optimization of deterministic wave sequences. In: Proceedings of the International Conference on Offshore Mechanics and Arctic Engineering, pp. 653–660 Paper No. OMAE2009-80131. Smeltzer, B.K., Ellingsen, S.Å., 2016. Surface waves on arbitrary vertically-sheared currents. Phys. Fluids 29, 047102. Stacey, M.T., Monismith, S.G., Buran, J.R., 1999. Measurements of Reynolds stress profiles in unstratified tidal flow. J. Geophys. Res. 104, 10935–10949. Stagonas, D., Buldakov, E., Simons, R., 2014. Focusing unidirectional wave groups on finite water depth with and without currents. Proceedings of the 34th International Coastal Engineering Conference (ICCE), vol. 34. South Korea, Seoul, pp. 1–7. Stagonas, D., Buldakov, E., Simons, R., 2018a. Experimental generation of focusing wave groups on following and adverse-sheared currents in a wave-current flume. J. Hydraul. Eng. 144 (5), 04018016. Stagonas, D., Higuera, P., Buldakov, E., 2018b. Simulating breaking focused waves in CFD: methodology for controlled generation of first and second order. J. Waterw. Port, Coast. Ocean Eng. 144 (2), 06017005. Steer, J., Stagonas, D., Buldakov, E., Borthwick, A., van den Bremer, T., 2017. Stability of surface gravity waves on constant vorticity current. Proceedings of 70th Annual Meeting of the APS Division of Fluid Dynamics, vol. 62 Bulletin of the American Physical Society 14. Swan, C., James, R.L., 2001. A simple analytical model for surface water waves on a depth-varying current. Appl. Ocean Res. 22, 331–347. Swan, C., Cummins, I.P., James, R.L., 2001. An experimental study of two-dimensional surface water waves propagating on depth-varying currents. Part 1. Regular waves. J. Fluid Mech. 428, 273–304. Taylor, P.H., Williams, B.A., 2004. Wave statistics for intermediate depth water: new waves and symmetry. J. Offshore Mech. Arctic Eng. 126 (1), 54–59. Teles Da Silva, A., Peregrine, D.H., 1988. Steep, steady surface waves on water of finite depth with constant vorticity. J. Fluid Mech. 195, 281–302. Thomas, G.P., 1981. Wave-current interactions: an experimental and numerical study. Part 1. Linear waves. J. Fluid Mech. 110, 457–474. Thomas, G.P., 1990. Wave-current interactions: an experimental and numerical study. Part 2. Nonlinear waves. J. Fluid Mech. 216, 505–536. Thomas, G.P., Klopman, G., 1997. Wave-current interactions in the nearshore region. In: Hunt, J.N. (Ed.), Gravity Waves in Water of Finite Depth. Computational Mechanics Publications, pp. 215–319. Tromans, P.S., Anatruk, A., Hagemeijer, P., 1991. New model for the kinematics of large ocean waves application as a design wave. In: Proceedings of the First International Offshore and Polar Engineering Conference, pp. 64–71. Tsao, S., 1959. Behaviour of surface waves on a linearly varying flow. Tr. Mosk. Fiz. – Tekh. Inst. Issled. Mekh. Prikl. Mat. 3, 66–84. Whittaker, C.N., Raby, A.C., Fitzgerald, C.J., Taylor, P.H., 2016. The average shape of large waves in the coastal zone. Coast Eng. 114, 253–264. Wolf, J., Prandle, D., 1999. Some observations of wave-current interaction. Coast Eng. 37 (3–4), 471–485. Wroniszewski, P.A., Verschaeve, J.C., Pedersen, G.K., 2014. Benchmarking of Navier–Stokes codes for free surface simulations by means of a solitary wave. Coast Eng. 91, 1–17. Yao, A., Wu, C.H., 2005. Incipient breaking of unsteady waves on sheared currents. Phys. Fluids 17, 082104. Zang, J., Gibson, R., Taylor, P.H., Eatock Taylor, R., Swan, C., 2006. Second order wave diffraction around a fixed ship-shaped body in unidirectional steep waves. J. Offshore Mech. Arctic Eng. 128 (2), 89–99. Zang, J., Taylor, P.H., Morgan, G., Stringer, R., Orszaghova, J., Grice, J., Tello, M., 2010. Steep wave and breaking wave impact on offshore wind turbine foundations – ringing re-visited. In: The 25th International Workshop in Water Waves and Floating Bodies, 9th-12th May, Harbin, China, . Available at: http://www.iwwwfb.org/Abstracts/ iwwwfb25/iwwwfb25_52.pdf. Zhang, J.S., Zhang, Y., Jeng, D.S., Liu, P.L.F., Zhang, C., 2014. Numerical simulation of wave-current interaction using a RANS solver. Ocean Eng. 75, 157–164.
function (EOF) and inverse FORM methods. In: Proceedings of the Offshore Technology Conference (OTC) 8267. Offshore Technology Conference. Greenshields, C.J., 2015a. OpenFOAM, the Open Source CFD Toolbox, Programmer's Guide. Version 2.4.0. OpenFOAM Foundation Ltd. Greenshields, C.J., 2015b. OpenFOAM, the Open Source CFD Toolbox, User's Guide. Version 2.4.0. OpenFOAM Foundation Ltd. Gunn, K., Stock-Williams, C., 2013. On validating numerical hydrodynamic models of complex tidal flow. Inter. J. Mar. Energy 3, e82–e89. Hirt, C.W., Nichols, B.D., 1981. Volume of fluid (VOF) method for the dynamics of free boundaries. J. Comput. Phys. 39 (1), 201–225. Issa, R.I., 1986. Solution of the implicitly discretised fluid flow equations by operatorsplitting. J. Comput. Phys. 62 (1), 40–65. Jacobsen, N.G., Fuhrman, D.R., Fredsøe, J., 2012. A wave generation toolbox for the open-source CFD library: OpenFOAM. Int. J. Numer. Methods Fluid. 70 (9), 1073–1088. Johannessen, T.B., Swan, C., 2001. A laboratory study of the focusing of transient and directionally spread surface water waves. Proc. Roy. Soc. Lond. A. 457, 971–1006. Jonathan, P., Taylor, P.H., 1997. On irregular, nonlinear waves in a spread sea. J. Offshore Mech. Arctic Eng. 119 (1), 37–41. Kirby, J.T., Chen, T.M., 1989. Surface waves on vertically sheared flows: approximate dispersion relations. J. Geophys. Res. 94, 1013–1027. Kishida, N., Sobey, R.J., 1988. Stokes theory for waves on a linear shear current. J. Eng. Mech. 114, 1317–1334. Ko, J., Krauss, W., 2008. Effect of vorticity on steady water waves. J. Fluid Mech. 608, 197–215. Larsen, B.E., Fuhrman, D.R., Roenby, J., 2018. Performance of interFoam on the Simulation of Progressive Waves. arXiv:1804.01158. Li, T., Troch, P., Rouck, J.D., 2007. Interactions of breaking waves with a current over cut cells. J. Comput. Phys. 233, 865–897. Markus, D., Hojjat, M., Wuechner, R., Bletzinger, K.U., 2013. A CFD approach to modeling wave-current interaction. Int. J. Offshore Polar Eng. 23, 29–32. Nwogu, O.G., 2009. Interaction of finite-amplitude waves with vertically sheared current fields. J. Fluid Mech. 627, 179–213. Park, J.C., Kim, M.H., Miyata, Y., 2001. Three-dimensional numerical wave tank simulations on fully nonlinear wave-current-body interactions. J. Mar. Sci. Technol. 6, 70–82. Paulsen, B.T., Bredmose, H., Bingham, H.B., 2014a. An efficient domain decomposition strategy for wave loads on surface piercing circular cylinders. Coast Eng. 86, 57–76. Paulsen, B.T., Bredmose, H., Bingham, H.B., Jacobsen, N.G., 2014b. Forcing of a bottommounted circular cylinder by steep regular water waves at finite depth. J. Fluid Mech. 755, 1–34. Peregrine, D.H., Jonsson, I.G., 1983. Interaction of waves and currents. Adv. Appl. Mech. 16, 9–117. Peregrine, D.H., Jonsson, I.G., Galvin, G.J., 1983. Annotated Bibliography on WaveCurrent Interaction. MR 83 -7. US Army, Corps of Engineers, Coastal Engineering Research Center, Fort Belvoir, VA. Rapp, R.J., Melville, W.K., 1990. Laboratory measurements of deep-water breaking waves. Philos. Trans. Roy. Soc. Lond. A Math. Phys. Eng. Sci. 331 (1622), 735–800. Santo, H., Taylor, P.H., Eatock Taylor, R., Choo, Y.S., 2013. Average properties of the largest waves in Hurricane Camille. J. Offshore Mech. Arctic Eng. 135 (1) 011602011602-7. Santo, H., Taylor, P.H., Bai, W., Choo, Y.S., 2015. Current blockage in a numerical wave tank: 3D simulations of regular waves and current through a porous tower. Comput. Fluids 115, 256–269. Santo, H., Stagonas, D., Buldakov, E., Taylor, P.H., 2017. Current blockage in sheared flow: experiments and numerical modelling of regular waves and strongly sheared current through a spaced-frame structure. J. Fluid Struct. 70, 374–389. Santo, H., Taylor, P.H., Day, A.H., Nixon, E., Choo, Y.S., 2018. Current blockage and extreme forces on a jacket model in focussed wave groups with current. J. Fluid Struct. 78, 24–35. Schmittner, C., Kosleck, S., Hennig, J., 2009. A phase-amplitude iteration scheme for the
83