during lactation forms a classical example of longitudinal data. ... lactation, (iii) correlation between test day yields decaying with increasing time between test.
Modelling test day data from dairy cattle Joanna SZYDA1, Zengting LIU2 1 2
Department of Animal Genetics, Agricultural University of Wrocław, Wrocław, Poland Biometrical Unit, United Datasystems for Animal Production (VIT), Verden, Germany
Abstract. Four statistical models for genetic evaluations utilising dairy test day data are considered. These are: a fixed regression model, a random regression model, an autoregressive model and a multiple trait model. The emphasis is put on the comparison of these models in terms of their assumed covariance structure, modelling and prediction of breeding values and parameterisation. In the future one of the models should be used for a routine genetic evaluation of the Polish Black-and-White dairy cattle. Therefore, characteristics of test day data from the Polish population are given. In conclusion, it appears that thanks to its flexibility in handling heterogeneous variances during lactation, variable autocorrelation, and nonuniform spacing between tests, random regression model forms the most suitable approach. Key-words: dairy cattle, genetic evaluation, statistical modelling , test day data
Introduction Longitudinal data consist of sets of multiple observations scored on one subject (e.g., a person or an animal) repeatedly in time. Milk production measured on cows on several test days during lactation forms a classical example of longitudinal data. From the statistical perspective, the most important feature of the analysis of such repeated observations is the ability to model the correlation between them. During the last two decades appropriate statistical methods have been developed and applied mainly in the analysis of small, experimental data sets (for overview see: DIGGLE et al. 1994). Thanks to the progress in computer hardware technology, the analysis of large amounts of data has become feasible also for modelling of test day data in dairy cattle (PTAK, SCHAEFFER 1993, SCHAEFFER, DEKKERS 1994, JAMROZIK et al. 1997). Moreover, attempts have been made recently to use test day information in national genetic evaluations for dairy cattle (REENTS et al. 1995, JAMROZIK et al. 1997). The main objective of this paper is to compare four models available for genetic evaluation based on dairy test day yields. The model which suites best the characteristics of test day data from the dairy population of the Polish Black-and-White cattle is chosen, as a desirable model for a routine genetic evaluation.
Genetic evaluation models for dairy test day data Modelling of test day data Test day data sets resulting from routine milk recording programs are considerably larger and have a more complicated covariance structure than data from designed experiments. The most characteristic features of test day data comprise: (i) between-subject correlation, (ii) differences between means and variances of measurements taken at different stages of lactation, (iii) correlation between test day yields decaying with increasing time between test days, meaning that outcomes of adjacent tests are more correlated than outcomes of remote tests, (iv) unequal spacing of test days throughout lactation. In the modelling of test day data the aforementioned features have to be accounted for. Traditionally, cow milk production measured on consecutive test days has been transformed into an aggregated 305-day yield. Such assembling of data on the phenotypic level has many disadvantages, such as the need for projecting of partially terminated records or inability to model changes in environment throughout the lactation. In order to avoid using the aggregated 305-day lactation records, various approaches to modelling of test day data
directly have been developed. These are: (i) fixed and random regression models (PTAK, SCHAEFFER 1993, SCHAEFFER, DEKKERS 1994, REENTS et al. 1995, JAMROZIK et al. 1997, MEYER 1997), (ii) first-order autoregressive models (CARVALHEIRA et al. 1998), (iii) multiple trait models (WIGGANS, GODDARD 1997; GENGLER et al. 1999). The most important characteristics of these models are outlined below. Fixed regression model The fixed regression model (FRM) was the first model proposed for modelling of dairy test day data (PTAK, SCHAEFFER 1993, REENTS et al. 1995): y ijklm = htd il + f jl + a kl + p kl + eijklm np
= htd il + ∑ β n =1
jln
x klmn + a kl + p kl + eijklm
,
where yijklm htdil fjl akl pkl np βjln
m-th test day yield of cow k in lactation l, time-independent fixed effect of herd-test-date i for lactation l, time-dependent fixed effect of lactation curve j for l-th lactation, random additive genetic effect of cow k in lactation l, random permanent environmental effect for cow k in lactation l, number of parameters fitted in the lactation curve function, n-th fixed regression coefficient of j-th lactation curve effect in l-th lactation, xklmn n-th element of the lactation curve function of days in milk (DIM), and random residual. eijklm Note that the common shape of the lactation curve for cows which calved in the same ageseason-parity class is modelled by regressing their test day yields on DIM. In statistical terms FRM is equivalent to the population-averaged model (NEUHAUS 1992). In FRM, it is assumed that additive genetic and permanent environmental effects as well as all variance components are constant throughout a lactation. This implies equal correlations between any two tests, regardless how far they are apart from each other. Although for cows belonging to different clusters e.g. age-season-parity classes, different average lactation curves are assumed, individual lactation curves are not modelled. Random regression model The random regression model (RRM; SCHAEFFER, DEKKERS 1994, JAMROZIK et al. 1997) is a further development of FRM: y ijklm = htd il + f jl + a kl + p kl + eijklm np
np
np
n =1
n =1
n =1
= htd il + ∑ β jln x klmn + ∑ α kln x klmn + ∑ γ kln x klmn + eijklm where αkln
,
n-th random regression coefficient of additive genetic effect of cow k in lactation l on DIM, γkln n-th random regression coefficient of permanent environmental effect for cow k in lactation l on DIM. Both FRM and RRM contain time-dependent (f) as well as time independent (htd) fixed effects. However, under FRM, the additive genetic and permanent environmental effects are independent of the time variable DIM, whereas under RRM, the two effects are modelled as a time-dependent function of DIM. RRM is the most useful when the objective of investigations is to make inferences about individuals rather than the population average characteristics. Statistically it is known
under the name of subject specific or random coefficient model (LAIRD, WARE 1982, WARE 1985, NEUHAUS 1992). The main idea underlying random regression modelling is that there is a heterogeneity in regression coefficients between animals. Consequently, apart from the average lactation curves fitted, as in FRM, within age-season-parity classes, RRM also fits separate individual lactation curves for animal’s additive genetic and permanent environmental effects. In contrast to FRM, RRM allows for modelling of heterogeneous variances during lactation, as well as for variable autocorrelation between test day yields. Among the most important merits of RRM there is its ability to distinguish between acrossanimal and within-animal-across-time variation. The additive genetic and permanent environmental variances on i-th DIM are σ ai2 = x i Σ α x i ' and σ 2pi = x i Σ γ x i ' , additive genetic and permanent environmental covariances between i-th and j-th DIM are σ aij = x i Σ α x j ' and
σ pij = x i Σ γ x j ' , where Σ α and Σ γ are (co)variance matrices for α and γ, respectively. Usually it is assumed that residual effects are uncorrelated, but heterogeneous variances during lactation can be modelled. Autoregressive model The autoregressive model, ARM (CARVALHEIRA et al. 1998) is expressed as: y ijklm = htd i + f jl + ak + pkl + s klm + eijklm , where sklm is the random short-term environmental effect of cow k in lactation l on test day m. Note that the above ARM model is not identical to that presented in CARVALHEIRA et al. 1998, because the aim of this piece of research is to emphasise the differences among test day models by making them comparable. As in the case of FRM, under ARM, phenotypic correlation between test day yields is modelled by additive genetic and permanent environmental effects, but an additional correlation due to the short-term environmental effects is introduced. For both environmental effects (p, s) two separate first order autoregressive (co)variance functions are assumed. Consequently, the above model can be rewritten as: y ijklm = htd i + f jl + a k + p kl + ρ s s klm-1 + u + eijklm , where ρ s u
σ s2
autocorrelation of s, normal deviate with the distribution N (0, σ s2 ) , which is a component of a firstorder autoregressive process, and variance of s.
Multiple trait model In the multiple trait model (MTM; WIGGANS, GODDARD 1997, GENGLER et al. 1999) the course of lactation is partitioned into separate traits based on months in milk, so that trait 1 is based on test day yields recorded between 5-th and 34-th DIM, trait 2 between 35-th and 64-th DIM, and so on up to trait 10 represented by test day yields recorded between 275-th and 304th DIM: y ijklm = htd il + f jl + a kl + eijklm np
= htd il + ∑ β
jln
x klmn + a klm + eijklm
n =1
where subscript m refers to the test day yield of cow k in lactation l defined as m-th trait. Such a multivariate model has unstructured (co)variance matrices, since it does not impose any pre-defined variance-covariance structure on test day data. The main advantage of
this approach is that it does not require specification of a particular shape of lactation curve for random effects. On the other hand, it requires many more parameters than the other models, therefore it is less parsimonious. Also the definition of sequential traits is somewhat arbitrary and does not seem to be well related to the physiological background of lactation. MTM does not handle unbalanced data (e.g. two tests within the same month or daily measurements) efficiently, hence in the case of multiple yields recorded within the same month it must use the average of these measurements. However, such averages have a smaller variance than the original test day records. Model comparison Modelling of the covariance structure The most important differences between the above models lie in the modelling of information from sequential test days through the imposed covariance structure. As an illustration, a part of the phenotypic variance-covariance matrix corresponding to tests from one cow in a single lactation is given for each of the models considered. i) Under FRM: σ 2 r σ 2 r σ 2 ! r σ 2 σ2 r σ 2 ! r σ 2 Vy = ! ! , σ 2 r σ 2 symm. σ 2 where σ 2 = σ a2 + σ 2p + σ e2
phenotypic variance consisting of additive genetic ( σ a2 ), permanent environmental ( σ 2p ) and residual components ( σ e2 ), and
r=
σ +σ 2 a
2 p
σ2
repeatability of the trait, which under FRM is equal to phenotypic correlation between any two tests.
ii) Under RRM: σ 12 r12σ 1σ 2 r13σ 1σ 3 ! r1nσ 1σ n 2 σ2 r23σ 2σ 3 ! r2 nσ 2σ n , Vy = " " " 2 σ n −1 rn −1, nσ n −1σ n symm. σ n2 2 2 2 2 where σ i = σ ai + σ pi + σ ei phenotypic variance on the i-th test day which consists of additive genetic ( σ a2i ),permanent environmental ( σ 2pi )and residual components ( σ e2i ) for test day i, rij =
σ aij + σ pij σ i2σ 2j
σ aij , σ pij
phenotypic correlation between tests i and j, and genetic and permanent environmental covariances between tests i and j, respectively.
iii) Under ARM: σ 2 σ a2 + σ 2p + ρ sσ s2 σ a2 + σ 2p + ρ s2σ s2 ! σ a2 + σ 2p + ρ sn −1σ s2 σ2 σ a2 + σ 2p + ρ sσ s2 ! σ a2 + σ 2p + ρ sn − 2σ s2 , Vy = ! ! σ 2 σ a2 + σ p2 + ρ sσ s2 symm. σ2 where ρs first order autocorrelation for the s effect, and 2 2 2 2 2 σ = σa +σ p +σs +σe phenotypic variance consisting of additive ( σ a2 ), longterm ( σ 2p ), short-term ( σ s2 ), and residual components ( σ e2 ). iv) Under MTM (assuming that n tests of a lactation are coded as traits 1, 2, ..., n.): σ 12 r12σ 1σ 2 r13σ 1σ 3 ! r1nσ 1σ n σ 22 r23σ 2σ 3 ! r2 nσ 2σ n Vy = " ! " σ n2−1 rn−1 nσ n −1σ n symm. σ n2 where σ i2 = σ a2i + σ 2pi + σ e2i phenotypic variance at i-th test day, rij =
σ eij
σ aij + σ pij + σ eij σ i2σ 2j
phenotypic correlation between tests i and j, and residual covariance between tests i and j.
The structure of Vy of MTM appears to be identical to that of RRM. However, the MTM approach requires a direct estimation of all (co)variance components, while in RRM these components are functions of DIM and (co)variances of parameters of lactation curve function. Under MTM variances and covariances σ a2 , σ aij , σ p2 ,σ pij ,σ e2 and σ eij take 10 different values corresponding to the number of traits defined, while under RRM take as many possible values as 305 possible values of DIM. Prediction of breeding values The computation of animal’s breeding value from additive genetic effects estimated on a daily basis reveals further differences among the four test day models. i) FRM provides a single estimate of the additive genetic effect of a cow that is constant for a whole lactation. Consequently, the breeding value for a 305-day lactation (uFRM) is equal to the additive effect obtained on a daily basis multiplied by 305: u FRM = 305a . ii) RRM assumes a heterogeneous additive genetic effect throughout the course of lactation. This is done by regressing of the additive genetic effect on individual DIM via a lactation curve function. Thus a 305-day lactation estimate of a cow’s breeding value (uRRM) corresponds 305 n p to the area under this curve: u RRM = ∑ ∑ α j xij i =1 j =1 iii) Under ARM, like under FRM, a 305-day breeding value is calculated by multiplying an estimate of the additive genetic effect by the total number of days in milk, 305.
In MTM a separate estimate of the additive genetic effect is calculated for each of the 10 traits corresponding to different months in milk. The breeding value on the basis of lactation iv)
10
(uMTM) is the sum of these estimates: u MTM = ∑ ai i =1
While RRM allows for differences between cows in the shape and level of the distribution of the additive genetic effect throughout a lactation, FRM and ARM only describe the differences in levels. MTM approximates the shape of the lactation additive genetic effect distribution with 10 different rectangles. Compared to ARM and FRM, RRM requires more test day records to give an accurate estimate of the breeding value as it fits two more parameters in the lactation curve function. Parameterisation The number of parameters required for the description of variance-covariance structures of the four models considered is given in Table 1 for the example of a single lactation. Under RRM np represents the number of parameters used for modelling additive genetic animal and permanent environmental effects, and ne represents the assumed number of different residual variances. For MTM 10 traits are assumed. It can be noticed that there are considerable differences among models in terms of their parameterisation. The most parsimonious model is FRM describing the variance-covariance structure of the data with only three parameters. On the other end is MTM which requires 110 parameters. ARM and RRM lie in-between as far as the number of fitted parameters are concerned. Parameter estimation In comparison to classical animal models based on aggregated 305-day data (HENDERSON 1984), test day models require estimation of a much larger number of (co)variance components (see Table 1). The restricted maximum likelihood method (MEYER 1997, MEYER, HILL 1997) and the Gibbs sampling algorithm (REENTS et al. 1995, JAMROZIK et al. 1997) have been applied for this purpose so far. Regarding the computing strategy, there are two common approaches to estimating of (co)variance components: one- and two-step algorithm. The former estimates (co)variance components simultaneously with other model parameters (e.g. REENTS et al. 1995, JAMROZIK et al. 1997). In a two-step method time-independent fixed effects are estimated in the first step, whereas time-dependent effects as well as (co)variance components are estimated in the second step (GENGLER et al. 1999). The two-step estimation is repeated till convergence is reached. Compared to the one-step approach, the two-step approach is easier to compute. Advantages and disadvantages FRM and ARM assume that individuals have a constant additive genetic effect throughout the course of lactation and do not allow for differences in lactation curve shapes between animals, but only between contemporary groups. On the one hand such assumptions result in parsimonious parameterisation; on the other hand, they do not seem not to make a good use of test day information and don’t reflect phenotypic observations well (LIU et al. 1998). Both MTM and RRM produce different lactation curves for each individual. As shown in Table 1, the multivariate approach of MTM is highly parameterised. Estimation of so many parameters is computationally very demanding (or for large data sets even infeasible) and may result in large standard errors. Moreover, some information, (e.g. from multiple tests within a month), can not be utilised by the model. Application of covariance functions in RRM, provides description of variance and covariance on every DIM and thus allows for optimal use of
phenotypic information and consequently more accurate parameter estimation (MEYER, HILL 1997, LIU et al. 1998).
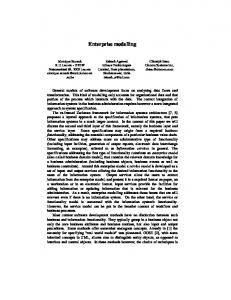
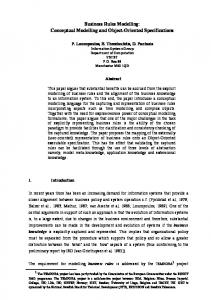
Characteristics of test day data from the Polish dairy cow population Means and variances of test day data throughout lactation The material was chosen from a productive population of the Polish Black-and-White cattle. The data consists of 1 246 622 test day records measured between 1995 and 1997 in 2 099 herds belonging to four breeding regions: Bydgoszcz, Gdańsk, Poznań, and Wrocław. This comprises milk production traits from 113 115 cows with 151 920 lactations, including 555 545 test day records from the first parity, 403 126 test day records from the second parity, and 287 951 records from the third parity. In the analysed population average yields on test day are: 15.4 kg, 0.63 kg, and 0.50 kg for milk, fat and protein, respectively (Table 2). Test day records of the first lactation clearly have a lower average and a smaller variance than later lactations. Since only completed lactations were included in this analysis, the average number of tests per lactation is 8 for all the lactations. Due to the monthly milk recording program the average interval between subsequent tests is about one month. Average deviations of individual test day milk yield from the contemporary group mean (herd-test day-parity), representing lactation curves for the first three parities are shown in Figure 1. The curves differ in both shape and height, with the first lactation being more flat than the later ones, meaning that heifers are more persistent in milk production than mature cows. Phenotypic standard deviations are not equal for different lactation stages (Figure 2). Differences are evident between parities as well. In the first lactation phenotypic variances are less heterogeneous than in later ones, but in each case measurements taken at the initial and at the final phase are more heterogeneous than measurements taken in the middle part of the lactation. Thus in statistical modelling of test day data it is important to account for such heterogeneous variances. Frequency distribution of tests throughout a lactation As shown in Figure 3, in the Polish dairy population yields are recorded with a rather uniform frequency, building a solid basis for incorporation of test day information into genetic evaluation. Only the late phase of lactation (after ca. 215th DIM) shows lower recording frequency, possibly due to early termination of lactations or culling. On average, consecutive tests are recorded every 33 days and there are 8 tests per lactation (Table 2). It is important to note that the frequency distribution of tests during lactation is continuous and fairly uniform. Thus defining the trait by polychotomizing of the whole lactation may not optimally model test day data information. For example, three tests, recorded on 5, 34 and 35 DIM respectively, would be assigned to trait 1, 1, and 2 respectively, according to the MTM trait definition. Although the second and third tests are more close in mean and (co)variance than the first and second, MTM handles the second and third tests measured on adjacent test days as two separate traits with different covariance structures. Autocorrelations between test day records throughout a lactation Autocorrelation curves for deviations of test day yields from herd-test-day-parity means are shown in Figure 4. In general, correlations between tests decrease with increasing time span. However, the rate of decay differs between lactations: the first lactation shows the highest and the third lactation the lowest decay in autocorrelation for a given time span. Under FRM the correlation between any two tests, regardless of the distance between them, is constant.
Consequently, FRM does not reflect the observed pattern of autocorrelation in test day data properly. ARM, RRM, and MTM model the decaying correlation between tests through an autoregression function, lactation curve function and unstructured (co)variance parameterisation, respectively.
Conclusions The test day data from Polish dairy cattle population shows three major features of longitudinal data: variable means of test day records throughout lactation, heterogeneous variances during the course of lactation as well as decaying autocorrelation between tests with increasing time distance. MTM and RRM account for all of the above characteristics. When computationally feasible, RRM is recommended for the routine genetic evaluation as more flexible and parsimonious.
References CARVALHEIRA J.G.V., BLAKE R.W., POLLAK E.J., QUAAS R.L., DURAN-CASTRO C.V. (1998). Application of an autoregressive process to estimate genetic parameters and breeding values for daily milk yield in a tropical herd of Lucerna cattle and in United States Holstein herds. J. Dairy Sci. 81: 2738-2751. DIGGLE P.J., LIANG K.-Y., ZEGER S.L. (1994). Analysis of longitudinal data. Oxford University Press, New York. GENGLER N., TIJANI A., WIGGANS G.R., VAN TASSEL C.P., PHILPOT J.C. (1999). Estimation of (co)variances of test day yields for first lactation Holsteins in the United States. J. Dairy Sci. 82: Online. HENDERSON C.R. (1984). Applications of linear models in animal breeding. University of Guelph, Guelph, Ontario, Canada. JAMROZIK J., SCHAEFFER L.R., LIU Z., JANSEN G. (1997). Multiple trait random regression test day model for production traits. Interbull Open Meeting, Vienna, 28.08-29.08. LAIRD M.L., WARE J.H. (1982). Random-effects models for longitudinal data. Biometrics 38: 963-974. LIU Z., JAMROZIK J., JANSEN G. (1998). A comparison of fixed and random regression models applied to dairy test day production data. Proceedings of the 1998 Interbull meeting, Rotorua, New Zealand, 17: 60-63. MEYER K. (1997). An ‘average information’ Restricted Maximum Likelihood algorithm for estimating reduced rank genetic covariance matrices or covariance functions for animal models with equal design matrices. Genet. Sel. Evol. 29: 97-116. MEYER K., HILL W.G. (1997). Estimation of genetic and phenotypic covariance functions for longitudinal or ‘repeated’ records by restricted maximum likelihood. Livest. Proc. Sci. 47: 185-200. NEUHAUS J.M. (1992). Statistical methods for longitudinal and clustered designs with binary responses. Statistical Methods in Medical Research 1: 249-273. PTAK E., SCHAEFFER L.R. (1993). Use of test day yields for genetic evaluation of dairy sires and cows. Livest. Prod. Sci. 34: 23-34. REENTS R., DEKKERS J.C.M., SCHAEFFER L.R. (1995). Genetic evaluation for somatic cell score with a test day model for multiple lactations. J. Dairy. Sci. 77: 2858- 2870. SCHAEFFER L.R., DEKKERS J.C.M. (1994). Random regression in animal models for test-day production in dairy cattle. Proc. 5th World Congr. Genet. Appl. Livest. Prod., Guelph 18: 443446. WARE J.H. (1985). Linear models for the analysis of longitudinal studies. Amer. Statist. 39: 95-101.
WIGGANS G.R., GODDARD M.E. (1997). A computationally feasible test day model for genetic evaluation of yield traits in the United States. J. Dairy. Sci. 80: 1795-1800. WILMINK J.B.M. (1987). Adjustment of test-day milk, fat and protein yields for age, season and stage of lactation. Livest. Prod. Sci. 16: 335-348.
Table 1. Parameterisation of variance-covariance structures in test day models (see the description in the text). Effect
Animal Permanent environmental Residual Sum
Number of parameters required for single lactations RRM (np=3 and FRM ne=4) ARM MTM 1 6 1 55 1 6 3 1 4 1 55 3 16 5 110
Table 2. Characteristics of test day records, in the first three lactations Items Average milk yield [kg] Average fat yield [kg] Average protein yield [kg] Average number of tests per lactation Average interval between tests [days]
Parity First three lactations 1 2 3 15.4 ±6.1 14.4 ±5.3 15.8 ±6.5 16.5 ±6.8 0.63 ±0.26 0.59 ±0.23 0.65 ±0.28 0.68 ±0.30 0.50 ±0.19 0.46 ±0.17 0.52 ±0.20 0.54 ±0.21 8.2 ±1.6 8.3 ±1.6 8.1 ±1.6 8.1 ±1.6 33.0 ±4.4 33.0 ±4.6 33.0 ±4.5 33.1 ±3.8
Figure 1. Average deviation of test day milk yield from the herd-test day-parity mean
6
average deviation of milk yield [kg]
4
2
0
-2
-4
-6 5
35
65
95
125
155 DIM
185
215
245
275
305
Figure 2. Phenotypic variances of test day milk yields
35
30
phenotypic variance
25
20
15
10
5
0 5
35
65
95
125
155 DIM
185
215
245
275
305
Figure 3. Frequency of milk tests throughout a lactation
2500
number of tests
2000
1500
1000
500
0 5
35
65
95
125
155
DIM
185
215
245
275
305
Figure 4. Autocorrelation between test day milk yields
0.7
0.6
autocorrelation
0.5
0.4
0.3
0.2
0.1
0.0 30
60
90
120
150
180
DIM between tests
210
240
270
Figure 1. Average deviation of test day milk yield from the herd-test day-parity mean DIM number of days in milk, 1st lactation 2nd lactation 3rd lactation Figure 2. Phenotypic variances of test day milk yields Yields are expressed as deviations from herd-test-day-parity mean. DIM number of days in milk, 1st lactation 2nd lactation 3rd lactation
Figure 5. Frequency of milk tests throughout a lactation. DIM
number of days in milk, 1st lactation 2nd lactation 3rd lactation
Figure 4. Autocorrelation between test day milk yields Yields are expressed as deviations from herd-test-day-parity mean. DIM number of days in milk, 1st lactation 2nd lactation 3rd lactation