stationary data, elliptical kernels attributed to each location are used ...... ance modelling and covariance propagation, and then reviews the historical ...... the gravity data used in AUSGeoid98 included erroneous ship-track gravity observations. (cf. ...... Geoid modelling using collocation in Scandinavia and Greenland.
Department of Spatial Sciences
Modi�cation of the Least-Squares Collocation Method for Non-Stationary Gravity Field Modelling
Neda Darbeheshti
This thesis is presented for the Degree of Doctor of Philosophy of Curtin University of Technology
May 2009
i
Declaration
To the best of my knowledge and belief this thesis contains no material previously published by any other person except where due acknowledgement has been made.
This thesis contains no material which has been accepted for the award of any other degree or diploma in any university.
Signature: ......................................................
Date:
.....................................
ii
ABSTRACT
Geodesy deals with the accurate analysis of spatial and temporal variations in the geometry and physics of the Earth at local and global scales. In geodesy, least-squares collocation (LSC) is a bridge between the physical and statistical understanding of different functionals of the gravitational �eld of the Earth. This thesis speci�cally focusses on the [incorrect] implicit LSC assumptions of isotropy and homogeneity that create limitations on the application of LSC in non-stationary gravity �eld modelling. In particular, the work seeks to derive expressions for local and global analytical covariance functions that account for the anisotropy and heterogeneity of the Earth's gravity �eld. Standard LSC assumes 2D stationarity and 3D isotropy, and relies on a covariance function to account for spatial dependence in the observed data. However, the assumption that the spatial dependence is constant throughout the region of interest may sometimes be violated. Assuming a stationary covariance structure can result in over-smoothing, e.g., of the gravity �eld in mountains and under-smoothing in great plains. The kernel convolution method from spatial statistics is introduced for non-stationary covariance structures, and its advantage in dealing with non-stationarity in geodetic data is demonstrated. Tests of the new non-stationary solutions were performed over the Darling Fault, Western Australia, where the anomalous gravity �eld is anisotropic and non-stationary. Stationary and non-stationary covariance functions are compared in 2D LSC to the empirical example of gravity anomaly interpolation. The results with non-stationary covariance functions are better than standard LSC in terms of formal errors and cross-validation. Both non-stationarity of mean and covariance are considered in planar geoid determination by LSC to test how differently non-stationarity of mean and covariance affects the LSC result compared with GPS-levelling points in this area. Non-stationarity of the mean was not very considerable in this case, but non-stationary covariances were very effective when optimising the gravimetric quasigeoid to agree with the geometric quasigeoid. In addition, the importance of the choice of the parameters of the non-stationary covariance functions within a Bayesian framework and the improvement of the new method for different functionals on the globe are pointed out.
iii
ACKNOWLEDGEMENTS
I would like to acknowledge the advice, suggestions, support, and friendship of a number of people who helped me during the writing of this thesis and the rest of my time as a postgraduate student in the Department of Spatial Sciences. First, I would like to thank my supervisor, Prof Will Featherstone, for his ongoing involvement in this work. In his understated way, Will offered hands-on advice, giving suggestions that guided me in a better direction.
I
would also like to thank the other members of my PhD committee. I thank my co-supervisor Jon Kirby for his collaboration; his door was always open for my questions. I would like to thank Dr. Dariush Nadri, Dr. Gustavo Pilger, Richard Gaze and James Purchase for their help with the practical and computing problems associated with geostatistics. I would also like to thank the members of Western Australian Centre for Geodesy, especially Dr Joseph Awange, Dr Sten Claessens, Dr David Belton, Ira Anjasmara, Mick Filmer and Dr Kevin Fleming for their great help on different stages of this research. I wish to thank Dr Chris Paciorek for his many valuable comments and advice, and for providing his PhD thesis on non-stationary covariance functions. I thank Prof Carl Christian Tscherning for his great help on the GRAVSOFT software. I'm grateful to the organisations provided the observation data for this research: Geoscience Australia for supplying the Australian gravity data, Landgate for providing the GPS-levelling data, National Geospatial-Intelligence Agency (NGA) Earth Gravitational Model (EGM) development team for providing the geopotential coef�cients of EGM96 and EGM2008 and DNSC for satellite altimetry data. I would also like to thank to Curtin University's International Research Tuition Scholarship (CIRTS) award for funding the University fees for this research in Australia, and Will Featherstone's RPI (research perfomance index) for funding the living allowance component of my scholarship. Finally, but most importantly, I thank my parents for setting me on the road with what I would need to get to this point.
iv
Table of Contents
ABSTRACT . . . . . . . . . . . . . . . . . . . . . . . . . . . . . . . . . . . . . . . . . . . . . . . . . . . . . . . . . . . . . . . . . . . . . . . . . . . . . . . . .
ii
ACKNOWLEDGEMENTS . . . . . . . . . . . . . . . . . . . . . . . . . . . . . . . . . . . . . . . . . . . . . . . . . . . . . . . . . . . . . . . . .
iii
Table of Contents . . . . . . . . . . . . . . . . . . . . . . . . . . . . . . . . . . . . . . . . . . . . . . . . . . . . . . . . . . . . . . . . . . . . . . . . . . . .
vi
LIST OF FIGURES
.........................................................................
xi
LIST OF TABLES . . . . . . . . . . . . . . . . . . . . . . . . . . . . . . . . . . . . . . . . . . . . . . . . . . . . . . . . . . . . . . . . . . . . . . . . . . .
xii
LIST OF ACRONYMS . . . . . . . . . . . . . . . . . . . . . . . . . . . . . . . . . . . . . . . . . . . . . . . . . . . . . . . . . . . . . . . . . . . . . . xiii LIST OF SYMBOLS . . . . . . . . . . . . . . . . . . . . . . . . . . . . . . . . . . . . . . . . . . . . . . . . . . . . . . . . . . . . . . . . . . . . . . . . xiv 1.
2.
3.
INTRODUCTION . . . . . . . . . . . . . . . . . . . . . . . . . . . . . . . . . . . . . . . . . . . . . . . . . . . . . . . . . . . . . . . . . . . . . . .
1
1.1
Historical overview of LSC . . . . . . . . . . . . . . . . . . . . . . . . . . . . . . . . . . . . . . . . . . . . . . . . . . . . . . . .
1
1.2
Limitations of, and improvements to, LSC . . . . . . . . . . . . . . . . . . . . . . . . . . . . . . . . . . . . . . .
5
1.3
Non-stationarity assumption in LSC . . . . . . . . . . . . . . . . . . . . . . . . . . . . . . . . . . . . . . . . . . . . . .
6
1.4
Main research objectives . . . . . . . . . . . . . . . . . . . . . . . . . . . . . . . . . . . . . . . . . . . . . . . . . . . . . . . . . . .
9
1.5
Thesis structure . . . . . . . . . . . . . . . . . . . . . . . . . . . . . . . . . . . . . . . . . . . . . . . . . . . . . . . . . . . . . . . . . . . . .
9
BACKGROUND THEORY OF LSC IN PHYSICAL GEODESY . . . . . . . . . . . . . . . . . . .
11
2.1
Background to LSC . . . . . . . . . . . . . . . . . . . . . . . . . . . . . . . . . . . . . . . . . . . . . . . . . . . . . . . . . . . . . . . .
11
2.2
LSC versus Kriging . . . . . . . . . . . . . . . . . . . . . . . . . . . . . . . . . . . . . . . . . . . . . . . . . . . . . . . . . . . . . . . .
15
2.3
Summary . . . . . . . . . . . . . . . . . . . . . . . . . . . . . . . . . . . . . . . . . . . . . . . . . . . . . . . . . . . . . . . . . . . . . . . . . . .
18
STRUCTURAL ANALYSIS OF SPATIAL DATA . . . . . . . . . . . . . . . . . . . . . . . . . . . . . . . . . . . .
19
3.1
Describing the spatial behaviour of a spatial random �eld (SRF) . . . . . . . . . . . . . . .
19
3.2
Empirical covariance functions . . . . . . . . . . . . . . . . . . . . . . . . . . . . . . . . . . . . . . . . . . . . . . . . . . . .
21
3.3
Covariance models . . . . . . . . . . . . . . . . . . . . . . . . . . . . . . . . . . . . . . . . . . . . . . . . . . . . . . . . . . . . . . . . .
22
3.4
The law of covariance propagation . . . . . . . . . . . . . . . . . . . . . . . . . . . . . . . . . . . . . . . . . . . . . . . .
27
3.4.1
Global covariance models . . . . . . . . . . . . . . . . . . . . . . . . . . . . . . . . . . . . . . . . . . . . . . . . .
28
3.4.2
Local planar covariance models . . . . . . . . . . . . . . . . . . . . . . . . . . . . . . . . . . . . . . . . . .
29
3.5
Anisotropic covariance functions . . . . . . . . . . . . . . . . . . . . . . . . . . . . . . . . . . . . . . . . . . . . . . . . . .
31
3.6
Fitting a covariance model to empirical covariances . . . . . . . . . . . . . . . . . . . . . . . . . . . . .
32
3.7
The stationarity concept in LSC . . . . . . . . . . . . . . . . . . . . . . . . . . . . . . . . . . . . . . . . . . . . . . . . . . .
33
v
3.8
Evidence of non-stationarity in geodetic data . . . . . . . . . . . . . . . . . . . . . . . . . . . . . . . . . . . .
35
3.8.1
Non-stationarity in Australian gravity anomaly data . . . . . . . . . . . . . . . . . . . .
36
Effect of non-stationarity on LSC results . . . . . . . . . . . . . . . . . . . . . . . . . . . . . . . . . . . . . . . . .
39
3.10 Summary . . . . . . . . . . . . . . . . . . . . . . . . . . . . . . . . . . . . . . . . . . . . . . . . . . . . . . . . . . . . . . . . . . . . . . . . . . .
41
NON-STATIONARY SOLUTIONS TO BLUE PROBLEMS . . . . . . . . . . . . . . . . . . . . . . . .
42
4.1
Non-stationary BLUE solutions in geodesy . . . . . . . . . . . . . . . . . . . . . . . . . . . . . . . . . . . . . .
42
4.1.1
Trend removal . . . . . . . . . . . . . . . . . . . . . . . . . . . . . . . . . . . . . . . . . . . . . . . . . . . . . . . . . . . . .
42
4.1.2
Riesz representers . . . . . . . . . . . . . . . . . . . . . . . . . . . . . . . . . . . . . . . . . . . . . . . . . . . . . . . . .
44
4.1.3
Wavelet approach . . . . . . . . . . . . . . . . . . . . . . . . . . . . . . . . . . . . . . . . . . . . . . . . . . . . . . . . . .
45
Non-stationary BLUE solutions in geostatistics . . . . . . . . . . . . . . . . . . . . . . . . . . . . . . . . . .
47
4.2.1
Locally adaptive Kriging . . . . . . . . . . . . . . . . . . . . . . . . . . . . . . . . . . . . . . . . . . . . . . . . . .
47
4.2.2
Segmentation . . . . . . . . . . . . . . . . . . . . . . . . . . . . . . . . . . . . . . . . . . . . . . . . . . . . . . . . . . . . . .
48
Non-stationary BLUE solutions in spatial statistics . . . . . . . . . . . . . . . . . . . . . . . . . . . . . .
49
4.3.1
Spatial deformation models . . . . . . . . . . . . . . . . . . . . . . . . . . . . . . . . . . . . . . . . . . . . . . .
49
4.3.2
Kernel smoothing of empirical covariance matrices . . . . . . . . . . . . . . . . . . . . .
52
4.3.3
Basis-function models . . . . . . . . . . . . . . . . . . . . . . . . . . . . . . . . . . . . . . . . . . . . . . . . . . . . .
55
4.3.4
Kernel convolution models . . . . . . . . . . . . . . . . . . . . . . . . . . . . . . . . . . . . . . . . . . . . . . . .
57
Summary . . . . . . . . . . . . . . . . . . . . . . . . . . . . . . . . . . . . . . . . . . . . . . . . . . . . . . . . . . . . . . . . . . . . . . . . . . .
61
3.9
4.
4.2
4.3
4.4 5.
6.
NON-STATIONARY COVARIANCE FUNCTIONS USING CONVOLUTION OF KERNELS . . . . . . . . . . . . . . . . . . . . . . . . . . . . . . . . . . . . . . . . . . . . . . . . . . . . . . . . . . . . . . . . . . . . . . . . . . . . . . .
62
5.1
HSK approach of kernel convolution . . . . . . . . . . . . . . . . . . . . . . . . . . . . . . . . . . . . . . . . . . . . .
62
5.2
Generalisation of the HSK approach to current covariance models . . . . . . . . . . . . .
66
5.3
Implementation of HSK non-stationary covariances in LSC . . . . . . . . . . . . . . . . . . . .
72
5.4
Single point analysis of non-stationary versus stationary covariances . . . . . . . . . .
76
5.5
Summary . . . . . . . . . . . . . . . . . . . . . . . . . . . . . . . . . . . . . . . . . . . . . . . . . . . . . . . . . . . . . . . . . . . . . . . . . . .
80
Application of non-stationary methods in physical geodesy . . . . . . . . . . . . . . . . . . . . . . . . . .
81
6.1
Comparing stationary versus non-stationary LSC for interpolation . . . . . . . . . . . . .
81
6.1.1
The Darling Fault's gravity �eld . . . . . . . . . . . . . . . . . . . . . . . . . . . . . . . . . . . . . . . . . .
81
6.1.2
Global stationary covariances . . . . . . . . . . . . . . . . . . . . . . . . . . . . . . . . . . . . . . . . . . . . .
85
6.1.3
Partitioned stationary covariances . . . . . . . . . . . . . . . . . . . . . . . . . . . . . . . . . . . . . . . .
85
6.1.4
Anisotropy . . . . . . . . . . . . . . . . . . . . . . . . . . . . . . . . . . . . . . . . . . . . . . . . . . . . . . . . . . . . . . . . .
87
6.1.5
Non-stationary covariances . . . . . . . . . . . . . . . . . . . . . . . . . . . . . . . . . . . . . . . . . . . . . . .
88
vi
6.1.6 6.2
Interpolation error estimates . . . . . . . . . . . . . . . . . . . . . . . . . . . . . . . . . . . . . . . . . . . . . .
92
Considering non-stationarity for the optimisation of a gravimetric quasigeoid compared with GPS-levelling points . . . . . . . . . . . . . . . . . . . . . . . . . . . . . . . . . . . . . . . . . . . . . .
94
6.2.1
Geometric quasigeoid in the Perth region . . . . . . . . . . . . . . . . . . . . . . . . . . . . . . . .
96
6.2.2
Gravimetric quasigeoid determination with planar LSC . . . . . . . . . . . . . . . . 100
6.2.3
Comparing different gravimetric quasigeoids for the Perth region . . . . . 104
6.2.4
Using non-stationary mean and covariance methods to optimise a gravimetric quasigeoid to a geometric quasigeoid . . . . . . . . . . . . . . . . . . . . . . . 109
6.3 7.
Summary . . . . . . . . . . . . . . . . . . . . . . . . . . . . . . . . . . . . . . . . . . . . . . . . . . . . . . . . . . . . . . . . . . . . . . . . . . . 120
SUMMARY, CONCLUSIONS AND OUTLOOK . . . . . . . . . . . . . . . . . . . . . . . . . . . . . . . . . . . . 121 7.1
Summary . . . . . . . . . . . . . . . . . . . . . . . . . . . . . . . . . . . . . . . . . . . . . . . . . . . . . . . . . . . . . . . . . . . . . . . . . . . 121
7.2
Conclusions. . . . . . . . . . . . . . . . . . . . . . . . . . . . . . . . . . . . . . . . . . . . . . . . . . . . . . . . . . . . . . . . . . . . . . . . . 122
7.3
Outlook . . . . . . . . . . . . . . . . . . . . . . . . . . . . . . . . . . . . . . . . . . . . . . . . . . . . . . . . . . . . . . . . . . . . . . . . . . . . . 124
REFERENCES . . . . . . . . . . . . . . . . . . . . . . . . . . . . . . . . . . . . . . . . . . . . . . . . . . . . . . . . . . . . . . . . . . . . . . . . . . . . . . 125
vii
List of Figures
Figure 2.1
Interpretation of the general model of LSC, l: observation, n: observation error, AX: systematic part of the phenomenon, s: random part of the phenomenon and y: signal to be predicted at observation points (from Moritz (1980a)). . . . . . . . . . . . . . . . . . . . . . . . . . . . . . . . . . . . . . . . . . . . . .
13
Figure 2.2
Diagram of the LSC procedure (from Herzfeld (1992)) . . . . . . . . . . . . . . . . .
15
Figure 3.1
Covariance models with unit variance . . . . . . . . . . . . . . . . . . . . . . . . . . . . . . . . . . . .
25
Figure 3.2
(left) Gaussian covariance function and (right) Gaussian variogram for various values of
Figure 3.3
d (distances in km).
d (distances in km). . . . . . . . . . . . . . . . . . . . . . . . . .
27
(left) Geometric anisotropy with the major axis along the E-W direction; (right) zonal anisotropy (distances in km). . . . . . . . . . . . . . . . . . . . . . . . . .
Figure 3.5
26
(left) Exponential covariance function and (right) Exponential variogram for various values of
Figure 3.4
................................
31
2 Covariance map (in m ) (left) of the geoid heights from EGM96 (degree and order 2-60) (right) representing the geoid slope (in m) across Australia [Lambert conic conformal projection] . . . . . . . . . . . . . . . . . . . . . . . .
Figure 3.6
32
The phenomenon is (upper graph) not stationary because of the increase in the average. Over shorter sections (bottom graph), it can be considered as being locally stationary because the �uctuations dominate the trend (Armstrong, 1998). . . . . . . . . . . . . . . . . . . . . . . . . . . . . . . . . . . . . . . .
Figure 3.7
34
Land gravity observation coverage over Australia (top); Thirty-nine (blocks 24 and 25 were merged)
5◦ × 5◦ blocks used to estimate local
empirical covariances (Numbers represent Block No. in Table 3.2), the underlying image shows topographic map of Australia (bottom) [Mercator projection] . . . . . . . . . . . . . . . . . . . . . . . . . . . . . . . . . . . . . . . . . . . . . . . . . . . . . .
37
viii
Figure 4.1
An illustration of (left) the G-plane (original surface) and (right) Dplane (transformed surface) for the spatial deformation method (from Damian et al. (2001)) . . . . . . . . . . . . . . . . . . . . . . . . . . . . . . . . . . . . . . . . . . . . . . . . . . . . . .
Figure 4.2
51
Estimated kernels of the process-convolution model for the Piazza Road data. Solid ellipses represent the kernels at the sampling sites and dotted ellipses the extension to a regular grid according to the random �eld prior model.
The underlying image show the corre-
sponding posterior mean estimates for the dioxin concentrations (from Swall (1999)). . . . . . . . . . . . . . . . . . . . . . . . . . . . . . . . . . . . . . . . . . . . . . . . . . . . . . . . . . . . . . .
Figure 5.1
(a) Correlation of Correlation of
R(−0.5, s) with the function at all other points.
(b)
R(0.5, s) with the function at all other points (adapted
from Paciorek (2003)). . . . . . . . . . . . . . . . . . . . . . . . . . . . . . . . . . . . . . . . . . . . . . . . . . . . . Figure 5.2
59
66
One-dimensional example for illustration of the triangle inequality with three points on a line, two points equidistant from the central point and on either side . . . . . . . . . . . . . . . . . . . . . . . . . . . . . . . . . . . . . . . . . . . . . . . . . . . .
Figure 5.3
(left) Three-dimensional view, and (right) contour plot of a bivariate normal distribution. . . . . . . . . . . . . . . . . . . . . . . . . . . . . . . . . . . . . . . . . . . . . . . . . . . . . . . . .
Figure 5.4
73
Geometry and parameters of the ellipse used to parameterise the nonstationary HSK kernels . . . . . . . . . . . . . . . . . . . . . . . . . . . . . . . . . . . . . . . . . . . . . . . . . . . .
Figure 5.5
68
73
Different forms of the kernels de�ned by Eq. (5.27). Identical isotropic kernels representing stationary covariance functions (top-left); identical anisotropic kernels representing stationary anisotropic covariance functions (top-right); kernels varying in orientation representing non-stationary covariance functions (bottom-left); kernels varying in orientation and size representing non-stationary covariance functions (bottom-right) (adapted from Swall (1999)). . . . . . . . . . . . . . . . . . . . . . . . . . . . . .
Figure 5.6
75
(left) Stationary con�guration of a sample data set. (right) Gaussian stationary covariances between point
p and stationary data with d =
245 m . . . . . . . . . . . . . . . . . . . . . . . . . . . . . . . . . . . . . . . . . . . . . . . . . . . . . . . . . . . . . . . . . . . . . . .
76
ix
Figure 5.7
(top) Non-stationary con�guration of a sample data set. left) Stationary covariances between point
(bottom
p and non-stationary data.
(bottom right) Non-stationary covariances between point
p and non-
stationary data, elliptical kernels attributed to each location are used to construct the non-stationary covariances . . . . . . . . . . . . . . . . . . . . . . . . . . . . . .
Figure 6.1
(Left) Satellite image (Landsat 21189-01004-7, April 25, 1978) and (Right) schematic picture of the Darling Fault (NASA, 2008) . . . . . . . . . .
Figure 6.2
78
82
Residual free air gravity anomalies (in mGal) after adding 100 mGal across the Darling Fault, Western Australia, showing non-stationarity where they are systematically lower to the west than the east [Mercator projection]. The fault runs north-south, approximately following the maximum horizontal gradient of the gravity data. . . . . . . . . . . . . . . . . . .
Figure 6.3
84
Stationary Cauchy model and empirical covariances of residual free air gravity anomalies for the whole Darling Fault test area (cf. Figure 6.2) . . . . . . . . . . . . . . . . . . . . . . . . . . . . . . . . . . . . . . . . . . . . . . . . . . . . . . . . . . . . . . . . . . . . . . . . .
Figure 6.4
Partitioned stationary Cauchy empirical covariances for the eastern (left) and western (right) parts of the Darling Fault test area . . . . . . . . . . . .
Figure 6.5
Figure 6.7
86
2 Covariance map of the residual free air gravity anomalies (in mGal ) over the Darling Fault test area [linear projection] . . . . . . . . . . . . . . . . . . . . . .
Figure 6.6
85
Empirical covariances for azimuth
0◦
90◦ (lower left), 135◦ (lower right)
.......................................
(upper left),
45◦
87
(upper right), 88
Elliptical kernels attributed to each location and used to construct the non-stationary covariances for LSC interpolation.
The underlying
image shows the residual free air gravity anomalies after adding 100 mGal [Mercator projection]. Figure 6.8
α has been �xed at 20◦ for all ellipses. . . .
91
Stationary LSC interpolation errors from external cross-validation (left) and from internal LSC covariance propagation (right) [Mercator projection] . . . . . . . . . . . . . . . . . . . . . . . . . . . . . . . . . . . . . . . . . . . . . . . . . . . . . . . . . . . . . .
Figure 6.9
93
Non-stationary LSC interpolation errors from external cross-validation (left) and from internal LSC covariance propagation (right) [Mercator projection] . . . . . . . . . . . . . . . . . . . . . . . . . . . . . . . . . . . . . . . . . . . . . . . . . . . . . . . . . . . . .
93
x
Figure 6.10
Ellipsoidal
(h), normal (HN ) and orthometric height (H), g0
and
γ0
are the gravity on the geoid and the normal gravity on the ellipsoid respectively (adapted from Torge (2001)). Figure 6.11
..............................
96
Distribution of the 99 GPS-AHD points around Perth (white boxes show station number), with the contours of the GPS-quasigeoid-AHD residuals (εζgeo ) referenced to EGM2008-2160 (contour interval 0.02 m) [Mercator projection]; For 99 GPS-levelling points, the statistics of
εζgeo
are: Maximum 0.311m, Minimum -0.019m, Mean 0.126m,
STD 0.051m. . . . . . . . . . . . . . . . . . . . . . . . . . . . . . . . . . . . . . . . . . . . . . . . . . . . . . . . . . . . . . . Figure 6.12
98
Linear regression of the 99 GPS-quasigeoid-AHD residuals (εζgeo ) in meters versus (left) latitude and (right) longitude in degrees referenced to EGM2008-2160. From the gradient in degrees, this gives a tilt of
Figure 6.13
∼ 0.71 mm/km in latitude and ∼ −0.38 mm/km in longitude. . . .
99
Coverage of free air gravity anomalies for residual quasigeoid determination, which is a combination of irregular land data from Geoscience Australia released in 2008, and 1-arc-minute DNSC offshore [Mercator projection] . . . . . . . . . . . . . . . . . . . . . . . . . . . . . . . . . . . . . . . . . . . . . . . . . . . . . . 101
Figure 6.14
The planar LSC algorithm for optimising the gravimetric quasigeoid to the geometric quasigeoid . . . . . . . . . . . . . . . . . . . . . . . . . . . . . . . . . . . . . . . . . . . . . . 102
Figure 6.15
Fitting of the empirical covariance of residual Faye anomalies
ε∆g
(solid line) with planar covariance model of Forsberg (1987) (dashed line) . . . . . . . . . . . . . . . . . . . . . . . . . . . . . . . . . . . . . . . . . . . . . . . . . . . . . . . . . . . . . . . . . . . . . . . . . 103 Figure 6.16
Neighbourhood of
400 around prediction points (marked with a black
point), the underlying colour shows the residual Faye anomalies anomalies Figure 6.17
ε∆g
referenced to EGM2008-2160 [Mercator projection] . . . . . . . . . . 104
Gravimetric AUSGeoid98 (Featherstone et al., 2001) (upper left), quasigeoid from Stokes's formula (Kirby, 2003) (upper right), quasigeoid from the GEOCOL program (lower left), quasigeoid from planar LSC (lower right), all relative to EGM96-360 (contour interval 0.1 m) [Mercator projection] . . . . . . . . . . . . . . . . . . . . . . . . . . . . . . . . . . . . . . . . . . . . . 106
xi
Figure 6.18
Gravimetric quasigeoid differences from different methods: (AUSGeoid98
−
Kirby (2003)) (upper left), (AUSGeoid98
(upper right), (AUSGeoid98 (2003)
−
−
GEOCOL)
Planar LSC) (middle left), (Kirby
GEOCOL) (middle right), (Kirby (2003)
(lower left) and (GEOCOL
−
−
Planar LSC)
− Planar LSC) (lower right) (contour in-
terval 0.02 m) [Mercator projection] . . . . . . . . . . . . . . . . . . . . . . . . . . . . . . . . . . . . . 107 Figure 6.19
Contours of the difference in the geometric and gravimetric quasigeoids (εζgeo
− εζgra )
referenced to EGM2008-2160 (contour inter-
val 0.02 m) [Mercator projection]; For 99 GPS-levelling points, the statistics of
εζgeo − εζgra
are: Maximum 0.217m, Minimum 0.052m,
Mean 0.126m, STD 0.037m. . . . . . . . . . . . . . . . . . . . . . . . . . . . . . . . . . . . . . . . . . . . . . 108 Figure 6.20
Covariance map of the residual Faye anomalies anomalies
ε∆g
refer-
2 enced to EGM2008-2160 (in mGal ) [linear projection] . . . . . . . . . . . . . . . 113 Figure 6.21
Empirical covariances for the residual Faye anomalies anomalies referenced to EGM2008-2160 for azimuth: per right),
(upper left),
30◦
(up-
60◦ (middle left), 90◦ (middle right), 120◦ (lower left) and
150◦ (lower right) Figure 6.22
0◦
ε∆g
. . . . . . . . . . . . . . . . . . . . . . . . . . . . . . . . . . . . . . . . . . . . . . . . . . . . . . . . . 114
Elliptical kernels attributed to each observation point used to construct the non-stationary auto covariance matrix of Cε∆g ,ε∆g .
The
underlying image shows the residual Faye anomalies referenced to EGM2008-2160 [Mercator projection] . . . . . . . . . . . . . . . . . . . . . . . . . . . . . . . . . . . 116 Figure 6.23
Elliptical kernels attributed to each prediction point used to construct the non-stationary cross-covariance matric of Cεζ ,ε∆g . The color of the ellipses shows the residual geometric heights
εζgeo
referenced to
EGM2008-2160 [Mercator projection] . . . . . . . . . . . . . . . . . . . . . . . . . . . . . . . . . . 118
xii
List of Tables
Table 2.1
Synopsis of BLUE methods . . . . . . . . . . . . . . . . . . . . . . . . . . . . . . . . . . . . . . . . . . . . . . . .
16
Table 3.1
Covariances models . . . . . . . . . . . . . . . . . . . . . . . . . . . . . . . . . . . . . . . . . . . . . . . . . . . . . . . .
24
Table 3.2
Local parameters of residual free air gravity anomaly empirical covariances referenced to EGM96. . . . . . . . . . . . . . . . . . . . . . . . . . . . . . . . . . . . . . . . . . . .
Table 5.1
38
Comparing distance measures for covariance functions in terms of stationarity . . . . . . . . . . . . . . . . . . . . . . . . . . . . . . . . . . . . . . . . . . . . . . . . . . . . . . . . . . . . . . . . . . . . .
69
Table 5.2
Non-stationary versus stationary covariance functions . . . . . . . . . . . . . . . . . . .
71
Table 5.3
Results of the predictions for point
p
based on stationary and non-
stationary covariances . . . . . . . . . . . . . . . . . . . . . . . . . . . . . . . . . . . . . . . . . . . . . . . . . . . . .
Table 6.1
Cauchy model parameter estimates for the global and east-west partitioned stationary covariances . . . . . . . . . . . . . . . . . . . . . . . . . . . . . . . . . . . . . . . . . . . . . . .
Table 6.2
79
87
Statistics from the external cross-validation of the differences between observed and predicted residual free air gravity anomalies (units in mGal) . . . . . . . . . . . . . . . . . . . . . . . . . . . . . . . . . . . . . . . . . . . . . . . . . . . . . . . . . . . . . . . . . . . . . . . .
Table 6.3
Statistics of internal errors from LSC covariance propagation (units in mGal) . . . . . . . . . . . . . . . . . . . . . . . . . . . . . . . . . . . . . . . . . . . . . . . . . . . . . . . . . . . . . . . . . . . . . . . .
Table 6.4
94
94
Parameters describing the �tting of the empirical covariance of the residual Faye anomalies ε∆g with the planar covariance model of Forsberg (1987) . . . . . . . . . . . . . . . . . . . . . . . . . . . . . . . . . . . . . . . . . . . . . . . . . . . . . . . . . . . . . . . . . . 103
Table 6.5
Statistics of the
εζgeo − εζgra
referenced to EGM96-360 for 99 GPS-
AHD points in metres. . . . . . . . . . . . . . . . . . . . . . . . . . . . . . . . . . . . . . . . . . . . . . . . . . . . . . . 105 Table 6.6
A typical sample of the mean and variance of the observation vectors for the GPS-levelling prediction points. . . . . . . . . . . . . . . . . . . . . . . . . . . . . . . . . . . . 111
Table 6.7
Statistics of the (εζgeo
− εζgra ) referenced to EGM2008-2160 in metres
for the 99 GPS-levelling points . . . . . . . . . . . . . . . . . . . . . . . . . . . . . . . . . . . . . . . . . . . . 119
xiii
LIST OF ACRONYMS
BLUE
Best Linear Unbiased Estimation . . . . . . . . . . . . . . . . . . . . . . . . . . . . . . .
2
CHAMP
Challenging Mini-satellite Payload . . . . . . . . . . . . . . . . . . . . . . . . . . . . . .
3
EGM
Earth Gravitational Model . . . . . . . . . . . . . . . . . . . . . . . . . . . . . . . . . . . . . .
32
EOFs
Empirical Orthogonal Functions . . . . . . . . . . . . . . . . . . . . . . . . . . . . . . . . .
55
FFT
Fast Fourier Transform . . . . . . . . . . . . . . . . . . . . . . . . . . . . . . . . . . . . . . . . .
3
GGM
Global Geopotential Model . . . . . . . . . . . . . . . . . . . . . . . . . . . . . . . . . . . . .
82
GOCE
Gravity Field and Steady-State Ocean Circulation Explorer . . . . . . . .
3
HSK
kernel convolution method of Higdon et al. (1999) . . . . . . . . . . . . . . . .
62
LSC
Least-Squares Collocation . . . . . . . . . . . . . . . . . . . . . . . . . . . . . . . . . . . . .
ii
MCMC
Markov Chain Monte Carlo . . . . . . . . . . . . . . . . . . . . . . . . . . . . . . . . . . . . .
55
MRA
Multiresolution Analysis . . . . . . . . . . . . . . . . . . . . . . . . . . . . . . . . . . . . . . .
45
OK
Ordinary Kriging . . . . . . . . . . . . . . . . . . . . . . . . . . . . . . . . . . . . . . . . . . . . . .
16
PDF
Probability Density Function . . . . . . . . . . . . . . . . . . . . . . . . . . . . . . . . . . .
64
PSD
Power Spectral Density . . . . . . . . . . . . . . . . . . . . . . . . . . . . . . . . . . . . . . . . .
29
RF
Random Field . . . . . . . . . . . . . . . . . . . . . . . . . . . . . . . . . . . . . . . . . . . . . . . . .
47
SK
Simple Kriging . . . . . . . . . . . . . . . . . . . . . . . . . . . . . . . . . . . . . . . . . . . . . . .
16
SRF
Spatial Random Field . . . . . . . . . . . . . . . . . . . . . . . . . . . . . . . . . . . . . . . . . .
8
UK
Universal Kriging . . . . . . . . . . . . . . . . . . . . . . . . . . . . . . . . . . . . . . . . . . . . .
16
xiv
LIST OF MAJOR SYMBOLS
a
major axis of an ellipsoid . . . . . . . . . . . . . . . . . . . . . . . . . . . . . . . . . . . . . .
73
b
minor axis of an ellipsoid . . . . . . . . . . . . . . . . . . . . . . . . . . . . . . . . . . . . . .
73
α
geodetic azimuth . . . . . . . . . . . . . . . . . . . . . . . . . . . . . . . . . . . . . . . . . . . . . .
69
C
covariance . . . . . . . . . . . . . . . . . . . . . . . . . . . . . . . . . . . . . . . . . . . . . . . . . . . .
20
C0
variance . . . . . . . . . . . . . . . . . . . . . . . . . . . . . . . . . . . . . . . . . . . . . . . . . . . . . .
23
d
correlation length . . . . . . . . . . . . . . . . . . . . . . . . . . . . . . . . . . . . . . . . . . . . .
24
∆g
gravity anomaly . . . . . . . . . . . . . . . . . . . . . . . . . . . . . . . . . . . . . . . . . . . . . . .
36
K
convolution kernel . . . . . . . . . . . . . . . . . . . . . . . . . . . . . . . . . . . . . . . . . . . .
53
Kn
modi�ed Bessel function . . . . . . . . . . . . . . . . . . . . . . . . . . . . . . . . . . . . . . .
23
λ
geodetic longitude . . . . . . . . . . . . . . . . . . . . . . . . . . . . . . . . . . . . . . . . . . . . .
28
m
arithmetic mean . . . . . . . . . . . . . . . . . . . . . . . . . . . . . . . . . . . . . . . . . . . . . . .
21
N
geoid . . . . . . . . . . . . . . . . . . . . . . . . . . . . . . . . . . . . . . . . . . . . . . . . . . . . . . . . .
29
µ
expected value . . . . . . . . . . . . . . . . . . . . . . . . . . . . . . . . . . . . . . . . . . . . . . . .
20
φ
geodetic latitude . . . . . . . . . . . . . . . . . . . . . . . . . . . . . . . . . . . . . . . . . . . . . .
28
Q
Mahalanobis distance . . . . . . . . . . . . . . . . . . . . . . . . . . . . . . . . . . . . . . . . . .
67
R
correlation . . . . . . . . . . . . . . . . . . . . . . . . . . . . . . . . . . . . . . . . . . . . . . . . . . . .
23
r
Euclidean distance . . . . . . . . . . . . . . . . . . . . . . . . . . . . . . . . . . . . . . . . . . . .
20
ψ
spherical distance . . . . . . . . . . . . . . . . . . . . . . . . . . . . . . . . . . . . . . . . . . . . .
28
s
spatial position . . . . . . . . . . . . . . . . . . . . . . . . . . . . . . . . . . . . . . . . . . . . . . . .
19
T
anomalous potential of the Earth . . . . . . . . . . . . . . . . . . . . . . . . . . . . . . . .
28
σl
degree variance . . . . . . . . . . . . . . . . . . . . . . . . . . . . . . . . . . . . . . . . . . . . . . .
28
Σ
spatial kernel . . . . . . . . . . . . . . . . . . . . . . . . . . . . . . . . . . . . . . . . . . . . . . . . .
67
ζ
quasigeoid/hight anomaly . . . . . . . . . . . . . . . . . . . . . . . . . . . . . . . . . . . . . .
96
γ
variogram . . . . . . . . . . . . . . . . . . . . . . . . . . . . . . . . . . . . . . . . . . . . . . . . . . . .
21
1
1. INTRODUCTION
This thesis investigates the new �eld of what is herein termed non-stationary LSC, which is speci�cally concerned with non-stationarity in the theory of least-squares collocation for regional gravity �eld modelling. In practice, many geodesists still rely on stationary assumptions in LSC using a constant mean and covariance for estimation and prediction of gravity quantities like gravity anomalies or geoid heights (e.g., Knudsen, 1991a; Andersen et al., 1996; Ba� si´ c et al., 1999) [and many others]. However, the introduction of new theories in spatial statistics (e.g., Higdon et al., 1999; Fuentes and Smith, 2001; Nott and Dunsmuir, 2002; Paciorek and Schervish, 2006) now allow for more accurate statistical methodologies to be used in geodesy. The aim of this thesis is to bring these methodologies to geodesy and adapt them for dealing with non-stationarity in LSC theory. An overview of contributions to the �eld of LSC and the solution strategies chosen in this research are presented in this introductory chapter.
1.1
Historical overview of LSC
The prediction of spatially and/or temporally varying variates based on observations of these variates at some discrete locations in space and/or instances in time is an important topic in the various spatial and Earth science disciplines. This topic has been extensively studied, albeit under different names. In physical geodesy, it is known as least-squares collocation (LSC) (e.g., Teunissen, 2007b).
The method of LSC was introduced to geodesy by Moritz (1980a) for gravity anomaly interpolation, though it was the valuable pioneering work of Krarup (1969) that provided the foundation for the application of the general collocation model to physical geodesy. Krarup (1969) created the adjustment model able to determine positions and the gravity potential and its functionals in one step using all available observations. Eeg and Krarup (1973) intro-
2
duced the philosophy of integrated geodesy to use geodetic data and take advantage of other observation types (geometrical, physical and even geophysical data) and interaction between them for solving geodetic problems (Hein, 1986).
According to Raymond et al. (1978): Generally, classical geodesy is concerned with estimating a single quantity (e.g., de�ection components) from a single sensor (e.g., gravimeter) based on static measurements when the solution is neither under-determined nor overdetermined. Statistical geodesy provides methods for estimating many outputs from many inputs. The measurements are often taken in a dynamic environment (e.g., moving-base gravity gradiometry). Results can be generated with either partial sets of data (under-determined estimation) or redundant sets of data (over-determined estimation). Minimum variance estimation is the primary method used to generate these results. This method can be implemented in four ways: in the time domain (Kalman �lter, e.g., Brown and Hwang (1997)), space domain (LSC), frequency (inverse-time) domain (Wiener (1949) �lter), and frequency (inverse-space) domain (frequency-domain LSC, e.g., Eren (1980)) .
The method of LSC represents one of the major theoretical and practical foundations of � 1986; Tsaoussi, 1989; Kotsakis, modern physical geodesy (e.g., Tscherning, 1986; Sanso, 2000a) because
•
It solves the �eld equation determined by the physics of the phenomena (Laplaceequation for gravity and magnetic potential �elds of the Earth);
•
It provides the best linear unbiased estimation (BLUE) of the predicted signal (and parameters, when applicable);
•
Heterogeneous data types and noisy data can be handled, and heterogeneous signals can be predicted, provided all the necessary covariance functions are known;
•
In cases of data gaps, the prediction re�ects the corresponding covariance functions from nearby data;
•
The method provides precision measures of the estimated quantities.
3
The introduction of the GRAVSOFT package of FORTRAN77 programs by Tscherning et al. (1994) was a turning point in LSC application and adoption. GRAVSOFT has been updated regularly since 1994. It includes programs for the determination of empirical covariance function (EMPCOV), its analytical modelling (COVFIT), geoid determination using LSC, the computation of an approximation to the anomalous potential of the Earth using stepwise LSC (GEOCOL), the evaluation of spherical harmonic series, datum transformations and planar LSC. This package has been used around the world for different applications of LSC in geodesy and compared with other estimation techniques like the fast Fourier transform ¨ (FFT) and numerical integration (e.g., Sunkel, 1984; de Min, 1995; Abd-Elmotaal, 1998; Forsberg, 2003; Drewes and Heidbach, 2005; Zhu, 2007; Jekeli et al., 2007), and proved the ef�ciency of LSC in geoscience for estimation and prediction in local and global scales. Some examples are:
•
Geodetic datum transformation: LSC has been used for distortion modelling of different datum transformation projects (e.g., Collier et al., 1998; Zhang and Featherstone, 2004; Kwon et al., 2005; You and Hwang, 2006).
•
The interpolation, gridding, �ltering and statistical analysis of huge data sets, both ground-based (e.g., Forsberg and Tscherning, 1981; Fujii and Xia, 1993; El-Fiky et al., 1997; de Sa et al., 1993; Hirt and Flury, 2008) and satellite-based for altimetry (e.g., Tziavos et al., 2005) and gradiometry (e.g., Tscherning, 2005)
•
The computation of spherical harmonic expansions of the Earth's external gravity �eld (e.g., Kenyon and Pavlis, 1997; Kenyon, 1998; Tscherning, 2001). For this purpose, a globally distributed set of data is needed. The optimal use of LSC requires that systems of equations with as many unknowns as observations are solved. The method of Fast � and Tscherning (2002) and Sanso � Spherical Collocation, (FSC), introduced by Sanso and Tscherning (2003) bypasses this problem. However, data gridded equidistantly in longitude and at a distance from the origin which is constant for each parallel, must be used. The method has been used by Arabelos and Tscherning (2003) for computation of a geopotential model from simulated Gravity Field and Steady-State Ocean Circulation Explorer (GOCE) data. Howe (2006) estimated spherical harmonic coef�cients using FSC for Challenging Mini-satellite Payload (CHAMP) data by implementing
4
the energy conservation method.
•
Geoid determination: LSC, with its unique capability of combining different functionals of the gravity �eld, both ground and satellite-based, has been used for many geoid determination projects around the world over local and regional scales: (e.g., Ning, 1984; Tscherning, 1985; Knudsen, 1991b; Sevilla et al., 1991; Lyszkowicz, 1991; Forsberg, 1991; Burki and Marti, 1991; Benciolini et al., 1991; Fukuda and Segawa, � 1991; Coli´ c et al., 1993; Gil et al., 1993; Rodriguez-Caderot et al., 1993; Hanafy and ´ am et al., 1995; Duquenne et al., 1995; Tsuei Tokhey, 1993, 1995; Marti, 1995; Ad´ et al., 1995; Li and Sideris, 1997; P aquet et al., 1997; Adjaout and Sarrailh, 1997; Daho and Kahlouche, 1998; Catalao and Sevilla, 1998; Heliani et al., 2003; Bl´ azquez ¨ et al., 2003; Barzaghi et al., 2003; Kuhtreiber and Abd-Elmotaal, 2007; Maggi et al., 2007; Marti, 2007).
•
Re�ne local gravimetric geoids: LSC has been used to combine a gravimetric geoid and a set of levelled GPS points in order to derive a height reference surface suitable for levelling by GPS (e.g., Milbert, 1995; Denker et al., 2000; Featherstone, 1998, 2000; Soltanpour et al., 2006; Yang et al., 2008). There is a great deal of research being undertaken in �tting the gravimetric geoid to the geometric geoid using LSC with various data sets from different countries: Fukuda et al. (1997) and Kuroishi et al. (2002) for Japan, Smith and Milbert (1999) for the USA, Forsberg et al. (2003) for Britain, Nahavandchi and Soltanpour (2006) for Norway, and Featherstone and Sproule (2006) for Australia, are part of the long list of LSC applications in this area.
•
Downward continuation problem of physical geodesy: Many studies have proven the superiority of LSC over integral solutions for downward continuation problems dealing with the inversion of airborne gravity data (e.g., Tscherning and Forsberg, 1992; Tscherning et al., 1998; Marchenko et al., 2002; Alberts et al., 2007). The advantage of LSC in downward continuation of gravity disturbances at �ight level to the disturbing potential at ground level is that it can be used directly for the processing of discrete data. It also allows a combination of different types of gravity data obtained at �ight altitude and on the ground (e.g., Alberts and Klees, 2004; Forsberg et al., 2007). One of the early examples of this application are the airborne gravity program of Greenland (Brozena, 1992), and using torsion balance point gravity gradients to model geoid
5
´ heights in Hungary (Toth et al., 2002). Currently, several simulated studies have been undertaken for the upward continuation of ground data for GOCE calibration purposes ¨ (e.g., Muller et al., 2003; Wolf and Denker, 2005) by LSC, and the downward continuation of gravity anomalies to the surface of the Earth from gravity gradients at the satellite altitude (more than 200 km) which will be soon provided by GOCE satellite gradiometry (e.g., Robbins, 1985; Jekeli, 1989; Arabelos and Tscherning, 1990, 1995, 1998; Bouman and Koop, 2003; Arabelos and Papaparaskevas, 2003; Albertella et al., ´ 2004; Tscherning, 2005; Tschernig and Arabelos, 2005; Toth et al., 2005; Bouman et al., 2005; Knudsen et al., 2007; Knudsen and Tscherning, 2007; Arabelos et al., ´ ¨ ¨ 2007; Migliaccio et al., 2007; Toth and Volgyesi, 2007; Wolf and Muller, 2008),
•
Satellite radar altimetry: The use of LSC for the combination of altimeter data from different missions has the advantage that it can use all the available data with their varying resolutions (e.g., Knudsen, 1991a; Arabelos et al., 1995; Hwang and Parsons, 1995, 1996; Knudsen and Andersen, 1997, 1998; Kahlouche et al., 1998; Andersen and Knudsen, 1998; Arabelos, 1998; Arabelos and Tziavos, 1998; Vergos and Sideris, 2002; Amos et al., 2005). Geoid heights obtained by the combination of data from different altimeter missions could be further combined with shipborne gravity anomalies to improve the accuracies of geoid height and gravity anomaly predictions (e.g., Tziavos et al., 1997; Vergos et al., 2005b,a). Also, LSC was used for draping altimeter data onto land data by Strykowski and Forsberg (1998); LeQuentrec-Lalancette and Rouxel (2003) and onto ship data by Kirby and Forsberg (1998).
1.2
Limitations of, and improvements to, LSC
Practical applications of LSC are often limited due to the intensive computations required. Most of the effort is spent in formulating and inverting the covariance matrix of the observations, which makes the method prohibitive to use in applications where a very large number of measurements are involved. In order to work around this problem, studies have been made in various cases to identify special properties of the covariance functions and the underlying process. For instance, Iliffe et al. (2003) �ltered gravity data to get smaller matrix sizes. LSC
6
with patterned matrices (e.g. Toeplitz matrices suggested by Tsaoussi (1989) and Barzaghi and Bottoni (1991)) consume less computational time for the formation or inversion of covariance matrices.
Moritz's (1980) suggestion was to split the estimation by LSC into two steps, which is called stepwise LSC. This may be done to reduce the size of matrices to be inverted.
Another
application is the use of additional observations to improve the original estimates. Stepwise LSC has been applied in the GRAVSOFT package (Tscherning et al., 1994). Reguzzoni and Tselfes (2008) introduced an iterative multi-step LSC which will be used for the GOCE mission data processing.
Some authors tried to rewrite LSC in the frequency domain to make LSC computations more ef�cient (Eren, 1980; Bottoni and Barzaghi, 1993). Another advantage of Fourier domain LSC is the possibility to estimate the power spectrum, and to interpret geophysical features in the frequency domain more easily (Schwarz, 1984; Schwarz et al., 1990; Knudsen, 1987; Flury, 2006).
More recently, Moreaux (2007) introduced compactly supported radial covariance functions, which yield sparse covariance matrices. Having many zero entries in the covariance matrices can both greatly reduce computer storage requirements and the number of �oating point operations needed for the inversion.
In addition to the above limitations, which are more numerical recipes for LSC, the paradox of stationarity assumption in LSC and the non-stationary nature of the gravity �eld in some regions has challenged LSC application in geodesy (e.g., Goad et al., 1984; Darbeheshti and Featherstone, 2008).
1.3
Non-stationarity assumption in LSC
The standard LSC approach allows one to �exibly estimate a smooth spatial �eld, with no pre-speci�ed parametric form, but it has several drawbacks.
7
•
The �rst is that the true covariance structure may not be stationary. For example, if one is modelling a geodetic variable across a continent, the �eld is likely to be much more smooth in the topographically smooth great plains than in the mountains. This manifests as different covariance structures in those two regions; that is the covariance structure changes with location (cf. Flury, 2006). Assuming a stationary covariance structure will result in oversmoothing the �eld in the mountains and undersmoothing the �eld in the great plains.
•
A second drawback is that the usual LSC analysis does not account for the uncertainty in the spatial covariance structure, since �xed hyperparameters (variance and correlation length) are often used (cf. Chapter 3).
•
A �nal drawback is that an ad hoc approach (�tting empirical covariances to covariance models) to estimating the covariance structure may not give reliable estimates (Paciorek, 2003).
Ever since the introduction of LSC to geodesy, 2D stationarity and 3D isotropy have been � routinely assumed (e.g., Tscherning and Rapp, 1974; Tscherning, 1991a, 1996, 2004; Sanso and Venuti, 2004; Reguzzoni and Venuti, 2004). Stationarity in this context means that the mean is constant and the covariance is position invariant, which is called weak or secondorder stationarity in the discipline of spatial statistics (e.g., Armstrong, 1998).
Isotropy
means that the spatial dependence is independent of direction (or azimuth).
There have been very few and only approximate attempts in mathematical geodesy to consider anisotropy (azimuth-dependent covariances) and non-stationarity.
•
Rummel and Schwarz (1977) were the �rst to attempt to use non-homogeneous global covariance functions for interpolation by LSC.
•
Kearsley (1977) and Duquenne et al. (2005) are the only examples in geodesy that used the anisotropic covariance models from geostatistics.
•
In Tscherning (1991b), an approach is proposed based on (mass) density anomaly considerations (Hauck and Lelgemann, 1985), but it was not pursued due to the limited capability of computers at the beginning of the 1990's.
8
•
Another possibility was suggested in Tscherning (1999) using Riesz-representers, but was not practically applicable because of the lack of an adequate numerical algorithm.
•
Tornatore and Migliaccio (1998) proposed a method to model the covariance function of a slowly varying non-process process by subdivision of non-stationary process to stationary zones with two parameters slowly changing from one stationary zone to another.
•
Knudsen (2005) introduced an approximation to the covariance function that allows spatial variations in both magnitude and in spectral characteristics. It could solve the problems when altimetry data is used over large areas, where in order to handle the data volume for LSC, subdivision of the region into smaller areas was done.
•
Recently, two different approaches to solve non-stationary LSC have been proposed, with two fundamentally different mathematical/physical concepts. However, because of the complication of these approaches, they have never been applied in practice:
One is a wavelet application in stochastic LSC by Keller (1998b, 2000, 2002, 2004). Keller's method is a replacement of the Fourier transform by the wavelet transform in the LSC computation process. The second is the wavelet frame of deterministic LSC by Kotsakis and Sideris (1999), Kotsakis (2000b) and Kotsakis (2000a). Kotsakis's work concentrates on totally new wavelet frames for LSC.
•
Kotsakis (2007) suggested applying a posteriori correction to overcome the smoothing effect of LSC which comes from the inability of covariance functions to represent spatial variability of spatial random �eld (SRF).
•
Darbeheshti and Featherstone (2008) introduced the kernel convolution method from spatial statistics for non-stationary covariance structures, and demonstrated its advantage for dealing with non-stationarity in interpolating residual gravity anomaly data.
Adapting the kernel convolution method for non-stationary covariances in broader geodetic applications is the focus of this thesis, as well as the original work presented in Darbeheshti and Featherstone (2008).
9
1.4
Main research objectives
Even though several theoretical contributions to non-stationary LSC have been made (see Chapter 4), the practical application of non-stationary LSC remains limited. This can, at least partly, be prescribed to the complicated nature of the formulas involved.
The principal aim of this research is to establish and implement a modi�ed LSC framework to overcome anisotropy and heterogeneity (non-stationarity) problems in gravity �eld modelling. The speci�c objectives are
a) Identify how valid or invalid the existing LSC assumptions of stationarity are;
b) Design optimal expressions for local covariance functions that vary continuously over local areas;
c) Empirically evaluate how the new localised covariance functions improve LSC results to predict gravity �eld quantities.
1.5
Thesis structure
This thesis is organised in the following fashion. In Chapter 2, the mathematical theories that form the foundation of LSC are presented, where speci�c attention is given to the formulas relevant to the methodologies derived in the remainder of the thesis.
Chapter 3 details of the concept of covariance function and stationarity from spatial statistics. It starts with the concept of covariances in spatial statistics, empirical covariances, covariance modelling and covariance propagation, and then reviews the historical invalidation of the stationarity assumption for covariance functions in gravity �eld modelling, and �nally discusses how this inaccurate assumption may affect LSC results.
Chapter 4 covers the substantial literature on non-stationary approaches to best linear unbiased estimation (BLUE) problems. They are classi�ed in the three categories from which
10
they come: geodesy, geostatistics and spatial statistics. The weakness of each method is discussed in the context of LSC in geodesy and �nally the kernel convolution models of Higdon et al. (1999), which is used as the foundation in this work, is reviewed. Kernel convolution provides a continuous way of non-stationary covariance function modelling and it avoids the need for patching at the borders between regions.
Chapter 5 describes the approach of Higdon et al. (1999) for de�ning non-stationary covariance functions. The implementation of this method for LSC in physical geodesy is described. Speci�cally, applying stationary and non-stationary covariances for one point included to make it feasible to compare the performance of covariances in more detail in LSC.
Numerical validation of non-stationary LSC for real cases has been analysed in chapter 6 with two key examples.
•
Stationary and non-stationary covariance functions in 2D LSC are compared to the empirical example of residual gravity anomaly interpolation near the Darling Fault, Western Australia, where the �eld is anisotropic and highly non-stationary.
•
Non-stationarity of both the mean and covariance have been applied to the problem of optimising the gravimetric quasigeoid to the geometric quasigeoid (from GPSlevelling) by planar LSC in the Perth region.
Finally, Chapter 7 provides a summary of the overall results and an itemised overview of the main conclusions. In addition, an outlook on possible future research is presented.
2. BACKGROUND THEORY OF LSC IN PHYSICAL GEODESY
This chapter will introduce theory of LSC in physical geodesy, essentially a brief overview of the comprehensive text by Moritz (1980a). It explains how zero mean assumption in LSC theory enforces stationarity of the mean. A review of some of the Best Linear Unbiased Estimation (BLUE) methods from different �elds of spatial statistics is given. Most focus is put on Kriging in geostatistics, mainly because both LSC and Kriging belong to the geoscience discipline, and there has been a historical comparison in geodesy literature between LSC and Kriging (e.g., Blais, 1982; Dermanis, 1984). The similarities and differences between LSC and Kriging will be presented.
2.1
Background to LSC
The spatial random �eld (SRF) scheme and its descriptors, the variogram and covariogram (Chapter 3), provide a stochastic framework that can describe the accuracy of spatial data. However, it lacks the functionality needed, namely the ability to
•
Account for systematic effects in the data (trend);
•
Predict the random �eld between data points (interpolation);
•
Estimate the random �eld at the data points (�ltering).
The scheme successfully implemented for physical geodesy purposes and responded to all of above problems is LSC, which has found reasonably wide application in geodesy, as mentioned in Section 1.1. The generalised model of LSC is
l
= Ax + y + n
(2.1)
12
where l is the vector of observations, A is the design matrix of trend parameters with full column rank, x is the vector of unknown trend parameters, y is the signal vector and n is the error vector of observations.
The BLUE solution of Eq. (2.1) is obtained by (Moritz, 1980a)
ˆ x
= (AT (Cll + Cnn )−1 A)−1 AT (Cll + Cnn )−1 l
(2.2)
ˆ y
= Cyl (Cll + Cnn )−1 (l − Axˆ)
(2.3)
ˆ n
= Cnn (Cll + Cnn )−1 (l − Axˆ)
(2.4)
where ˆ refers to the estimated quantity, Cnn is the variance-covariance matrix of the noise (a diagonal matrix), Cll is the auto-covariance matrix of the vector l and Cyl is the crosscovariance matrix between l and y.
The error covariance matrix for the prediction of the signal y is:
Ce
= Cyy − Cyl C−1 ll Cly
(2.5)
It is assumed that each of these quantities has an expected value equal to zero:
E{l} = 0,
the expectation
E{y} = 0
E{.} being the average or mean value in the sense of probably theory.
(2.6)
Quan-
tities having mean value zero, such as Eq. (2.6) are called centered (Moritz, 1980a). With zero mean assumption of observation vector of l, LSC assumes stationarity of mean.
13
Chapter 3 explains how to de�ne the elements of auto and cross-covariances, and how the standard procedure of LSC enforces stationarity through the processes of building covariance matrices.
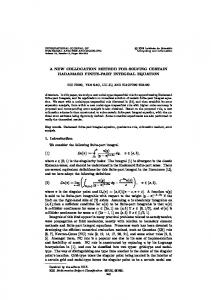
Hence, the general model of LSC combines least-squares adjustment (the determination of the parameter x, e.g., there is a comparison between two-component adjustment and LSC � ek and Krakiwsky (1986) with a diagrammatic apin Mohammad-Karim (1981) and Van´�c proach), �ltering (the removal of the noise, e.g., Rummel (1976)), and prediction (the computations of y at points other than the measurement points) (see Figure 2.1).
Figure 2.1: Interpretation of the general model of LSC, l: observation, n: observation error, AX: systematic part of the phenomenon, s: random part of the phenomenon and y: signal to be predicted at observation points (from Moritz (1980a)).
In LSC, one predicts signals from observed data that are not necessarily of the same type as the signal predicted. For this, auto-covariances of Cll and cross-covariances of Cyl are needed (e.g., Kearsley, 1977). In the local context, the model effects are generally removed by adopting parameters deduced from a global model. The problem then reduces to a multivariate prediction, where the task is to predict one potential-related parameter from another.
As can be seen from Eq. (2.3), the prediction is a function of both the auto-covariances Cll of the observed quantities, and the cross-covariances Cyl of the observed quantity with the predicted quantity. The solution will always be obtained if Cyl and Cll comply with the basic
14
rules of a covariance function (Blais, 1984).
In geodesy, both of these quantities are derived from the anomalous potential (T ), and their covariance functions are thus indirectly related. A number of models have been suggested as suitable for representing the auto- and cross-covariance functions, both on global and local scales (Section 3.4). However, stationarity of the potential �eld and hence the SRF is always assumed.
LSC, in applied mathematics terminology, is called the determination of a function by �tting an analytical approximation to a set of given linear functionals (Moritz, 1980a). This de�nition is consistent with two aspects of LSC: the prediction aspect where discrete values of the function are predicted, and �nding the continuous function as an entity. In other words, there is a �nite and an in�nite dimensional aspect of LSC (Krarup, 1969), which are both applicable in physical geodesy. The �rst one is when a certain number of values of linear functionals of the gravity �eld are predicted at discrete points, and the second one is when the gravity potential is determined as a function in space (Tsaoussi, 1989).
Furthermore, Bjerhammar (1964) presented the idea of approximating the potential at points where gravity anomalies are measured, using LSC and a set of potentials that are regular down to a sphere embedded within the Earth (the Bjerhammar sphere). It was the valuable work of Krarup (1969) that provided the formulation for the application of the LSC model to physical geodesy. His studies originated from the instability suspected in the Molodenskij et al. (1962) boundary-value problem (BVP). Also, the reality of �nite measurements gave the motivation to look at the determination of the gravity �eld as a problem of interpolation, or approximation.
Along these lines, it is natural to formulate the BVP as an adjustment problem (cf. Koch, 1977), where an improvement of the boundary values, made minimum in some least-squares sense, would provide a unique solution. Krarup (1969) generalised Moritz (1962)'s interpolation formulation to �nd the potential directly, instead of using the predicted gravity anomalies in Stokes's formula. In addition, his generalisation included other types of gravity �eld functionals, including those derived from satellite gravity missions and de�ections of the vertical, as well as treatment of data error, in what he called a smoothing procedure (Tsaoussi,
15
1989).
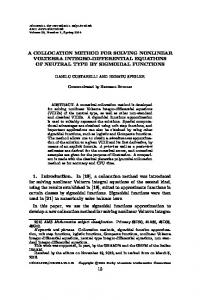
The LSC procedure has two steps: (step 1) structural analysis; and (step 2) estimation (Figure 2.2).
Figure 2.2: Diagram of the LSC procedure (from Herzfeld (1992))
•
In the �rst step, the measure of spatial continuity is determined from the data, by �rst calculating an experimental (empirical) covariance function and then modelling with an analytical function.
This is called variography in geostatistics (e.g., Chil� es and
Del�ner, 1999; Wackernagel, 2003), where most effort is put to knowing the statistical characteristics of the data to reach the optimum model for covariances, which is used for the next step.
•
In the second step, a linear estimator is used, and the optimal weights are found by using information from the function of spatial continuity (Herzfeld, 1992).
The focus of this thesis is on the �rst step. In the next chapter, the statistical concept of the covariance function, and local and global covariance models are reviewed, and it will be explained how the choice of covariance functions affects the LSC result.
2.2
LSC versus Kriging
Ever since the conception of LSC in geodesy, there have been comparisons with Kriging in geostatistics (e.g., Blais, 1982; Dermanis, 1984; Menz and Bian, 2000; Schaffrin and Felus, 2005). The technique of Kriging is named after Danie G. Krige, a South African mining
16
engineer (Krige, 1951). Krige's empirical work to evaluate mineral resources was formalised in the 1960s by the French engineer Georges Matheron (Matheron, 1962, 1963).
A central problem in geostatistics is the reconstruction of a phenomenon over a domain on the basis of values at a limited number of points. Mathematically, this can be regarded as an interpolation problem. The main difference between an interpolation method and Kriging is that Kriging starts from a statistical model of nature, rather than a model of the interpolation function (e.g., Chil� es and Del�ner, 1999).
At the same time as geostatistics was developing in mining engineering under Matheron (Matheron, 1962, 1963), the very same ideas were developed in meteorology under Gandin (1963) in the Soviet Union. Gandin's name for his approach was objective analysis, and he used the term optimum interpolation instead of Kriging (Cressie, 1993). Closely related to Kriging theory in geostatistics, LSC has evolved into a powerful BLUE solution for either global or local gravity �eld modelling and has been shown to have wider applications both inside and outside physical geodesy (Section 1.1).
Table 2.1 compares other BLUE methods: simple Kriging (SK), ordinary Kriging (OK) and universal Kriging (UK) with LSC. The common basic concept is the notion of spatial continuity, speci�c to the area and the phenomenon studied, which is modelled in geostatistics by the variogram, and in geodesy by the covariance function. In fact, geostatistical estimation often uses the covariance function for reasons of numerical conditioning of computer programs.
Table 2.1: Synopsis of BLUE methods LSC
Simple Kriging (SK)
Ordinary Kriging (OK)
Universal Kriging (UK)
stationary assumption
stationary
intrinsic
intrinsic
intrinsic
isotropy assumption
isotropic
not necessary
not necessary
not necessary
expected value (µ)
zero
known
constant
varying
unbiasedness condition
none
yes
yes
yes
spatial continuity measure
covariance function
variogram or
variogram or
variogram or
covariance function
covariance function
covariance function
17
In BLUE models, the kind of expected value (µ) used necessitates an unbiasedness condition. LSC turns out to be the same as simple Kriging (SK) in the stationary case if the covariance function is used, and the expectation is known to be zero. The zero expectation assumption in global magnetic and gravity anomaly estimation includes these conditions. This seems reasonable only at �rst glance, however.
Since anomalies only have zero expectation if
viewed globally, this sometimes induces a bias in an estimation of a subarea (e.g., Tscherning et al., 1994).
Reguzzoni et al. (2005) introduced the theory of general Kriging (GK) to overcome the problem of non-zero mean in the local application of LSC in geodesy. The solutions for the non-zero mean situation in geodesy under the more general subject of non-stationary of the mean will be discussed in Chapter 4.
Kriging is used to `guess' the value of an unknown deterministic parameter vector y based on an observable random vector l. If the function is given as f, then l is said to be the BLUE solution of y (it is called an estimate of y if the function is taken to be an outcome of l). Examples of gridding and interpolation with LSC are the same as Kriging for a BLUE solution (Schaffrin, 1986, 1989; Yang, 1992). LSC is a more general domain than Kriging and applies the law of covariance propagation to `guess' the outcome of another random, but unobservable vector, from an observable random vector of l, which is called the best linear unbiased prediction (BLUP) by Teunissen (2007a,b, 2008). Applications of LSC for prediction of the geoid from gravity anomalies or downward continuation of height anomalies which transfer height gradients to gravity anomalies belong to the BLUP solution.
This difference is the outcome of different applications of LSC in geodesy and Kriging in geostatistics.
In geostatistics, there is no physical relation between different mineral re-
sources, thus the focus is just on spatial statistical information of data. In geodesy, LSC can make use of both the physical formulation between different functionals of the gravity �eld through the law of covariance propagation and statistical characteristics of the data by covariance functions.
A signi�cant difference between the estimation of the Earth's gravity �eld and most other spatial estimations (like Kriging methods) is that due to the size of the mapped area, planar
18
representations are not suf�cient and most estimations are performed on a sphere (or ellipsoid (Claessens, 2006)) approximating the Earth. It is assumed that the anomalous potential of the Earth (T ) is on average zero globally and harmonic outside the Earth's surface. A solution has to satisfy the Laplace equation, so it must be harmonic. The Bjerhammar sphere (Moritz, 1980a; Tscherning and Rapp, 1974) is introduced as the sphere bounding the set of harmonicity for the approximation of
T:
all harmonic solutions are in a set (the set of har-
monicity) that lies outside a sphere totally containing the Earth.
T
is not an element of the
harmonicity set, but can be approximated by elements of this set (for details on convergence of the approximation to
T , see Sanso� and Tscherning (1980) and Jekeli (1982)).
Taking the
residual between the Bjerhammar sphere and the topographic relief of the Earth can be compared to the drift (trend) estimation in universal Kriging, in as far as both concepts respond to physical properties of the area for which the estimation is carried out, but the mathematical formalism is different (Herzfeld, 1992).
2.3
Summary
In this chapter, the theory of LSC in geodesy was outlined. Speci�cally, it was explained how LSC is different with various Kriging systems in terms of mean assumption of observation. LSC assumes the observation vector has zero mean which automatically causes the stationarity assumption of the mean.
Through comparing LSC with Kriging in geostatistics, the superior capabilities of LSC over Kriging are also identi�ed:
•
LSC has the ability to deal with different functionals of the gravity �eld, while Kriging methods just deal with one functional.
•
LSC has been applied to both local and global scales, while Kriging is implemented on local scales, not more than
∼ 100 km.
19
3. STRUCTURAL ANALYSIS OF SPATIAL DATA
The theory of LSC combines the classical �elds of physical, mathematical and statistical geodesy, realising that it is important to identify statistical assumptions behind the LSC theory and determine which are valid for any application in gravity �eld modelling.
Chapter 2 outlined that the basis of any BLUE solution is structural analysis. In the case of LSC, it includes the estimation of an empirical covariance function and the �tting of a covariance model to empirical covariances to �nd covariance parameters. This chapter starts with the statistical concept of covariances and covariance models, and then it represents the law of covariance propagation, which makes covariance modelling different between geodesy (for LSC) and geostatistics (for Kriging).
After that, it explains the concept of
anisotropy and non-stationarity in structural analysis, followed by an example of free air gravity anomalies in Australia. Finally, the question of why non-stationarity is important in LSC is answered, or in other words, how and to what extent it may affect the result of prediction.
3.1
Describing the spatial behaviour of a spatial random �eld (SRF)
Assume that we have a data-set consisting of a series of vector locations s and a set of measurements
z(s) taken at these locations.
To begin a spatial analysis, the starting assump-
tion is usually that the spatial process of interest is a realisation of some random process
Z(s) : s ∈ D where D is a subset of d-dimensional space (Cressie, 1993).
A random process
can be de�ned as a process that satis�es
Fs1 ,··· ,sm (z1 , · · · , zm ) = P (Z(s1 ) ≤ z1 , · · · , Z(sm ) ≤ zm ) where
P
is the probability and
F
(3.1)
is the joint distribution function of the random process
Z.
20
In statistics, it is common to assume that the variable is stationary, i.e., its distribution is invariant under translation. In the same way, a stationary random function is homogeneous and self-repeating in space. For any increment is the same as that of
r, the distribution of Z(s1 ), Z(s2 ), . . . Z(sk )
Z(s1 + r), Z(s2 + r), . . . Z(sk + r).
This makes statistical inference
possible from a single realisation of Z(s). In its strictest sense (strict stationarity), stationarity requires all the moments to be invariant under translation, so that we have
F (Z(s1 ) ≤ z1 , Z(s2 ) ≤ z2 , · · · , Z(sn ) ≤ zn ) = F (Z(s1 + r) ≤ z1 , Z(s2 + r) ≤ z2 , · · · , Z(sn + r) ≤ zn )
(3.2)
Since Eq. (3.2) cannot be veri�ed from a limited discrete data set, we usually require only the �rst two moments (the mean and the covariance) to be constant. This is called weak or second stationarity. In other words, �rstly, the expected value (or mean) must be constant for all points s. That is,
E[Z(s)] = µ
where
E
and (s
+ r) depends on the vector r but not on the point s.
(3.3)
is the expected value. Secondly, the covariance function between any two points s That is,
E[Z(s)Z(s + r)] − µ2 = C(r)
(3.4)
There is no need to make an assumption about the variance because it turns out to be equal to the covariance for a zero distance,
C(0) (Cressie, 1993).
Here, we shall only consider cases where the mean is constant.
Even when this is true,
the covariance need not exist. On both theoretical and practical grounds, it is convenient to be able to weaken this hypothesis. This is why Matheron (1963) developed the intrinsic hypothesis. It assumes that the increments of the function are weakly stationary: that is, the mean and variance (V
ar) of the increments (Z(s + r) − Z(s)) exist and are independent of
the point s:
E[Z(s + r) − Z(s)] = 0
(3.5)
21
V ar[Z(s + r) − Z(r)] = 2γ(s)
(3.6)
This means that the variance of the difference between any two points si and sj is determined by
γ,
which is a function that depends only on the vector separating si and sj (Cressie,
1993). The function
γ(r)
is called the semi-variogram (variogram for short). Examples of
variograms are shown later in Figures 3.2 and 3.3. Note that, by de�nition, the variogram must be zero when
r
is zero. However, due to small-scale variations, it is possible for there
to be a discontinuity at the origin, such that
γ(r) −→ c as r −→ 0.
In this case,
c is called
the nugget effect by Matheron (1962). This effect is often attributable to measurement error.
In the case of weak stationarity, there is an equivalence between the variogram and covariance. The variogram can be written
2γ(r) = C(0) − C(r)
(3.7)
Cressie (1993) prefers using the terminology of covariogram instead of covariance function, which has been used by time-series analysts (e.g., Box and Jenkins, 1976).
3.2
Empirical covariance functions
The covariance between data values separated by a vector follows:
r
is computed empirically as
N (r) 1 X Z(sα ).Z(sα + r) − m−r .m+r C(r) = N (r) α=1
with
m−r
m+r
N (r) 1 X = Z(sα ) N (r) α=1
N (r) 1 X = Z(sα + r) N (r) α=1
(3.8)
(3.9)
(3.10)
22
where and
N (r) is the number of data pairs within the class of distance and direction, and m−r
m+r
are the means of the corresponding tail and head values (lag means).
variance can be computed for different lags
C(r1 ), C(r2 ), ...
r1 , r2 , ...
The co-
and the ordered set of covariances
is called the experimental auto-covariance function, or simply, the exper-
imental or empirical covariance function (Goovaerts, 1997).
Unlike the covariance functions, which are a measure of similarity, the experimental semivariogram
γ(r)
measures the average dissimilarities between data separated by a vector
r.
It is computed as half the average squared difference between the components of every data pair:
N (r) 1 X [Z(sα ) − Z(sα + r)]2 γ(r) = 2N (r) α=1 where
3.3
(3.11)
[Z(sα ) − Z(sα + r)] is an r-increment of attribute Z .
Covariance models
A Gaussian process is a stochastic process whose �nite dimensional distributions are multivariate normal for every
n and every collection {Z(s1 ), Z(s2 ), · · · , Z(sn )}.
Gaussian pro-
cesses are speci�ed by their mean and covariance functions, and multivariate Gaussian distributions are speci�ed by their mean vector and covariance matrix. Just as a covariance matrix must be positive-de�nite, a covariance function must be positive-de�nite (Moritz, 1980a); for a covariance function to be positive-de�nite, it must satisfy
n X n X
ai aj C(si , sj ) > 0
(3.12)
i=1 j=1
for every
n; every collection {s1 , s2 , · · · , sn }, and every vector a.
This condition ensures that
every linear combination of random variables in the collection will have a positive variance (remember that, by de�nition, variance is a positive value).
Ensuring positive-de�niteness involves ensuring the positive de�niteness of the correlation function,
R(., .), de�ned by
23
R(si , sj ) =
where
C0 (si ) = C(si , si )
C(si , sj ) 1/2 1/2 C0 (si )C0 (sj )
(3.13)
is the variance function (please note, correlation functions are
called correlograms by Deutsch and Journel (1998)).
In a situation where isotropy can be stipulated, the Mat´ ern (1986) class provides the form for a commonly used set of valid covariograms that can be written as functions of scaling parameter, and
n,
θ1 , a positive
a positive parameter that controls the smoothness of the process.
This is
1 CM at (si , sj ) = C0 n−1 2 Γ(n) where rij is distance between si and sj ,
Ã
rij
!n
θ√1 2 n
à Kn
rij
!
θ√1 2 n
(3.14)
Kn is the modi�ed Bessel function of the second kind,
whose order is the differentiability parameter,
n and Γ is the Gamma function (Hancock and
Stein, 1993). This is quite a large class of isotropic models; the more commonly used ones in geostatistics and geodesy come from the subclass
Ã
b rij C(si , sj ) = C0 exp − a
where of
Z
a > 0 and 0 < b ≤ 2 (Wackernagel, 2003).
is given by
C0 ;
! (3.15)
The marginal variance of each realisation
note that the marginal variance must be the same for each location s
because of the stationary assumption of covariances.
Many variations of Eq. (3.15) exist and are commonly used. A list of covariance models frequently used in the geostatistics softwares for Kriging can be found in Wackernagel (2003) and Chil� es and Del�ner (1999). The more familiar models used in the geodetic literature for LSC are listed in Table 3.1. Figure 3.1 illustrates some of the covariance functions mentioned in Table 3.1 to compare how covariance functions change with distance.
24
Table 3.1: Covariances models Name
Function
Exponential
C0 e−
Second-order Markov
C0 (1 +
r r )e− αd αd
α=
Triangular
C0 (1 −
r ) αd
α=2
Spherical
r r 3 C0 (1 − 0.5 αd + 0.5( αd ) ) α3 − 3α2 + 1 = 0,
Cardinal sine
ψ C0 ( αξ ) sin αξ ψ
Gaussian
C0 e−α
Logarithmic
C0 α
Third-order Markov
C0 (1 +
Exponential
rln2 d
Special parameter
Reference
-
Duquenne et al. (2005)
1 2 ,α ln(2+ α )
' 0.59582
Duquenne et al. (2005)
Duquenne et al. (2005)
Duquenne et al. (2005)
α ' 2.87939 α sin α1 = 12 , α ' 0.52756 1
2 r2
α = d1 (ln2) 2
Kearsley (1977)
2
2eα
Duquenne et al. (2005)
1 2
α = 2 ln( 1+(d 2+1) )
Kearsley (1977)
d = 1.095α
Kearsley (1977)
C0 e−r/d
-
Shaw et al. (1969)
C0 (r/d)Kn (r/d)
Kn :
ln
1 1+(1+r2 ) 2
r α
−
r r2 )e− α 2α2
gravity anomaly Bessel gravity anomaly
modi�ed Bessel
Shaw et al. (1969)
function of the second kind and of order one Exponential-cosine
C0 e−r/d cos αr
α
Vysko� cil (1970)
-
Kasper (1971)
-
Jordan (1972)
gravity anomaly Second-order
r
C0 (1 + dr )e− d
Markov gravity anomaly 2 /d2
Gaussian geoid undulation
C0 e−r
Second-order
C0 (1 +
r r )e− D D
D: characteristic distance
Jordan (1972)
C0 (1 −
r r )e− D D
D: characteristic distance
Jordan (1972)
C0 (1 +
r D
D: characteristic distance,
Jordan (1972)
C0 (1 +
r D
Markov geoid undulation Second-order Markov gravity anomaly Third-order
+
r r2 )e− D 3D2
−
r r2 )e− D 2D2
d = 2.905D
Markov geoid undulation Third-order Markov gravity anomaly
-
C0 (1+α2 r2 )m
D: characteristic distance,
d = 1.361D m=2, Hirvonen; √ m=1/2, d = 3/α; m=3/2, d = (22/3 − 1)1/2 /α.
Jordan (1972)
Moritz (1980a)
25
1
1
0.8
0.4
0.2
0.4
0.2
0
0
−0.2
−0.2
−0.4
0
20
40 60 Distance (km)
80
Gaussian Third−order Markov Cardinal sine
0.6 Coavriance
0.6 Coavriance
0.8
Exponential Second−order Markov Triangular
100
−0.4
0
20
40 60 Distance (km)
80
100
Figure 3.1: Covariance models with unit variance
Two of the most common covariance functions used in geodesy include the Gaussian (for the case where
θ2 → ∞) (also called squared exponential by Paciorek and Schervish (2006))
and exponential (θ2
=
1 ) covariance functions (Hancock and Stein, 1993). 2
The Gaussian covariance structure is useful in many contexts, especially when it is desirable to �t a very smoothly varying spatial process (Moritz, 1980a). It is given by
µ
2 rij CGaus (si , sj ) = C0 exp − 2 d
¶ (3.16)
Unfortunately, the Gaussian function does not have a simple harmonic extension into outer space, or in other words it does not have a simple harmonic form in terms of spherical distance; so it can not be used very well as a spatial covariance function (Moritz, 1980a). The scaling parameter
d controls how far apart points must be before the covariance between
them is practically zero. In Figure 3.2, we see a Gaussian covariance function with several different values for
d, showing how the differing values affect the covariance function.
For
comparison purposes, Figure 3.2 also shows the corresponding variograms for each value of
d.
26
1
1
0.9
0.9
d=5 d=20 d=40
0.8
0.6 0.5 0.4
0.6 0.5 0.4
0.3
0.3
0.2
0.2
0.1
0.1
0
0
20
40
60
80
d=5 d=20 d=40
0.7 Variogram
Covariance
0.7
0.8
100
0
0
20
40
60
80
100
Distance
Distance
Figure 3.2: (left) Gaussian covariance function and (right) Gaussian variogram for various values of
d (distances in km).
The exponential covariance function is de�ned as (Shaw et al., 1969)
³ r ´ ij Cexp (si , sj ) = C0 exp − d
(3.17)
Figure 3.3 shows exponential covariance functions and the corresponding variograms for the same values of
d featured in Figure 3.2.
It shows that the covariance function does not
change as smoothly with increasing distance as was the case with the Gaussian covariance function (Figure 3.2).
The parameter statistics,
d has different de�nitions in the geodetic and geostatistics literature.
d is called the range and is de�ned as the distance at which the covariance function
decreases to approximately zero (Goovaerts, 1997). In LSC, tance (length) and is the value of :
In geo-
d is called the correlation dis-
r for which C(d) has decreased to half of the value at r = 0
C(d) = 21 C0 (Moritz, 1980a).
Jordan (1972) de�ned
d
of its variance value.
Jordan (1972) preferred using characteristic distance of
is multiplication of
d,
as the shift distance at which the covariance function equals
D,
1/e
which
due to the simpler form of the covariance functions in terms of
D
(compare, for example, the second-order Markov models of Duquenne et al. (2005) and
27
1
1
0.9
0.9 d=5 d=20 d=40
0.8
0.7
0.6
Variogram
Covariance
0.7
0.8
0.5 0.4
0.6 0.5 0.4
0.3
0.3
0.2
0.2
0.1
0.1
0
0
20
40
60
80
100
Distance
d=5 d=20 d=40
0
0
20
40
60
80
100
Distance
Figure 3.3: (left) Exponential covariance function and (right) Exponential variogram for various values of
d (distances in km).
Jordan (1972) in Table 3.1).
Jordan (1972) suggested different covariance functions for
different functionals of the gravity �eld based on characteristics of each functional.
For
example, in Table 3.1, Jordan (1972)'s second-order Markov covariance function is different for geoid undulations and gravity anomalies.
3.4
The law of covariance propagation
In section 3.3, it was mentioned that the only condition for a function to be chosen as a covariance function is positive de�niteness. Also, it was mentioned that Jordan (1972) proposed using different covariance functions for different functionals of the gravity �eld, which match the characteristics of each functional better. This section will review how the law of covariance propagation relates different functionals of the gravity �eld in geodesy. This subject is very important because it allows the implementation of LSC in geodesy to predict different functionals of the gravity �eld from each other (Krarup, 1969).
First, global covariance functions are introduced, and then planar covariances, which are approximation of the spherical ones for local applications, are reviewed. In this section, the focus is put on covariance functions of gravity anomalies and geoid undulations, which will
28
be used in Chapter 6. A complete list of global covariance functions for all functionals of the gravity �eld can be found in Tscherning and Rapp (1974), and the planar covariances are in Forsberg (1987).
3.4.1
Global covariance models
In Tscherning and Rapp (1974), the covariance function
T
at points
P
and
Q
C(P, Q) of the anomalous potential
has been chosen as the basic covariance function.
C(TP , TQ )
has the
solid scalar spherical-harmonic expansion of
C(TP , TQ ) =
∞ X
σl (T, T )(
l=0
where
R2 l+1 ) Pl (cosψ) rP rQ
(3.18)
σl are the degree variances of the anomalous potential, R is the radius of the Bjerham-
mar sphere (Bjerhammar, 1964) and
rP , rQ are the geocentric radii to points P (λP , φQ ) and
Q(λQ , φQ ) which are separated by a spherical distance ψ (Heiskanen and Moritz, 1967):
ψ = arccos(cos φP cos φQ cos(λP − λQ ) + sin φP sin φQ )
(3.19)
All other signal covariances are derived by the propagation law of degree-variances or the propagation in the spectral domain, which holds only for linear and isotropic operators (Tscherning and Rapp, 1974). The covariance function
C(P, Q)
of the gravity anomaly
∆g
has
the spherical-harmonic expansion of the form
C(∆gP , ∆gQ ) =
∞ R2 X R2 l+1 ) Pl (cosψ) σl (∆g, ∆g)( rP rQ l=0 rP rQ
where the degree variances of anomalous potential
T
and gravity anomaly
� ek and Krakiwsky, 1986) by spherical approximation (e.g., Van´�c
(3.20)
∆g are related in
29
σl (∆g, ∆g) =
(n − 1)2 σl (T, T ) R2
For the covariance function of the gravity anomaly
(3.21)
∆g and geoid height N
∞ R X R2 l+1 C(NP , ∆gQ ) = σl (N, ∆g)( ) Pl (cosψ) rP γ l=0 rP rQ
(3.22)
with the degree variances of
σl (N, ∆g) =
and
γ
(n − 1) σl (T, T ) R
(3.23)
is normal gravity on the surface of the reference ellipsoid (Moritz, 1980a).
For numerical computation of these covariance functions, the FORTRAN subroutine COVAX, developed by Tscherning (1976), can be used.
3.4.2
Local planar covariance models
Forsberg (1987) introduced a complete set of formulas for self-consistent auto- and crosscovariances of geoid undulation, gravity disturbances, de�ections of the vertical, and secondorder gradients. All of the planar covariance functions of Forsberg (1987) were estimated by taking the derivatives of auto-covariance of anomalous potential
T.
Forsberg (1987)'s planar
covariance models for local gravity �eld modelling have an implied power spectral density (PSD) decay in accordance with the Tscherning and Rapp (1974) model.
The Forsberg
(1987) model for covariance between gravity anomalies is of the form
C∆g,∆g (r) = − log(z + r)
(3.24)
30
where
x = x2 − x1 y = y2 − y1 z = z2 + z1 + D r = (x2 + y 2 + z 2 )1/2
For two points
P1 = (x1 , y1 , z1 ) and P2 = (x2 , y2 , z2 ) with Euclidean coordinates, located at
or above the reference plane. The planar depth parameter
D corresponds to the depth to the
Bjerhammar sphere.
The corresponding cross-covariance function of quasigeoid undulations and gravity anomalies is:
CN,∆g =
r − z log(z + r) γ
(3.25)
Singularities in the simple logarithmic covariance functions arise from the inadequacy of the planar approximation at low spatial frequencies (Strykowski, 1996). The Forsberg (1987) solution is that any type of covariance function in the �nal model may expressed as
C
0
(x, y, z1 + z2 ) = f
3 X
αi C(x, y, zi )
(3.26)
i=0 where
zi = z1 + z2 + Di ,
with
α0 = 1, α1 = −3, α2 = 3, α3 = 11
and C given by the
simple logarithmic covariance expressions evaluated using a depth parameter (characteristic distance)
Di = D + id.
The scaling factor
f
is given by
f = C0 / log(
where
D13 D3 ) D0 D23
C0 and d are the variance and correlation length respectively.
(3.27)
31
3.5
Anisotropic covariance functions
Anisotropic covariance functions have been suggested by Morrison (1977), Kearsley (1977), and Duquenne et al. (2005) for the local application of LSC to geodetic data. This involves detecting different parameters of the covariance function (C0 and
d) in different directions.
The idea originally comes from geostatistics (e.g., Goovaerts, 1997; Chil� es and Del�ner, 1999). There are two different approaches to detect anisotropy in covariance parameters:
1. Estimation of empirical covariances in various directions. The covariances (or variograms) are calculated for several directions and displayed separately (Chil� es and Del�ner, 1999). Two anisotropic categories may be detected from directional covariances: geometric anisotropy, which has different ranges (d) for different directions, and zonal anisotropy, which are caused either by various covariance structures or the parameter
C0 (variance) (or both) in different directions (Figure 3.4).
1
1.5
0.9 0.8 SE−NW NE−SW
1
0.6
Variogram
Variogram
0.7
0.5 0.4
SE−NW NE−SW
0.5
0.3 0.2 0.1 0
0
1
2
3
4 Distance
5
6
7
8
0
0
1
2
3
4 Distance
5
6
7
8
Figure 3.4: (left) Geometric anisotropy with the major axis along the E-W direction; (right) zonal anisotropy (distances in km).
2. Covariance maps. For displaying covariance maps, the lines of constant covariation are graphed two-dimensionally (Goovaerts, 1997). This representation of the variogram
32
(or covariances) in all directions is a good visual tool to highlight anisotropy in the data. Figure 3.5 shows an example of the ef�ciency of a covariance map to illustrate anisotropy along azimuth
135◦
in geoid heights from EGM96 (Lemoine et al., 1998)
over Australia. The principle is to de�ne a grid such that the origin of the space is located at the centre of this grid. Each pair of samples corresponds to a distance and a direction, which can be mapped into a grid cell, and to a variability, which contributes to the cell valuation.
110˚
130˚
120˚
140˚
150˚
160˚
-10˚
Covariance map
-10˚
21.000
1200.00
-20˚
-20˚
900.000
Ylag
-30˚
-30˚
600.000
-40˚
300.000
-40˚
110˚
0.0
130˚
120˚
140˚
150˚
160˚
0.0 0.0
Xlag
21.000
-50 -40 -30 -20 -10
0
10
20
30
40
50
60
2 Figure 3.5: Covariance map (in m ) (left) of the geoid heights from EGM96 (degree and order 2-60) (right) representing the geoid slope (in m) across Australia [Lambert conic conformal projection]
3.6
Fitting a covariance model to empirical covariances
The last step in structural analysis is �tting covariance models to empirical covariances to �nd parameters of the covariance function (d and
C0 ).
Geodesists commonly use covari-
ance functions for LSC (Moritz, 1980a), but geostatisticians prefer variograms for Kriging
70
80
33
(Cressie, 1993). The �tting is often a tricky procedure, and it is a mixture of manual and automatic processes. It is fairly common practice in the geostatistical literature to model covariance structures as linear combinations of different semivariogram functions with different ranges. In this case, the covariance is said to have nested structures (e.g., Chil� es and Del�ner, 1999; Wackernagel, 2003).
There is not much attention paid in geodesy to this subject.
Automatic �tting by least-
squares has been used in the geodetic literature (e.g., GRAVSOFT programs by Forsberg and Tscherning (2008)). Geostatisticians rely more on manual �tting (Cressie, 1993; Chil� es and Del�ner, 1999).
3.7
The stationarity concept in LSC
Although at the beginning of this Chapter, the stationarity concept has been mentioned, it is rather a ambiguous subject in geodesy.
The terminology of non-homogenous covariance modelling, used by Tscherning (1999), is the same as the non-stationarity terminology used in this thesis. The term non-stationarity is used much more widely in spatial statistics (e.g., Cressie 1999) and physical geodesy (e.g., Keller 1998, 2000, 2002, Kotsakis 2000).
Another expression that should be clari�ed is anisotropy. Anisotropy is direction dependent (Cressie, 1993; Chil� es and Del�ner, 1999). The anisotropic covariance functions originally existed in geostatistics and have been used occasionally in LSC (Kearsley, 1977; Duquenne et al., 2005). In Chapter 4 where the review of non-stationary methods is given, also covers anisotropy. When the model of non-stationarity is given for either mean or covariance, which enforces mean or covariance variation with location in BLUE systems, it automatically covers the model of anisotropy, which is mean and covariance variation with direction.
Armstrong (1998) believes that the assumption of stationarity is a compromise between the scale of homogeneity of the phenomenon under investigation and the sampling density: Over the total distance shown in Figure 3.6 (8 km) there is an increase from left to right. However,
34
looking at a zoom-in of the central section (bottom graph), the �uctuations appear to cover up the trend. This means that at this smaller scale, the variable could be considered as a locally stationary or, at least, intrinsic variable (Section 3.1) whereas it is non-stationary at longer scales.
Figure 3.6: The phenomenon is (upper graph) not stationary because of the increase in the average. Over shorter sections (bottom graph), it can be considered as being locally stationary because the �uctuations dominate the trend (Armstrong, 1998).
In conclusion, the stationarity of a �eld is a somewhat subjective decision. However, stationarity occurs when the following conditions exist (Goovaerts, 1997):
•
The expected value of any data location is invariant, and
•
The two-point covariance exists and depends only on the separation distance.
The �rst condition is ful�lled due to the absence of obvious trends or if the trend is removed beforehand. The second condition will be satis�ed later when parameters are found to �t any geometric anisotropy that exists. We then will be able to move forward with the analysis, con�dent that our assumption of stationarity is reasonable.
The LSC solution gives the minimum mean square error in a very speci�c sense, where the stationary assumptions (two above conditions) are satis�ed (Kearsley, 1977). In the next section, a review of evidence when these conditions are not ful�lled is made.
35
3.8
Evidence of non-stationarity in geodetic data
The assumption of a stationary gravity �eld over the Earth has been queried for as long as covariance techniques have been discussed and used (e.g., Kearsley, 1977; Knudsen, 1988). Rapp (1964) investigated three different regions of the United States and found signi�cantly different covariance functions for each.
Gaposchkin (1973) analysed subsets of data of
oceanic and continental gravity assuming isotropy, and found the differences between covariances to be signi�cant. He concluded that · · · gravity is not stationary. Similarly, in a statistical analysis of anomalous gravity over Czechoslovakia, Vysko� cil (1970) investigated the covariance functions for gravity anomaly means of
100 × 150
blocks and concluded the
theoretical assumption of homogeneity and isotropy· · · is basically only forced and in reality it will probably not always be satis�ed.
Schwarz and Lachapelle (1980) showed that some common characteristics exist for a local covariance function over an area as large as Canada, excluding the Rocky Mountains, which shows a compromise. In a similar study by Goad et al. (1984), variances and correlation distances were determined for complete/re�ned Bouguer anomalies in
30 × 30
arc-minute
blocks covering the continental United States. Their analysis showed that the correlation length is smallest in areas of high topography and large variances are associated with the mid-continental gravity high and tectonic features on the Paci�c coast.
Marchenko and Abrikosov (1995) examined covariance analysis of the gravity anomalies in Central and Eastern Europe, which shows large differences between covariance parameters in different regions. Lyszkowicz (2003) computed empirical covariance functions of gravity anomalies in both the space and frequency domains in Poland. The results for the marine and rough topography regions showed that the variances and correlation lengths from the space and the frequency domains varied widely. Flury (2006) did the same analysis on covariances of topography-reduced gravity anomalies, but in the frequency domain over 13 test regions in Europe, showing that the covariance parameters are different in mountainous versus �at terrain.
Analogously, Atkinson and Lloyd (2007) studied local and global variograms in
Kriging for height data, showing them to vary markedly across their region of study.
36
3.8.1
Non-stationarity in Australian gravity anomaly data
Gravity anomalies over the Australian continent offer a convenient sample to test for nonstationarity in geodetic data. Free air gravity anomalies were analysed to determine to what extent the empirical covariances vary spatially. An irregularly spaced data set of 1,106,662 point observations on land with average separation of mostly 11 km, but with denser areas down to 30 m, were provided by Geoscience Australia (Figure 3.7).
They were used to
estimate local gravity anomaly covariance functions following the approach in Schwarz and Lachapelle (1980).
Empirical covariance functions were computed in 39
5◦ × 5◦ sub-regions covering the whole
onshore gravity data set in Australia (Figure 3.7). Blocks 24 and 25 were merged, because there were few data available in Block 25.
The terrestrial free air gravity anomalies are
residual to the degree/order 360/360 EGM96 global geopotential model (Lemoine et al., 1998). The parameters of the local covariance functions (variance
d)
C0 and correlation length
for each sub-region were computed using Tscherning's EMPCOV routine (Tscherning,
1991b), and are summarised in Table 3.2.
In Table 3.2,
C0
is the variance and
Cˆ0
is the variance estimated from EMPCOV, which
computes an empirical covariance function of scalar quantities on a sphere by taking the mean of product-sums of samples of scalar values (here
∆g at points sk = (ϕk , λk )):
Nj 1 X ∆g(sk )∆g(sk + ψj ) CEM P COV (ψj ) = Nj k=1 where
(3.28)
ψj is the spherical distance (Eq. (3.19)) and Nj is the number of pairs for each interval.
The difference between
C0
and
Cˆ0
in Table 3.2 is due to the zero mean assumption implicit
in LSC (Moritz, 1980a) and implemented in EMPCOV, but which is not satis�ed for most of the sub-regions (Table 3.2, third column).
C0
and
Cˆ0
should be the same if the mean value
(m) of each subregion was included in Eq. (3.28):
Nj 1 X CEM P COV (ψj ) = ∆g(sk )∆g(sk + ψj ) − m∆g(sk ) .m∆g(sk +ψj ) Nj k=1 where
m∆g(sk ) =
1 Nj
PNj k=1
∆g(sk ) and m∆g(sk +ψj ) =
1 Nj
PNj k=1
∆g(sk + ψj ).
(3.29)
37
Figure 3.7: Land gravity observation coverage over Australia (top); Thirty-nine (blocks 24 and 25 were merged)
5◦ × 5◦ blocks used to estimate local empirical covariances (Numbers
represent Block No. in Table 3.2), the underlying image shows topographic map of Australia (bottom) [Mercator projection]
38
Table 3.2: Local parameters of residual free air gravity anomaly empirical covariances referenced to EGM96 Mean (mGal)
C0 (mGal2 )
Cˆ0 (mGal2 )
dˆ (Degree)
10409
8.62
501.1
541.98
0.76
2
13559
7.69
397.7
458.32
0.59
3
16371
6.38
1590.5
1465.58
0.81
4
18726
-17.49
753.7
1848.09
1.11
5
92340
10.66
347.4
345.02
0.95
6
33636
7.45
292.5
208.75
0.53
7
28234
1.01
219.3
211.97
0.74
8
21759
-6.69
205.9
285.58
0.64
9
34166
-5.45
213.0
246.63
0.84
10
1764
-0.81
250.2
181.59
0.63
11
29508
-3.88
347.6
224.72
0.69
12
12846
-9.40
430.4
913.79
0.94
13
11191
-7.66
477.1
571.12
0.84
14
2343
-29.36
320.0
1497.23
1.00
15
14452
2.07
340.6
320.93
0.56
16
33486
0.02
1305
1226.73
1.41
17
26635
-23.89
1188.6
2200.58
1.20
18
26819
7.74
97.9
130.40
0.90
19
5908
1.70
144.1
67.76
0.53
21
127460
-1.18
238.1
169.16
0.58
22
57644
4.10
348.5
903.50
1.01
23
16194
6.12
242.8
310.62
0.79
24/25
8065
4.76
164.8
233.62
0.78
26
77915
10.83
307.1
520.43
0.68
27
80582
9.40
733.6
1461.37
1.04
28
27397
1.86
124.0
115.47
0.87
29
18778
-0.34
345.3
309.21
0.88
30
13407
-4.59
379.3
440.55
1.29
31
3070
21.12
353.3
1282.11
0.90
32
43637
3.79
920.2
434.98
0.75
33
49176
-0.14
191.8
90.27
0.62
34
23626
-5.26
188.6
217.84
0.76
35
27423
-0.40
130.8
89.04
0.74
37
4641
12.49
738.1
1293.03
0.52
38
16144
4.21
369.1
345.40
0.75
39
4155
-1.35
278.7
332.60
0.49
40
61084
33.12
547.2
1793.10
0.59
Block No.
No. of data
1
39
The correlation distance is estimated based on the formulation of Goad et al. (1984):
(" dˆ =
N µ X j=2
where
Cˆ0
is available from EMPCOV,
distance of pair products and
N
Cj 1− Cˆ0
Cj
# )−1/2 2 /N Dj2
is the covariance from set
(3.30)
j , Dj
is the average
is the number of sets used.
Table 3.2 shows that the mean of gravity anomalies in most regions contradicts the zero mean assumption of LSC. Also from Table 3.2, there is a signi�cant difference in the and
dˆ values
Cˆ0
between areas with rugged topography, like Tasmania (area 40) and areas 16
and 17 in central Australia, and those from �at regions (e.g., areas 22 and 23). The areas with rugged topography show smaller correlation lengths and larger variances, which agree with the �ndings in other parts of the world (cf. Gaposchkin, 1973; Schwarz and Lachapelle, 1980; Goad et al., 1984; Flury, 2006).
The different covariance parameters for different sub-regions shows that a global stationary covariance function is an inadequate representation of localised non-stationarities in Australian residual gravity data. Consequently, a stationary LSC covariance model would underestimate values of gravity anomalies at some points and overestimate them at others.
3.9
Effect of non-stationarity on LSC results
In Section 3.8, evidence of non-stationarity of the mean and covariances in gravity �eld functionals was demonstrated. In Chapter 2, it was pointed out that LSC theory is based on a stationary assumption of the mean and covariances. The straightforward questions are how and to what extent the non-stationarity of data and stationary assumption of LSC theory contradict each other.
It has already been pointed out that the choice of the covariance function is less critical, � et al., 2000) than internal consistency in the computations (Kearsley, 1977; Xu, 1991; Sanso
40
because the results of LSC are not very sensitive to the covariance function chosen, in the same way that the results of ordinary least-squares adjustment do not depend strongly on the weights (e.g., Moritz, 1972). Tukey (1970) estimates that in ordinary least-squares situations, if the ratio of each true weight to the weight used does not vary by more than a factor of two, then the ef�ciency of the �t is always at least
88.8%.
However, ibid. then differentiates
between the normal least-squares solution and the time series situation, pointing out that due to the overlap in data, some bias will result if the variances and covariances are incorrectly estimated.
� et al. (2000) concluded that the dependence of the LSC solution on the kernel/covariance Sanso choice is not very critical, with an example of geoid estimation from gravity anomalies. It was shown that in the limit of increasing data density, the dependency of the LSC on the covariance function decreased.
Using any of the covariance functions in Table 3.1 to build auto and cross-covariance matrices of LSC for
n observation and p prediction points gives (Eq.
−1 Cyl Cll
= C0
cov(d, r11 ) . . . cov(d, r1n ) . . .
. . .
cov(d, rp1 ) . . . cov(d, rpn )
1 C0
(2.3)) gives
−1 cov(d, r11 ) . . . cov(d, r1n ) . . .
. . .
cov(d, rn1 ) . . . cov(d, rnn ) (3.31)
−1 This shows that matrix multiplication of Cyl and Cll makes the ineffective in LSC formulation (Eq.
C0
parameter practically
(2.3)), hence the LSC solution just depends on the
correlation length (d). This simple analysis shows clearly how current covariance functions only weakly affect LSC results.
The crucial issue is: when the dependence of the LSC solution to covariance functions and covariance parameters is very weak, how can it be expected that using non-stationary covariances will make any difference to the prediction result. The answer is
•
Although the LSC solution is not sensitive to parameter
C0 ,
Eq. (3.31) shows that
41
parameter
•
d is effective in LSC;
The dependency of the error covariance matrices in the covariance function is evident from the LSC formulation of Eq.
(2.5) and the literature (e.g., Tscherning, 1975;
Gelderen and Haagmans, 1991; Schuh, 1991; Arabelos et al., 2007);
•
Tests by Barzzaghi et al. (1998) proved that the stationary condition is critical in the LSC �ltering where it comes to the stage of �tting of empirical covariances by covariance models.
•
Reguzzoni et al. (2005) showed that the LSC solution is sensitive to a non-zero mean, hence it can be expected that the non-stationarity of the mean will affect the result of LSC.
For all these reasons, it is considered that non-stationarity is important in LSC theory. The numerical studies in Chapter 6 will show how remedies for non-stationarity of mean and covariances affect LSC predictions and error estimates.
3.10
Summary
In this chapter, the routine structural analysis for LSC was reviewed. The structural analysis is the statistical analysis of observation to be prepared for estimation and prediction. The literature related to covariance computation and modelling which is the main part of the structural analysis was discussed in detail. In standard LSC, stationarity of mean and covariances of observation data is assumed. Various examples around the world and Australia prove the non-stationary nature of gravity data. The stationary assumption of LSC and non-stationary nature of gravity data will affect the LSC estimation and prediction. Chapter 4 will investigate the models that account for non-stationarity of mean and covariances.
42
4. NON-STATIONARY SOLUTIONS TO BLUE PROBLEMS
Other research disciplines, mostly environmental studies (e.g., Nychka and Saltzman, 1998; Fuentes, 2001), have studied the problem of non-stationarity in spatial data or time series. Among these, geostatistics and spatial statistics are more comparable with LSC theory in geodesy. Regardless of the data set involved, the fundamental principles and concepts in one research �eld have been frequently applied to problems in other areas.
This chapter will brie�y introduce non-stationary approaches to best linear unbiased estimation (BLUE) problems from geodesy, geostatistics and spatial statistics.
This review covers the substantial literature dealing with non-stationary approaches to BLUE problems. The aim is to select from a wide range of options, those that are most applicable to LSC in physical geodesy. They are classi�ed into three categories: geodesy, geostatistics and spatial statistics. The advantages and disadvantages of each method are presented, and the justi�cation given as to why the kernel convolution method of Higdon et al. (1999) from spatial statistics is chosen for this research into non-stationary covariance modelling in LSC.
4.1
4.1.1
Non-stationary BLUE solutions in geodesy
Trend removal
Trend removal is the most common approach in LSC to deal with non-stationarity in the mean of geodetic data. This idea originally comes from Tscherning (1994): The LSC solution is giving the minimum mean square error in a very speci�c sense, namely as the mean over all data-con�gurations which by a rotation of the Earth's center may be mapped into each other. So if this should work locally, we must make all areas of the Earth look alike, seen from the gravity �eld standpoint. It is often known as the remove-restore method in
43
geodesy, and basically involves removing as much as we know about the input data, and later adding it back to get the �nal result, thereby using a �eld that is statistically more homogeneous than before. In the LSC procedure for gravity �eld modelling, �rst, the contribution from a high degree (typically 360) spherical harmonic expansion is removed. Secondly, the effect of the local topography is reduced. We will then be left with a residual �eld, with a smoothness in terms of standard deviation of gravity anomalies between
50% and 25% less
than the original standard deviation (Tscherning, 1994).
Other methods of trend removal have been tried in geodetic literature, which vary with the application:
•
Eq. (2.2) can be used for modelling a trend in LSC (Moritz, 1980a).
•
Some authors (e.g., You, 2006) simply reduce the mean as a trend from the data, which basically comes from geostatistics. Cressie (1993) suggested using the median of the data instead, because by removing the mean, the danger of adding a bias to the data is possible.
•
Goad et al. (1984) used a linear polynomial (tilted plane) to remove the trend from Bouguer gravity anomalies for the continental United States.
•
Stopar et al. (2006) presented a method employing the Arti�cial Neural Network (ANN) approximation to obtain a trend surface in the LSC for geoidal undulation determination, although Tscherning (2006) disagrees with the use of ANN for geoid surface construction.
•
In the case of coordinate transformations by LSC, the residual is regarded as distortion (the change in shape after accounting for the datum shift) that remains after the application of a datum transformation (e.g., Ruffhead, 1987; Collier et al., 1997, 1998; You and Hwang, 2006).
44
Trend removal has some disadvantages:
•
It adds extra steps to the computation: �rst the trend should be removed from the input data and after the interpolation or prediction it should be added back to the result;
•
The LSC is based on zero mean assumption of input data, but there is no guarantee that this condition is satis�ed after trend removal;
•
4.1.2
Trend removal itself may introduce some errors and biases to the input data.
Riesz representers
In Tscherning (1999), a non-stationary covariance model was proposed based on replacing stationary degree variances of the anomalous potential
T
in Eq. (3.18) with non-stationary
degree variances. This approach uses non-homogeneous sets of base functions being associated with mass points, where the mass points are buried at varying depths, covering the whole Earth (cf. Barthelmes et al., 1991; Vermeer, 1995).
For such a �nite set, the functions are linearly independent because they may be regarded as a set of Riesz representers (Tscherning, 1984) of the evaluation functionals associated with the points. Riesz representers exist for all linear functionals in separable Hilbert spaces but for the reproducing-kernel Hilbert space (RKHS), they have the property that the inner product of the representer and an arbitrary function in the reproducing-kernel Hilbert space (RKHS) gives the value of the quantity represented by it.
A RKHS of functions, that are harmonic in the set outside a sphere with radius ing a reproducing kernel
K0
R0 ,
hav-
(equal to the covariance function), is considered. The degree
variances of this kernel are denoted by
σ0l .
The set of Riesz representers associated with the evaluation functionals (or gravity functionals) related to distinct points
Pl , l = 1, · · · , L,
on a two-dimensional surface surrounding
the bounding sphere, will be linearly independent. These functions are used to de�ne a new
L-dimensional RKHS with kernel al > 0
45
Kl (P, Q) =
L X
K0 (Pl , P ).K0 (Pl , Q).al
(4.1)
l=1
(The symbols are the same as Section 3.4.1;
P , Q and Pl being points in the set of harmonic-
ity)
If all the points are located on a concentric Bjerhammar sphere with radius form a net covering the sphere, and
al
are area elements (depending on
R1 > R 0 ,
and
L), then this kernel
will converge towards an isotropic kernel with degree variances
2 σl2 = (2l + 1)σ0l .(
Consequently, if
Kl (P, Q)
Earth's gravity potential,
R0 2l+1 ) .(constant) R1
(4.2)
is required to represent an isotropic covariance function of the
COV (P, Q), σ0l
can be selected so that
σl
becomes equal to the
empirical degree variances. If the points are chosen at varying radial distances
Rl > R0 , then
an anisotropic kernel, or equivalent covariance function representation, can be constructed.
This approach introduces non-stationary covariance models for a global scale, but it �rst needs to �nd the optimum position of mass points to match the synthetic gravity �eld close to reality, which enforces the problem of non-uniqueness position of mass points. Because of this complication, it has never been practically applied in geodesy.
4.1.3
Wavelet approach
The localisation properties of wavelets (Daubechies, 1992) make them a very ef�cient and useful tool for spectral studies of irregularly varying (non-stationary) signals, and have attracted several studies in geodesy to apply them to non-stationarity in LSC:
Kotsakis's work
Kotsakis and Sideris (1999) showed that the method of spatio-statistical
collocation, as expressed by the optimal estimation criterion and the translation-invariance
46
condition, leads to signal approximation models similar to the ones encountered in the Mallat (1989) multiresolution analysis (MRA) theory. The classic MRA formalism according to Mallat's pioneering work lies at the very core of some of the approximation principles traditionally used in physical geodesy problems. In particular, Kotsakis (2000a) shows that the use of a spatio-statistical (non-probabilistic) minimum mean square error criterion, for optimal linear estimation of deterministic signals, always gives rise to a generalised MRA in the Hilbert space
L2 (R), under some mild constraints on the spatial covariance function and the
power spectrum of the unknown �eld under consideration. Using the theory and the approximation algorithms associated with statistical collocation, a new constructive (frequencydomain-based) framework for building generalised MRA in
L2 (R)
was presented, without
the need of the usual dyadic restriction that exists in classic wavelet theory.
Although Kotsakis (2000a)'s work introduced the wavelet framework of non-stationary LSC, there has not been a practical computational algorithm to apply this method to real cases, it has not been used elsewhere.
Keller's work
In a very different wavelet approach, Keller (1998a, 2000, 2002) gives a nu-
merical solution based on the Haar wavelet's (Haar, 1910) equivalence to Wiener-Kolmogorov (Brovelli et al., 2003) equations in stationary LSC. Keller's wavelet approach solves the problem of �ltering non-stationary errors from a stationary signal by LSC, when the variance of the data errors differs in different areas. Filtering of stationary errors is classically solved by Wiener-Kolmogorov equations using Fast Fourier Transform (FFT). For non-stationary errors, the equations can not be transformed into the frequency domain and solved by FFT.
Keller's approach has a limited application, with just it being applied to the �ltering of nonstationary errors from stationary signal by LSC.
47
4.2
4.2.1
Non-stationary BLUE solutions in geostatistics
Locally adaptive Kriging
Non-stationarity models of the spatial mean have been applied in geostatistics for many years (e.g., Wackernagel, 2003). One of the most useful methods is adaption of ordinary Kriging (OK) for accounting for the non-stationarity of mean introduced by Deutsch and Journel (1998) for the GSLIB software.
OK amounts to re-estimating, at each new location s, the mean
m
as used in the simple
Kriging (SK) expression. Since the only difference between SK and LSC is that SK assumes that the mean is known, while LSC is based on the zero mean assumption of the observation vector, the LSC Eq. (2.3) is recalled for SK:
ˆ y
= Cyl C−1 ll l
(4.3)
Because OK is most often applied within moving search neighbourhoods (Deutsch and Journel, 1998), i.e., using different data sets for different locations s, the implicit re-estimated mean depends on the location s. Thus the OK estimator of
ˆ y
= Cyl C−1 ll l + (1 −
is, in fact, SK, where the constant mean value
X (Cyl C−1 ll ))m(l)
(4.4)
m is replaced by the location-dependent esti-
mate.
Remark : if
m(l) = 0,
all formulations of LSC, SK and OK (Eqs. (2.3), (4.3) and (4.4))
are similar. Hence, OK as applied within moving data neighbourhoods is already a nonstationary algorithm, in the sense that it corresponds to a non-stationary random �eld (RF) model with varying mean, but stationary covariance. This ability to locally rescale the RF model to a different mean value
m
explains the extreme robustness of the OK algorithm
48
(Chil� es and Del�ner, 1999).
The idea of using just neighbouring data is derived from Kriging algorithms. Most Kriging algorithms consider a limited number of nearby conditioning data. The �rst reason for this is to limit the CPU and computer memory requirements. Furthermore, adopting a global search neighbourhood would require knowledge of the covariance for the largest separation distance between data. The covariance is typically poorly known for distances beyond one-half or one-third of the size of the study area. A third reason for a limited search neighbourhood is to allow local rescaling of covariance parameters for each computation point (Deutsch and Journel, 1998).
This solution of dealing with non-stationarity of the mean has been applied in Chapter 6 for optimising a gravimetric quasigeoid to a geometric quasigeoid.
4.2.2
Segmentation
The problems of non-stationary covariance in Kriging are usually accounted for by developing local variograms and performing a piecewise interpolation (e.g., Atkinson and Lloyd, 2007). In other words, it involves dividing the region of interest into smaller segments within which the covariance function can be considered stationary. Segmentation is also used in geodesy; Tscherning et al. (1987) considered segmentation for merging regional geoids and Knudsen (2005) used segmentation for altimeter data processing.
There are some problems with the segmentation approach:
•
In some subdivisions, the density of data may not be suf�cient to estimate parameters of local covariance functions;
•
It is dif�cult to justify which covariance parameters should be chosen at the boundary of two regions;
•
Segmentation methods need to subsequently patch the covariances or results at the boundaries of the sub-regions, which will cause the edge effects resulting from dis-
49
continuities in the statistical parameters at the borders of neighbouring areas (Knudsen, 2005).
4.3
Non-stationary BLUE solutions in spatial statistics
There is a rapidly growing body of literature in spatial statistics on methods for modelling non-stationary spatial covariance structure. A number of new modelling and inference methods were introduced in the early 1990s, beginning with Sampson and Guttorp (1992)'s spatial deformation approach. The majority of the literature concerns methods that are semiparametric: they are non-parametric with respect to the way that spatial variation in covariance structure is described, but the local covariance structure is described by conventional parametric models. Much of this literature discusses Bayesian modelling strategies that enable the uncertainty in the estimated spatial covariance structure to be re�ected in the spatial estimation.
The body of research on non-stationary solutions in spatial statistics is huge, which has never been pointed out in geodesy before. This section gives a review of these methods, which should be considered as a quick introduction to each, with the aim of opening up a new path in statistical geodesy. During this introduction, the pros and cons of each method with regards to their application to LSC in geodesy are discussed, to justify why the kernel convolution method of Higdon et al. (1999) is chosen for non-stationary modelling of covariances in LSC.
4.3.1
Spatial deformation models
In what some regard as a landmark paper in spatial data analysis (e.g., Banerjee et al., 2004), Sampson and Guttorp (1992) introduced an approach to non-stationarity through deformation.
Suppose that temporally independent samples
Zit = Z(xi , t) are available at N
sites xi , i
=
50
1, . . . , N ,
typically in
R2
and at
T
points in time
t = 1, . . . , T . X = [X1
X2 ]
represents
the matrix of geographic locations. The underlying spatio-temporal process is written as
Z(x, t) = µ(x, t) + ν(x)1/2 Et (x) + ε(x, t),
where
µ(x, t)
is the mean �eld,
and
Et (x) is a zero mean,
i.e.
cov(Et (x), Et (y)) −→
ν(x)
(4.5)
is a smooth function representing spatial variance,
variance one, second-order continuous spatial Gaussian process, 1 as x
−→
y.
ε(x, t) represents measurement error and/or
very
Et .
The
short scale spatial structure, which is assumed to be Gaussian and independent of
correlation structure of the spatial process is expressed as a function of Euclidean distances between site locations after a bijective transformation of the geodetic coordinate system,
cor(Et (x), Et (y)) = Rθ (kf (x) − f (y)k),
where
f (.)
(4.6)
is the one-to-one transformation that expresses the spatial non-stationarity and
anisotropy, and
Rθ
belongs to a parametric family with unknown parameters
θ.
In mathematics, a bijection, bijective function, or one-to-one correspondence is a function that is both injective (one-to-one) and surjective (onto), and therefore bijections are also called one-to-one and onto. Intuitively, a bijective function creates a correspondence that associates each input value with exactly one output value and each output value with exactly one input value, from
http : //www.nationmaster.com/encyclopedia/.
For mappings from one
R2 to another R2 , the geodetic coordinate system has been called the
G-plane and the space representing the images of these coordinates under the mapping the D-plane. Perrin and Meiring (1999) prove that this spatial deformation model is identi�able for mappings from one correlation function
Rk to another Rk assuming only differentiability of the isotropic
Rθ ().
Thus, from Eq. (4.6) there are two unknown functions to estimate,
f
and
Rθ .
The latter is
assumed to be a parametric choice from a standard class of covariance functions (such as in
51
Table 3.1). To determine the former is a challenging �tting problem of choosing a class of transformations and to obtain the best member of this class. Sampson and Guttorp (1992) employ the class of thin plate splines and optimise a version of a two-dimensional nonmetric multi-dimensional scaling criterion, providing an algorithmic solution. The solution is generally not well behaved, in the sense that
f
will be bijective, often folding over itself.
Smith (1996) embedded this approach within a likelihood setting, but worked instead with the class of radial basis functions.
Damian et al. (2001) have formulated a fully Bayesian approach to implement Eq. (4.6). They still work with thin plate splines, but place priors over an identi�able parametrisation
n, being transformed).
They elect not to model
directly but instead model the transformed locations. The set of
n-transformed locations
(which depends upon the number of points,
f
are modelled as
n realisations from a bivariate Gaussian spatial process and a prior is placed
on the process parameters. That is,
f (x) arises as a random realisation of a bivariate process
at x rather than the value at x of a random bivariate transformation.
Figure 4.1 presents an illustration of the G-plane and D-plan for rainfall observation sites in southern France, as presented by Damian et al. (2001).
Figure 4.1: An illustration of (left) the G-plane (original surface) and (right) D-plane (transformed surface) for the spatial deformation method (from Damian et al. (2001))
52
Fundamental limitations of the deformation approach are:
•
The implementation of the deformation method requires independent replications of the process in order to obtain an estimated sample covariance matrix.
In practice,
such replications of a spatial process are rarely obtained. If a repeated measurement is obtained at a particular location, it is typically collected across time;
•
Spatial deformation techniques, like trend removal, allow for a reduction to a stationary covariance structure, that is they are not actually methods to model the non-stationarity.
4.3.2
Kernel smoothing of empirical covariance matrices
Perhaps the simplest approach to deal with a non-stationary spatial covariance structure begins either from the perspective of locally stationary models, which are empirically smoothed over space, or from the perspective of the smoothing and/or interpolation of empirical covariances estimated among a �nite number of observation sites.
Fuentes (2001) and Nott and Dunsmuir (2002) propose approaches for representing nonstationary spatial covariance structure in terms of spatially weighted combinations of stationary spatial covariance functions assumed to represent the local covariance structure in different regions.
There is a difference between this method and the segmentation method introduced in Section 4.2.2. In the segmentation approach, the non-stationary region is divided into stationary subregions, and covariance parameters are estimated in each subregion, then LSC or Kriging is performed in each subregion separately, with speci�c covariances parameters for each subregion, and �nally all LSC or Kriging predictions are merged/patched together. Here, the covariance function is constructed based on segmented covariances, and eventually one LSC or Kriging is performed for the whole region.
53
Fuentes's approach
Consider dividing the spatial domain
D
into
k
subregions
Si ,
each
with a suf�cient number of points to estimate a (stationary) variogram or spatial covariance function
Kθi .
Fuentes (2001) represents the spatial process
Z(x)
(de�ned over the entire
region) as a weighted average of orthogonal local stationary processes
Z(x) =
k X
Zi (x):
ωi (x)Zi (x)
(4.7)
i=1
where
ωi (x) is a chosen weight function such as the inverse squared distance between x and
the centre of subregion
Kθi .
Si
and
Zi (x) denotes a spatial process with the covariance function
The non-stationary spatial covariance structure is given by
C(Z(x), Z(y)) = Pk
Pk i=1
ωi (x)ωi (y)C(Zi (x), Zi (y)) =
(4.8)
i=1 ωi (x)ωi (y)Kθi (x − y)
Fuentes (2001) proposed to choose the number of subgrids,
k , using a BIC (Bayes Informa-
tion Criterion) as a weight function. The stationary processes in the sense that their corresponding covariance functions,
Zi (x) are actually local only
Kθi (x − y), are estimated locally,
and they are orthogonal by assumption in order to represent the overall non-stationary covariance simply as a weighted sum of covariances. Fuentes (2001) estimates the parameters within the context of a complete Bayesian spatial estimation with predictive distributions accounting for uncertainty in the parameter estimates.
Fuentes and Smith (2001) proposed to extend the �nite decomposition of
Z(x)
of Fuentes
(2001) to a continuous convolution of local stationary processes. It is an alternate kernel approach in which the process is taken to be the convolution of a �xed kernel over independent stationary processes,
Zθ(u) (.)
Z Z(x) =
The resulting covariance,
K(x − u)Zθ(u) (x)du.
C(., .) is expressed as
(4.9)
54
Z C(xi , xj ) =
For each
K(xi − u)K(xj − u)Cθ(u) (xi − xj )du.
u, Cθ(u) (., .) is a covariance function with parameters θ(u),
tivariate) spatial process that induces non-stationarity in the spatial �eld of parameter vectors
θ(u),
Z(.).
(4.10)
where
θ(u) is a (mul-
Estimation will require that
indexing the stationary Gaussian processes, be
constrained to vary smoothly.
This method has the advantage of avoiding the need to parameterise smoothly varying positivede�nite matrices, as required in the Higdon et al. (1999) Gaussian kernel approach (Section 4.3.4). One drawback of the approach is the lack of a general closed form for
C(xi , xj ) and
the need to compute covariances by Monte Carlo integration; this is of particular concern because of the numerical sensitivity of covariance matrices (the inverse of the covariance matrices used in LSC or Kriging could become singular or ill-conditioned for several reasons, e.g., when the diagonal elements are much smaller than non-diagonal elements). In addition to Bayesian methods, Fuentes and Smith (2001) and Fuentes (2001) describe spectral methods for �tting models when the data are (nearly) on a grid; these may be much faster than likelihood methods (Chil� es and Del�ner, 1999).
Nott and Dunsmuir's approach
This technique has the stated aim of reproducing an em-
pirical covariance matrix at a set of observation sites and describing the conditional behaviour given observation site values with a collection of stationary processes. The same notation as above was used, although for Nott and Dunsmuir (2002), tion sites rather than a smaller number of subregions, and the
i indexes the observa-
Kθi (x − y)
represents local
residual covariance structure after conditioning on values at the observation sites. These are derived from locally �tted stationary models.
In their general case, Nott and Dunsmuir's (2002) representation of the spatial covariance structure can be written as
55
C(Z(x), Z(y)) =
X i=0
where
P
(x, y) +
k X
ωi (x)ωi (y)Kθi (x − y)
(4.11)
i=1
i=0 (x, y) is a function of the empirical covariance matrix at the observation sites,
C = [cij ],
and the local stationary models computed so that
C(Z(xi ), Z(xj )) = cij .
exact interpolation is relaxed by replacing the empirical covariance matrix
C
This
by the Loader
and Switzer (1992) empirical Bayes shrinkage estimator.
While the models introduced by Fuentes (2001) and Nott and Dunsmuir (2002) look similar (compare Eqs. (4.8) and (4.11)), the details are substantially different. Nott and Dunsmuir use hypothetical conditional processes, and assume an empirical covariance matrix computed from spatio-temporal data. Fuentes (2001) uses unconditional processes and applies them to purely spatial data.
It involves a complete Bayesian analysis without having to resort to
computationally intensive Markov Chain Monte Carlo (MCMC) methods.
While this method is convenient for accommodating non-stationary covariance structure, certain key elements of the approach, such as the number of locally stationary component models, or the size of the neighbourhoods for �tting the local models, and the nature of the weight or kernel must be determined by somewhat ad hoc means.
4.3.3
Basis-function models
One of the modelling strategies for non-stationary spatial covariance structure is based on decompositions of spatial processes in terms of empirical orthogonal functions (EOFs) (Sampson et al., 2001).
The original methodology in this �eld has received renewed attention
recently in the work of Nychka et al. (2002) for using a wavelet basis for decomposition of the empirical covariance matrix.
While most attention in the spatial statistics literature has focused on smoothing �elds based on a single set of spatial observations, in many cases, replicates of the �eld are available, e.g., with environmental data collected over time. This sort of data is becoming even more common with the growing availability of remotely sensed data. In this situation, one has multiple
56
replicates for estimating the spatial covariance structure, albeit with certain restrictions, such as modelling only non-negative covariances.
Brie�y, using the same spatio-temporal notation as above, the matrix
C
n×n
empirical covariance
may be written with a spectral decomposition as
C = F´ ΛF =
nT X
λk Fk F´k
(4.12)
k=1
where
nT = min(n, T ),
and
F´
and
F
are eigenfunctions. The extension of this �nite de-
composition to the continuous spatial case represents the spatial covariance function as
C(x, y) =
∞ X
λk Fk (x)Fk (y)
(4.13)
k=1
where the eigenfunctions
Fk (x)
represent solutions to the Fredholm integral equation and
correspond to the Karhunen-Lo� eve (KL) decomposition (originally used in pattern recognition (Fukunaga, 1990)) of the (mean-centered) �eld as
Z(x, t) =
∞ X
Ak (t)Fk (x).
(4.14)
k=1
The modelling and computational task here is in computing a numerical approximation to the Fredholm integral equation, or equivalently, choosing a set of generating functions
e1 (x), . . . , ep (x) that are the basis for an extension of the �nite eigenvectors Fk to eigenfunctions
Fk (x).
In Nychka and Saltzman (1998) and Holland et al. (1999), the spatial covariance function is represented as the sum of a conventional stationary isotropic spatial covariance model and a (�nite) decomposition in terms of EOFs. This corresponds to a decomposition of the spatial process as a sum of a stationary isotropic process and a linear combination of
M
additional
basis functions with random coef�cients, the latter sum representing the deviation of the
57
spatial structure from stationarity.
Nychka et al. (2002) have proposed a method for smoothing the empirical covariance structure of replicated data by thresholding the decomposition of the empirical covariance matrix in a wavelet basis.
This approach has the advantages of allowing for very general types
of covariance structure and of being very fast by virtue of the use of the discrete wavelet transform, with a computational focus on large problems with observations discretised to the nodes of a (large)
N ×M
grid. Their example is an analysis of monthly precipitation �elds
over a region of the Midwest USA and Rocky Mountains with observations at about 1600 stations discretised onto a
128 × 128
grid. They use a
W
wavelet basis with parent forms
that are piecewise quadratic splines, which are neither orthogonal nor compactly supported. These were chosen because they can approximate the shape of common covariance models such as the exponential and Gaussian, depending on the sequence of variances of the basis functions in the decomposition.
One drawback to the above approach is that it is not clear how much or what type of thresholding to do, since there is no explicit model for the data. Given the dif�culties involved in modelling high-dimensional covariance structures, it is also not clear how well the resulting smoothed covariance approximates the true covariance in a multivariate sense, although Nychka et al. (2002) have shown, in simulations, that individual elements of the smoothed covariance matrix can closely approximate the elements of stationary covariance matrices.
4.3.4
Kernel convolution models
The approach of Higdon et al. (1999) is to de�ne a non-stationary covariance function based on the convolution of kernels centered at the locations of interest. stationary spatial covariance function,
They propose a non-
C(., .), de�ned by
Z C(si , sj ) = R2
where si , sj , and
u
are locations in
R2
and
Ksi (u)Ksj (u)du,
Ks
(4.15)
is a kernel function (not necessarily non-
58
negative) centred at location s, with a shape depending on s. This covariance function is positive-de�nite for spatially varying kernels of any functional form, as will be shown in Chapter 5. They justify this construction as the covariance function of a process, structed by convolving a white noise process,
Z(.), con-
ω(.), with a spatially varying kernel, Ks :
Z Z(s) = R2
Ks (u)ω(u)du,
(4.16)
The evolution of the kernels in space produces non-stationary covariance, and the kernels are usually parameterised so that they vary smoothly in space, under the assumption that nearby locations will share a similar local covariance structure. Higdon et al. (1999) use Gaussian kernels, which give a closed form for
C(si , sj ),
the convolution in Eq. (4.15), as shown in
Chapter 5.
Higdon et al. (1999) use the bivariate Gaussian density function with a matrix
Σ,
2×2
covariance
which results in processes with a non-stationary Gaussian correlation function
with the principal axes of
Σ determining the directions of the anisotropic structure.
Higdon et al. (1999) demonstrate the particular case where the
Ks (.) are bivariate Gaussian
densities characterised by the shapes of ellipses underlying the
2×2
covariance matrices.
The kernels are constrained to evolve smoothly in space by estimating the local ellipses under a Bayesian paradigm that speci�es a prior distribution on the parameters of the ellipse (the relative location of the foci) as a Gaussian random �eld with a smooth (in fact, Gaussian) spatial covariance function. It should be noted that the form of the kernel determines the shape of the local spatial correlation function, with a Gaussian kernel corresponding to a Gaussian covariance function.
Figure 4.2, based on the presentation in Swall (1999), illustrates the nature of a �tted model for an analysis of the spatial distribution of dioxin concentrations in the Piazza Road pilot study area in Missouri, USA. In this purely spatial example, dioxin was transported through a small stream channel, which follows a curving path generally along the path of greatest concentration from top to bottom as indicated in Figure 4.2. The solid ellipses indicate the shape of the Gaussian kernels at sampling sites as given by the posterior distribution of the
59
Figure 4.2: Estimated kernels of the process-convolution model for the Piazza Road data. Solid ellipses represent the kernels at the sampling sites and dotted ellipses the extension to a regular grid according to the random �eld prior model. The underlying image show the corresponding posterior mean estimates for the dioxin concentrations (from Swall (1999)).
60
Bayesian analysis; the major axis of the ellipse indicates the direction of greater spatial correlation, which roughly parallels the direction of the stream channel. The dotted ellipses represent the spatially varying estimates of these local kernels on a regular grid, in accordance with the Gaussian random �eld prior for their parameters.
One advantage of the non-stationary covariance model based on Higdon et al. (1999) is that it fully de�nes the covariance at unobserved as well as observed locations and does not require a regular grid of locations. This stands in contrast to the approach of Nychka et al. (2002), although they brie�y suggested an iterative approach to deal with irregularly spaced locations.
Recalling that the primary goal of this thesis is to apply non-stationary methods to physical geodesy, spatial deformation needs replicated data, which is not always case in geodesy, and is better suited for time-series analysis. Kernel smoothing models use advanced Bayesian analysis and numerical approaches like Markov Chain Monte Carlo (MCMC), which are very time consuming.
Basis function models in practice need gridded data, which are not always available in geodesy, or need the interpolation of non-grid data. In addition, non-stationary models are needed in LSC to grid irregular data sets. On the other hand, the method of Higdon et al. (1999) has been tested in Kriging for topographic data by Paciorek and Schervish (2006), which is very close to the LSC application for geodetic data. Therefore, this method does not have the disadvantages of other approaches from the geodetic perspective and the adaption of this method according to the similarity of LSC to Kriging is more likely (Dermanis, 1984).
61
4.4
Summary
In this Chapter, different methods in the three disciples of geodesy, geostatistics and spatial statistics for dealing with non-stationarity of mean and covariances, with pros and cons of each method, were reviewed.
Through this review, it is discovered that spatial statistics, speci�cally recent researches in environmental applications, offer variety of non-stationary covariance models which are new to geodesy. This review indicated that the kernel convolution of Higdon et al. (1999) among other methods in spatial statistics has the superior advantages to be adapted for LSC in geodesy.
62
5. NON-STATIONARY COVARIANCE FUNCTIONS USING CONVOLUTION OF KERNELS
In Chapter 4, the approaches for modelling non-stationary covariance functions in spatial statistics were reviewed from the perspective of their applicability to geodetic LSC. Among the different methods, the kernel convolution of Higdon et al. (1999) (henceforth HSK) is the best for application to non-stationary covariance modelling in LSC, for the following reasons:
•
It does not have any data limitation: spatial deformation method needs replicated data, and basis function models are practically only applied to gridded data;
•
It does not need Bayesian analysis, which some geodesists may not be familiar with;
•
HSK has been assessed for Kriging (Paciorek and Schervish, 2006), which is the closest BLUE solution to LSC (Dermanis, 1984). Also it uses elliptical kernels (Section 5.3), which are very familiar to adjustment theory in mathematical geodesy and the shape of the Earth (e.g., Rummel, 1991).
This Chapter describes in detail the approach of HSK for de�ning non-stationary covariance functions and explains how to apply this method practically in LSC for geodetic applications.
5.1
HSK approach of kernel convolution
HSK propose a spatial covariance function,
C(., .), de�ned by
Z C(si , sj ) = R2
Ksi (u)Ksj (u)du,
(5.1)
63
where si , sj , and s are locations in
R2 ,
and
Ks
is a kernel function centered at s.
construction is the covariance function of a white noise process kernel function to produce the process
ω(.)
This
, convolved with the
Z(.), de�ned by
Z
Z
Z(s) =
K(s − u)ω(u)du = R2
R2
White random process (white noise)
Ks (u)ω(u)du.
A continuous random process
(5.2)
ω(s) is a white noise
process if and only if its mean function and autocorrelation function satisfy
µω (s) = E[ω(s)] = 0
(5.3)
Rωω (si , sj ) = E[ω(si )ω(sj )] = (N0 /2)δ(si − sj ).
(5.4)
It is a zero mean process for all locations and has in�nite power at zero spatial shift since its autocorrelation function is the Dirac delta function:
∞, δ(s) = 0,
s s
=0 6= 0
(5.5)
The autocorrelation function in Eq. (5.5) implies the following power spectral density (PSD).
Sss (ω) = N0 /2.
(5.6)
since the Fourier transform of the delta function is equal to unity. As this PSD has the same values at all frequencies, it is de�ned as white.
One can avoid the technical details involved in de�ning such a white noise process by using the de�nition of positive-de�niteness (e.g., Moritz, 1980a; Cressie, 1993) to show directly that the covariance function is positive-de�nite in every Euclidean space,
1, 2, · · · , n:
Rp ; p =
64
Pn Pn i=1
j=1
R P P ai aj C(si , sj ) = ni=1 nj=1 ai aj R2 Ksi (u)Ksj (u)du R P P = R2 ni=1 nj=1 ai Ksi (u)aj Ksj (u)du R P P = R2 ni=1 ai Ksi (u) nj=1 aj Ksj (u)du R P = R2 ( ni=1 ai Ksi (u))2 du
(5.7)
≥ 0. The key to achieving positive-de�niteness is that each kernel is solely a function of its own location. Apart from this one restriction, the structure of the kernel is arbitrary.
Firstly, it is shown that the closed form of the HSK covariance for Gaussian kernels based on the equivalence of convolutions of probability density functions (PDF) with sums of independent random variables is given by
= ×
C(si , sj ) =
R
1
P
1
Rp
¡
Ksi (u)Ksj (u)du
¢ exp − 12 (si − u)T Σ−1 i (si − u) ¢ ¡ exp − 12 (sj − u)T Σ−1 j (sj − u) du.
1 Rp (2π) P2 |Σ | 21 i
(2π) 2 |Σi | 2
R
(5.8)
recognising Eq. (5.8) as the convolution of probabilities
Z
Z hA (u − si )hU (u)du =
where
h(.)
other (A
hA,U (u − si , u)du,
is the normal PDF, and the distribution of
A
and
U
(5.9)
are independent from each
∼ N (0, Σi ), U ∼ N (sj , Σj )).
Now consider the transformation
W = U − A and V = U ,
which has a Jacobian of unity
(Paciorek, 2003). This gives the following equalities based on the change of variables (A and
U
to
W
and
V ):
65
R
R hA,U (u − si , u)du = hW,V (u − (u − si ), u)du R = hW,V (si , u)du
(5.10)
= hW (si ). Since
W = U − A,
W ∼ N (sj , Σi + Σj ) (W
and
V
are correlated with cross-covariance
ΣW,V = Σj ),
=
P (2π) 2
1
1 |Σi +Σj | 2
C(si , sj ) = hW (si ) ¡ ¢ exp − 12 (si − sj )T (Σi + Σj )−1 (si − sj )
(5.11)
When the size of the kernels changes quickly, the resulting correlation structure can be counterintuitive because of the prefactor in front of the exponential in Eq. (5.11). When the kernels centered at si and sj are similar in size, the numerator and denominator approximately cancel, but when one kernel is much larger than the other, the square root of the determinant in the denominator dominates the product of the fourth roots of the determinants in the numerator; this effect causes a lower correlation than achieved based solely on the exponential term.
This effect is most easily seen graphically in the one-dimensional example in Figure 5.1, where
R(−0.5, s) (the correlation between the point −0.5 and all other points) and R(0.5, s)
are shown, when the kernel size changes drastically at s
= 0.
The correlation of s
with the points to its left drops off more quickly than for the correlation of s
= 0.5
= −0.5 with its
neighbouring points, because of the effect of the prefactor, even though the kernel centered at s
= 0.5 is large, and the kernel centered at s = −0.5 is small.
This is counter to intuition
and to our goal for the non-stationary function because at certain distances, the correlation between two points whose kernels are relatively small is larger than the correlation between a point whose kernel is small and a point whose kernel is large.
66
Figure 5.1: (a) Correlation of of
R(−0.5, s) with the function at all other points.
(b) Correlation
R(0.5, s) with the function at all other points (adapted from Paciorek (2003)).
5.2
Generalisation of the HSK approach to current covariance models
Examining the exponential and its quadratic form in Eq. (5.11), it is a Gaussian stationary co-
T −1 variance function, but in place of the squared Mahalanobis (1936) distance (si − sj ) Σ (si − sj ) for arbitrary �xed positive-de�nite matrix
Σ, a quadratic form with the average of the ker-
nel matrices for the two locations is used.
Mahalanobis Distance
In statistics, the Mahalanobis (1936) distance is a distance measure
based on correlations between variables by which different patterns can be identi�ed and analysed. It is a useful way of determining the similarity of an unknown sample set to a known one. It differs from the Euclidean distance in that it takes into account the correlations of the data set and is scale-invariant, i.e., not dependent on the scale (size) of measurements.
Formally, the Mahalanobis distance from a group of values with mean µ and covariance matrix
= (µ1 , µ2 , µ3 , · · · , µp )T
Σ for a multivariate vector s = (s1 , s2 , s3 , · · · , sp )T
DM (s) =
is de�ned as
p
(s − µ)T Σ−1 (s − µ)
(5.12)
67
The Mahalanobis distance can also be de�ned as the dissimilarity measure between two random vectors si and sj of the same distribution with the covariance matrix
Σ:
q DM (si , sj ) = (si − sj )T Σ−1 (si − sj ).
If the covariance matrix is the identity matrix to the Euclidean distance
Σ = I , the Mahalanobis DM
(5.13)
distance reduces
D:
q D(si , sj ) =
(si − sj )T (si − sj ).
(5.14)
If the kernel matrices are constant, the special case of the Gaussian covariance function based on the Mahalanobis distance is recovered. If they are not constant with respect to s, the evolution of the kernel covariance matrices in
R2
space produces a non-stationary
covariance.
Now consider the quadratic form,
Qij = (si − sj )T (
Σi + Σj −1 ) (si − sj ), 2
(5.15)
which is at the heart of the covariance function in Eq. (5.11), constructed via the kernel convolution. The HSK non-stationary covariance function is the Gaussian covariance with this new quadratic form in place of the Mahalanobis distance (Eq. (5.15)). This relationship raises the possibility of producing a non-stationary version of an isotropic covariance function by using
Qij
in place of
r2 = rT r in the isotropic function.
The quadratic form in Eq. (5.15) de�nes a semi-metric space (Schoenberg, 1938), in which the distance function is
(si − sj )T (si − sj ),
where si
= (
Σi +Σj − 1 ) 2 .sj . However, the new 2
location, si , varies depending on the other point, sj , through its dependence on
Σj .
68
The distance function violates the triangle inequality,
(si − sj )T (si − sj ) + (si − sk )T (si − sk ) ≥ (sj − sk )T (sj − sk )
(5.16)
even if one considers the points as lying in a higher dimensional space, so the space is not an inner-product space.
To see this, consider a one-dimensional example with three
points on a line (Figure 5.2), two points equidistant from the central point and on either side, s1
= −1,
the line,
s2
= 0,
s3
= 1.
Let the Gaussian kernel at the centre point decay slowly along
Σ2 = 32 , while the two other Gaussian kernels decay more quickly along the line,
Σ1 = Σ3 = 1 .
The distance between the central point and either side point is then
2 −1 Q12 = Q23 = (s1 − s2 )T ( Σ1 +Σ ) (s1 − s2 ) 2 2
)−1 ((−1) − (0)) = 0.2 = ((−1) − (0))T ( 1+3 2 which is less than half the distance,
0.2,
(5.17)
4, between the two side points:
3 −1 Q13 = (s1 − s3 )T ( Σ1 +Σ ) (s1 − s3 ) 2
)−1 ((−1) − (1)) = 4. = ((−1) − (1))T ( 1+1 2
(5.18)
Figure 5.2: One-dimensional example for illustration of the triangle inequality with three points on a line, two points equidistant from the central point and on either side
69
Stationary and isotropic covariance functions can be generalised to anisotropic covariance functions that account for directionality by using the Mahalanobis distance between locations si and sj ,
where
q r(si , sj ) = (si − sj )T Σ−1 (si − sj )
(5.19)
Σ is a positive-de�nite matrix, rather than Σ = I , which gives the Euclidean distance
and thus isotropy. For the anisotropic case,
Σ = Θ(α)∆(dmin , dmax )Θ(α)T
where
Θ(α) =
(5.20)
cos(α) − sin(α) sin(α)
and
∆(dmin , dmax ) =
(5.21)
cos(α) d2min
0
0
d2max
the direction of anisotropy is speci�ed by an azimuth angle,
(5.22)
α (0 ≤ α ≤ 2π).
relation length in the horizontal maximum direction is speci�ed by
dmax .
The range in the
perpendicular direction, or the horizontal minimum direction, is speci�ed by
In practice, one uses
r/d =
p
Qij
(cf. Table 5.2), since the correlation length
and can be absorbed into the kernel matrices,
Σi
and
Σj ,
The cor-
dmin . d is redundant
which are allowed to vary in size
during the modelling. The non-stationary covariance is non-negative and decays with distance, but can decay at a different rate in different parts of the covariate space, thus allowing the degree of smoothing to vary (Paciorek, 2003).
Table 5.1: Comparing distance measures for covariance functions in terms of stationarity Covariance function
Distance measure
Parameter
stationary isotropic
r2 = (si − sj )T Σ−1 (si − sj )
Σ=I
stationary anisotropic
r2 = (si − sj )T Σ−1 (si − sj )
Σ = Θ(α)∆(dmin , dmax )Θ(α)T
non-stationary
Qij = (si − sj )T (
Σi +Σj −1 ) (si 2
− sj )
Σi , Σj
70
Table 5.1 compares distance measures for covariance functions in terms of stationarity. The following theorem applies in particular to covariance functions that are positive-de�nite in the Euclidean space of
Rp ,
in particular the exponential, Gaussian and Mat´ ern covariance
functions (Paciorek and Schervish, 2006).
Theorem of positive-de�niteness of non-stationary correlation function correlation function, function,
R(r),
is positive-de�nite on
Rp
for every
p = 1, 2, · · · , n,
¯ ¯ 1 ¯ Σi + Σj ¯− 2 ³p ´ ¯ R R(si , sj ) = |Σi | |Σj | ¯¯ Qij 2 ¯ p
then the
R(., .), de�ned by
1 4
with
If an isotropic
Qij
used in place of
r,
1 4
is positive de�nite on
Rp , p = 1, 2, · · · , n,
(5.23)
and is a non-
stationary correlation function.
Proof
The proof is a simple application of Theorem 2 of Schoenberg (1938), which states
that the class of functions positive-de�nite in Hilbert space is identical to the class of functions of the form,
Z
∞
R(r) =
exp(−r2 ρ)dH(ρ)
(5.24)
0
where
H(.)
is non-decreasing and bounded, and
ρ ≥ 0.
The class of functions positive-
p de�nite in Hilbert space is identical to the class of functions that are positive-de�nite in R for
p = 1, 2, · · · , n (Schoenberg, 1938). The covariance functions in this class are scale mixtures of the squared exponential correlation. The underlying stationary correlation function with argument
p
Qij
can be expressed as
71
=
R∞ 0
¡p ¢ R ∞ R Qij = 0 exp(−Qij ρ)dH(ρ) Ã ! µ ¶ exp −(si − sj )T =
Since
ρ is non-negative,
R∞R 0
R2
Σi Σ + ρi ρ
−1
2
(si − sj ) dH(ρ)
(5.25)
Ksi ,ρ (u)Ksj ,ρ (u)dudH(ρ).
it becomes part of the kernel matrices, and the last expression can
be seen to be positive de�nite based on Eq. (5.7) (from Paciorek (2003)).¥
Non-stationary covariance functions can be constructed merely by multiplying by a variance parameter,
C0
(Section 3.1). A non-stationary version of the Mat´ ern covariance function is
then derived by replacing
NS CM at (si , sj )
p
Qij
with
r in Eq.
(3.14)
¯ ¯ 1 ´n ³p ´ ³p ¯ Σi + Σj ¯− 2 1 ¯ ¯ = C0 |Σi | |Σj | ¯ 2nQ K 2nQ ij n ij 2 ¯ 2n−1 Γ(θ2 ) 1 4
1 4
(5.26)
Non-stationary versions of all the stationary covariance functions of Table 3.1 can be derived by replacing
p Qij
with
r.
Two of the most commonly used covariance functions in planar
LSC are presented in Table 5.2.
Table 5.2: Non-stationary versus stationary covariance functions Name
stationary
non-stationary
C0 1+( dr )2
Cauchy
CCauc (r) =
Gaussian
³ 2´ CGaus (r) = C0 exp − dr 2
NS CCauc ( si , sj )
¯ 1³ ¯ ´ ¯ Σi +Σj ¯− 2 1 = C0 |Σi | |Σj | ¯ 2 ¯ 1+Qij 1 4
1 4
¯ ¯ 1 1 1 ¯ Σ +Σ ¯− 2 NS CGaus (si , sj ) = C0 |Σi | 4 |Σj | 4 ¯ i 2 j ¯ exp(−Qij )
72
5.3
Implementation of HSK non-stationary covariances in LSC
A key point in the kernel convolution method is how to de�ne the kernels at each point. Two different approaches have been proposed: one is eigendecomposition parameterisation (Paciorek, 2003), and the other is to represent the Gaussian kernels as ellipses of constant probability density at each point (Higdon et al., 1999). Both are based on a fully Bayesian model, with prior distributions on the kernel matrices that determine the non-stationary covariance structure.
The eigendecomposition approach extends more readily to higher dimensions,
which may be of interest for spatial data treatment in 3D and more general nonparametric regression problems (Paciorek and Schervish, 2006).
Here, however, the representation of kernels is described by ellipses, similarly to what was proposed by HSK, mainly because ellipses are familiar shapes in adjustment theory in mathematical geodesy (e.g., Rummel, 1991). Adjustment theory uses error ellipses in 2D and error ellipsoids in 3D. Also, geodesists have known, for over 300 years, that the Earth's �gure is roughly an oblate ellipsoid of revolution. Instead of using Bayesian inference, which assumes a probability distribution function (PDF) for each kernel parameter and then needs complicated and somewhat unfamiliar numerical approaches like the Markov Chain Monte Carlo (MCMC) method (e.g., Robert and Casella, 2004) for the estimation of kernel parameters, the kernel parameters are speci�ed based on empirical covariance functions that are already used in standard LSC theory. This simpler strategy will make the HSK approach more attractive to others for practical implementation in existing LSC software.
The idea of modelling kernels as ellipses comes from the visualisation of a bivariate Gaussian distribution in 3D. If we approach this distribution from above (from the positive z -direction), any
xy plane that has constant z and intercepts the bivariate normal distribution at any point,
except the apex, will form an ellipse in the plane of the bivariate kernel that it cuts. This allows us to use an ellipse (Fig. 5.3) as one way to more intuitively parameterise Higdon et al., 1999; Swall, 1999).
Σ
(cf.
73
Figure 5.3: (left) Three-dimensional view, and (right) contour plot of a bivariate normal distribution.
The location and geometry of the ellipse adopted here can be de�ned through three parameters: its geometrical centre, major axis and minor axis. Since each ellipse represents a kernel for a certain location s, the geometrical centre (not foci) of the ellipse is at the point s. In order to allow the ellipses to vary in size, shape and orientation, we can manipulate the major
a and minor b axes and azimuth angle α (Fig. 5.4).
Figure 5.4: Geometry and parameters of the ellipse used to parameterise the non-stationary HSK kernels
Swall (1999) found over-�tting and mixing problems when the ellipse size was allowed to vary, so HSK �xed the ellipse size at a constant value common to all locations, but instead
74
applied a scaling factor
τ
for each ellipse to vary at each location:
1
Σ2 = τ
a 0
0 b
cos α
sin α
(5.27)
− sin α cos α
Eq. (5.27) provides the correspondence between ellipses and the bivariate Gaussian kernels that they aim to represent. The stationary and non-stationary covariance structures based on elliptical kernels are illustrated in Fig. 5.5.
Finally, for practical application of the kernel convolution method based on ellipses centred at each location using empirical covariance functions, the following general sequence is proposed:
1. Partition the non-stationary study area into smaller parts that are as stationary as possible (e.g., east and west for the Darling Fault case (Chapter 6));
2. Estimate the empirical covariance functions in each partition, including empirical covariance map and directional empirical covariance functions (Section 3.5);
3. Set
Σi = ΣA(i) ,
where
A(i)
denotes the region in which location
is constructed for each region from the parameters,
{α, a, b}A(i)
i
falls and
ΣA(i)
(Figure 5.4), of the
anisotropic correlation structure estimated for the region;
4. Set the scaling factor
τ
for each ellipse to vary smoothly at each location over the entire
region following the observation value, where larger-value observations are attributed to smaller
τ
(Swall, 1999; Paciorek and Schervish, 2006). This fact comes from the
presence of the inverse of the covariance matrix of observations in LSC formulation (Eq. 2.3), where the scaling factor
τ
attributes weight to each observation in each point
in LSC;
5. Having the parameters for the ellipses at each location, the kernels are then estimated from Eq. (5.27);
6. Based on the kernels at each location, the covariances between any two points are estimated from the non-stationary covariance models in Table 5.2.
75
Figure 5.5: Different forms of the kernels de�ned by Eq. (5.27). Identical isotropic kernels representing stationary covariance functions (top-left); identical anisotropic kernels representing stationary anisotropic covariance functions (top-right); kernels varying in orientation representing non-stationary covariance functions (bottom-left); kernels varying in orientation and size representing non-stationary covariance functions (bottom-right) (adapted from Swall (1999))
76
5.4
Single point analysis of non-stationary versus stationary covariances
In this example, a simple, small, regular grid is provided to show how stationary and nonstationary covariances are computed in different ways and how they affect the predictions in each point by LSC differently.
Suppose that we want to estimate a quantity at point
p on a regular 20 m×20 m grid using
the �rst two rings of neighbouring data (a ring means the nearest neighbouring points in a square grid). To build the vector of observations, a set of 25 random numbers from a normal distribution with
µ = 0 and σ = 1 were selected.
Figure 5.6 shows the data set.
-1.666
1.189
0.726
1.067
-1.336
0.948
0.967
0.974
0.967
0.948
0.125
-0.038
-0.588
0.059
0.714
0.967
0.987
0.993
0.987
0.967
0.288
0.327 P 2.1832
-0.096
1.624
0.974
0.993
P
0.993
0.974
-1.147
0.175
-0.136
-0.832
-0.692
0.967
0.987
0.993
0.987
0.967
1.191
-0.187
0.114
0.294
0.858
0.948
0.967
0.974
0.967
0.948
Figure 5.6: (left) Stationary con�guration of a sample data set. (right) Gaussian stationary covariances between point
p and stationary data with d = 245 m
For computing covariances between point know the two parameters of variance
C0
p
and each neighboring point, we just need to
and correlation length
d.
In practical cases, these
two parameters are estimated by �tting empirical covariances to covariance models from Table 3.1 (Chapter 3), but here because of the randomness and limited extent of data, this usual procedure is impossible.
77
For this data set,
C0 = σ 2 = 1
d
is changed, until the minimum
eabsolute = Preal − Pprediction
(5.28)
is �xed and the value of
absolute error of
for point
p is reached at d = 245 m, or in other words limd−→245 eabsolute = minimum
The correlation length is rather large in this case, because a random set of data was used. Figure 5.6 shows stationary covariances for point
p based on a Gaussian stationary covari-
ance model. Note that stationary covariances just change with the distance of the points from
p
(symmetric characteristic of stationary covariance function); points with equal distances
from
p have the same covariances, and further points from p have the smaller covariances.
To make a picture of non-stationary data con�guration, two sets of random numbers from a normal distribution, 16 points with points (circles in Figure 5.7) with
µ = 0 and σ = 1 (showed by dots in Figure 5.7) and 9
µ = 0 and σ = 2 were selected.
Although this time the grid is non-stationary (Figure 5.7), standard stationary covariance modelling was �rst applied to estimate covariances between point
p
with the rest of the
grid. For computing stationary covariances, the same logic of the previous stationary grid applies. The Gaussian stationary covariances for point correlation length of
p with variance of C0 = σ 2 = 1 and
d = 210m is seen in Figure 5.7.
For computing non-stationary covariances, according to the procedure recommended at the end of Section 5.3, the parameters of ellipses (α,a and point. There is no sign of anisotropy in this data set, so
b)
should �rst be de�ned at every
α = 0 for all ellipses.
Considering
two groups of statistical parameters for this grid, two parameter groups should be de�ned, each attributed to points belonging to two separated regions (Figure 5.7).
78
1.337
-2.405
-0.313
0.515
2.83
2.382
-0.04
-3.208
-2.113
-1.61
1.058
-1.844 P 1.254
0.571
0.816
0.439
-4.341
-1.594
-0.4
0.712
-0.118
-2.021
-1.441
0.69
1.29
0.93
0.956
0.964
0.956
0.93
0.932
0.957
0.965
0.957
0.932
0.956
0.982
0.991
0.982
0.956
0.957
0.982
0.99
0.982
0.957
0.964
0.991
P
0.991
0.964
0.965
0.99
P
0.992
0.968
0.956
0.982
0.991
0.982
0.956
0.957
0.982
0.992
0.984
0.96
0.93
0.956
0.964
0.956
0.93
0.932
0.957
0.967
0.96
0.936
Figure 5.7: (top) Non-stationary con�guration of a sample data set. (bottom left) Stationary covariances between point ances between point
p and non-stationary data.
(bottom right) Non-stationary covari-
p and non-stationary data, elliptical kernels attributed to each location
are used to construct the non-stationary covariances
79
Here, like the stationary case, it is not possible to estimate non-stationary parameters from empirical covariances, so again the minimum absolute error for point
p used:
lim eabsolute = min a• −→ 210.01m
(5.29)
b• −→ 210.01m a◦ −→ 220.39m b◦ −→ 220.01m
In Figure 5.7, ellipses for each point are based on the parameters in Eq. (5.29). Accordingly, Gaussian non-stationary covariances (Table 5.2) of point
p with the rest of the grid are
printed in the centre of each ellipse.
For the stationary and non-stationary con�gurations, stationary covariances are decreased with a ratio of distance, which is characterised by the correlation length (Figures 5.6 and 5.7). For non-stationary covariance models, however, covariances also depend on the location. Figure 5.7 shows that non-stationary covariances between point
p
and points in the
bottom-right corner are higher than rest of the grid, re�ecting that the non-stationary covariance function accounts for non-stationary data. Table 5.3 shows the non-stationary covariance model improved the prediction of point decreased from
Table 5.3:
p in the non-stationary con�guration; eabsolute
1.4153 to 0.0331.
Results of the predictions for point
p
based on stationary and non-stationary
covariances Con�guration
Covariance
Parameter (m)
eabsolute
stationary
stationary
d = 245
0.1549
non-stationary
stationary
d = 210
1.4153
non-stationary
non-stationary
a• = 210.01
0.0331
b• = 210.01 a◦ = 220.39 b◦ = 220.01
80
Standard LSC, regardless of the stationarity or non-stationarity of the data, uses stationary covariances for the prediction.
This simulation showed, using stationary covariances for
non-stationary data in LSC causes underestimation or overestimation in the predictions. On the other hand, using non-stationary covariances based on the HSK method in LSC improved the prediction, when observation data was non-stationary.
5.5
Summary
In this chapter, the HSK method for non-stationary covariance functions was outlined. HSK uses spatially variant ellipse kernels to build non-stationary covariance functions.
It de-
scribed how HSK is a generalisation of stationary and anisotropic covariance functions that already exist in geodesy and geostatistics. HSK in spatial statistics applies the Bayesian view for designing elliptical kernels at each observation point by assuming of a separate statistical distribution for each elliptical parameter. In this chapter, an algorithm within the Frequentist framework which uses empirical covariances for designing elliptical kernels was proposed. Finally, through the simple examination of the stationary and non-stationary covariances for one point, the HSK method was visualized. The next chapter will utilise this approach for practical interpolation and prediction problems in geodesy.
81
6. APPLICATION OF NON-STATIONARY METHODS IN PHYSICAL GEODESY
The basic scheme of the HSK non-stationary covariances was presented in Chapter 5. This Chapter will address the implementation issues in order to apply and evaluate the HSK approach to practical geodetic problems. First, non-stationary covariances will be applied to a real case of gravity anomaly interpolation in a challenging area of Western Australia. Then, the non-stationarity of both the mean and covariance will be applied to the problem of optimising the gravimetric quasigeoid to the geometric quasigeoid in the Perth region with planar LSC. Finally, it will be examined how differently the non-stationarity of means and covariances affect LSC results.
6.1
6.1.1
Comparing stationary versus non-stationary LSC for interpolation
The Darling Fault's gravity �eld
This case-study refers to a standard interpolation problem, namely the construction of a regular gravity anomaly grid from scattered discrete point data. The focus is narrowed to a reasonably small regular grid of data
(1◦ × 1◦ ),
where a planar approximation is suf�cient
(cf. Moritz, 1980a).
Gravity observations over the Darling Fault near Perth in Western Australia (cf. Lambeck, 1987; Kirby, 2003) provide a good illustration of the application of non-stationary covariance functions in 2D LSC gridding (Figure 6.1). To a �rst approximation, this region is divided between low free air gravity anomalies in the west, and high free air gravity anomalies in the east (Figure 6.2), which shows the non-stationarity in this case-study data set.
82
Figure 6.1: (Left) Satellite image (Landsat 21189-01004-7, April 25, 1978) and (Right) schematic picture of the Darling Fault (NASA, 2008)
The expressions in physical geodesy for gravity �eld modelling imply knowledge of gravity quantities over the whole surface of the Earth (e.g., Stokes's integral, LSC). For local and regional gravity �eld modelling, it is common to use global geopotential models (GGM) to supply the long to medium wavelength part of the gravity quantities. All gravity quantities (free air gravity anomaly, geometric quasigeoid and gravimetric quasigeoid) in this chapter are reduced to residuals, which means the effect of a GGM up to a certain order and degree is subtracted from the data before the comparisons.
The residual free air gravity anomalies in Figure 6.2 based on the degree/order 360/360 expansion of EGM96 (Lemoine et al., 1998) are:
ε∆g = ∆g − ∆gEGM 96−360
(6.1)
83
where
¯ λ) = ∆gEGM 96−360 (r, φ, GMEGM 96 r2
P360 Pn n=2
m=0
¡a
EGM 96
r
¢n
∆GM + r2
¡ ¢ ¯ (n − 1) ∆C¯n,m cos mλ + S¯n,m sin mλ P¯nm (sin φ) (6.2)
r, φ¯ and λ are the geocentric radius, geocentric latitude and longitude; aEGM 96 is semi-major axis of EGM96; GMEGM 96 is the geocentric constant of EGM96; ∆C¯n,m , S¯n,m are the fully-normalized, unitless, spherical harmonic coef�cients of the Earth's gravitational potential which have been reduced by GRS80;
aref
is semi-major axis of the reference ellipsoid;
GMref
is the geocentric constant of the reference ellipsoid;
∆GM = GMEGM 96 −GMref
¯n,m differ from those of the EGM96, and the coef�cients of ∆C
if at all, for even zonal harmonics only (i.e.
n = 2, 4, 6, 8, · · · )
GMEGM 96 aEGM 96 n ¯ ( ) [Cn,0 ]ref ∆C¯n,0 = [C¯n,0 ]EGM 96 − GMref aref
(6.3)
Symbols are the same as Featherstone (1992). The reference ellipsoid used in this chapter is GRS80 (Moritz, 1980b).
The residual free air gravity anomaly prediction used the eight nearest neighbouring points with stationary and non-stationary covariance functions. This choice is consistent with many other LSC-based predictions (e.g., Deutsch and Journel, 1998; Featherstone and Sproule, 2006).
However, the mean value of the LSC observation vector in each neighbourhood
is different in this dataset (cf. Fig. 6.2), which violates the LSC assumption of a zero mean (Moritz, 1980a). As such, 100 mGal was deliberately added to all the residual free air anomalies to make them positive over the whole region, giving an always-positive and non-zero mean value of the observation vector in each neighbourhood. Therefore, all points tested are affected approximately equally by the non-stationarity of the mean. This strategy allows to examine the non-stationarity of covariances in LSC, where the non-stationarity of the mean is approximately equal, thus not contaminating the interpretations as would be the case for spatially varying means for each neighbourhood.
84
It is acknowledged that terrain-reduced gravity data are normally used for gridding because they are generally smoother. Residual free air anomalies were deliberately chosen here because they pose more of a challenge in terms of non-stationarity to LSC than smoothed terrain-reduced gravity data. However, applying terrain reductions to the Darling Fault gravity data will still not make them stationary. In this area, the Bouguer slab reduction is around 30 mGal over the fault and the terrain correction is less than 2 mGal east of the Fault (Kirby and Featherstone, 2002). Compared to the 100 mGal difference in free air gravity anomalies across the Fault (Figure 6.2), terrain reductions will not remove the non-stationarity in this case.
115˚ 30'
116˚ 00'
mGal 160 -32˚ 30'
-32˚ 30' 140 120 100 80
-33˚ 00'
-33˚ 00'
60 40 20
115˚ 30'
116˚ 00'
Figure 6.2: Residual free air gravity anomalies (in mGal) after adding 100 mGal across the Darling Fault, Western Australia, showing non-stationarity where they are systematically lower to the west than the east [Mercator projection]. The fault runs north-south, approximately following the maximum horizontal gradient of the gravity data.
85
6.1.2
Global stationary covariances
Structural analysis starts with the estimation of a stationary global empirical covariance function using the whole data-set (cf. Section 3.2 ) in Figure 6.2. A stationary Cauchy covariance model was �tted to the empirical covariances using EMPCOV (Tscherning, 1991b). Because of the large systematic difference between free air gravity anomalies in the east and west, the correlation length is long
dˆ = 0.3◦ and the variance is large C0 = 2287.889 mGal2
(cf. Fig. 6.3 and Table 6.1). As such, a stationary global empirical covariance function is inappropriate for this non-stationary test data-set.
2500
2000
Empirical Model
covariance(mGal2)
1500
1000
500
0
−500
−1000
0
0.2
0.4 0.6 Distance(Degree)
0.8
1
Figure 6.3: Stationary Cauchy model and empirical covariances of residual free air gravity anomalies for the whole Darling Fault test area (cf. Figure 6.2)
6.1.3
Partitioned stationary covariances
Next, the partitioning approach (Section 5.3) was used, where the data were divided between eastern and western sections separated along the well-de�ned Darling Fault (cf. Fig. 6.2). Figure 6.4 shows the stationary Cauchy covariance models and empirical covariances in the east and west computed from EMPCOV. The objective of presenting each covariance is to evaluate (and visualise) the extent to which the covariance function varies locally (i.e., nonstationarity of the data set versus when treated as a whole; Fig. 6.3).
86
200
100
80
150
100
50
40
20
0
−50
Empirical Model
60
covariance(mGal2)
covariance(mGal2)
Empirical Model
0
0
0.2
0.4 0.6 Distance(Degree)
0.8
1
−20
0
0.2
0.4 0.6 Distance(Degree)
0.8
1
Figure 6.4: Partitioned stationary Cauchy empirical covariances for the eastern (left) and western (right) parts of the Darling Fault test area
The key point is that the covariances vary markedly across the region (cf. Fig. 6.2). From Table 6.1, the western region has a greater variance and correlation length.
These signi�cant differences show further that a global stationary covariance function is an inadequate representation of the spatial variations across this case-study region. Also, recall that the use of partitioned stationary covariance functions will introduce the problem of how to patch them at the boundary (cf. Tscherning et al., 1987; Knudsen, 2005).
While this
partitioned approach delivers some improvement over the use of global variances, it will be shown that the non-stationary approach is still better.
The parameters of the empirical Cauchy covariance functions for each of the global, and east and west partitions are summarised in Table 6.1. They will be used in Section 6.1.5 to help design the elliptical kernels at each location for the non-stationary covariance modelling.
87
Table 6.1: Cauchy model parameter estimates for the global and east-west partitioned stationary covariances
6.1.4
mean(mGal)
C0 (mGal2 )
dˆ (◦ )
whole area
85.008
2287.889
0.3
west only
41.665
186.964
0.09
(dmax )
east only
134.386
100.088
0.04
(dmin )
Anisotropy
To detect anisotropy in the case-study region, empirical covariances for different azimuths
(0◦ , 45◦ , 90◦ , 135◦ ) (Figure
6.6) were calculated. The method developed by Forsberg (1986),
using the Fourier transform and the so-called anisotropy index, could be used. Instead, however, the more simple and straightforward methods that are popular in geostatistics and introduced in Section 3.5 were used. A covariance map (i.e., empirical covariances in 2D) for the region is plotted in Figure 6.5, which can be useful to highlight anisotropy (cf. Deutsch and Journel, 1998). From this covariance map, there is anisotropy approximately in the northsouth direction (azimuth
20◦ ).
Figure 6.6 also demonstrates that, except for
α = 20◦ ,
the
empirical covariances are largely similar in terms of the shape.
Covariance map 21.000
2600.00 2200.00 1800.00 1400.00
Ylag
1000.00 600.000 200.000 -200.000 -600.000 -1000.00
0.0 0.0
Xlag
21.000
2 Figure 6.5: Covariance map of the residual free air gravity anomalies (in mGal ) over the Darling Fault test area [linear projection]
88
2500
2500
2000
covariance(mGal2)
covariance(mGal2)
2000
1500
1000
500
1000
500
0
0
0.2
0.4
0.6 0.8 Distance(Degree)
1
1.2
−500
1.4
2500
2500
2000
2000
1500
1500
covariance(mGal2)
covariance(mGal2)
0
1500
1000
500
0
−500
6.1.5
0.2
0.4
0.6 0.8 1 Distance(Degree)
1.2
1.4
1.6
0
0.2
0.4
0.6 0.8 1 Distance(Degree)
1.2
1.4
1.6
1000
500
0
0
0.2
0.4
0.6 0.8 Distance(Degree)
1
1.2
−500
1.4
Figure 6.6: Empirical covariances for azimuth left),
0
0◦
(upper left),
45◦
(upper right),
90◦
(lower
135◦ (lower right)
Non-stationary covariances
For building non-stationary covariances based on the HSK method, the algorithm at the end of Section 5.3 was applied. The main and critical stage in HSK method is designing parameters of ellipses at each observation point to enforce the non-stationarity or spatial
89
variation in non-stationarity covariance functions. Three elliptical parameters of and the scaling factor
τ
{α, a, b}
should be de�ned at each observation point.
Estimation of the elliptical parameters at each observation point is the most challenging part of this thesis. In modern spatial statistics, pre-statistical analysis of data is suggested �rst, then de�ning a pre-statistical distribution for each parameter using Markov Chain Monte Carlo (MCMC) sampling methods to estimate parameters of ellipses at each point.
This
method is very complicated and needs a full Bayesian approach. Thus in this thesis, the traditional way of estimating the empirical covariance functions was chosen to determine the parameters of ellipses. This approach is rather rational and depends on the experimental parameters like the number of observations, and how the data is partitioned into subregions.
Partitioning of the region to 3 or 4 subregions was not suitable in this example, because the density of the residual free air gravity anomalies was not enough to achieve an unbiased estimation of anisotropy azimuth in each subregion, and also it is dif�cult to decide how to partition the data (cf. Section 4.2.2 on problems with partitioning). A common solution in geostatistics is to estimate the empirical directional covariances and make a decision on anisotropy, calculate the prediction values and then assess the prediction result. After all, if there is any bias in the prediction result, the blame should be on inaccurate choice of covariance parameters or in this case elliptical parameters, which should be changed and LSC prediction should be repeated again.
In this example, the presence of the Darling Fault has caused the anisotropy in the residual free air gravity anomalies, but the direction of Fault itself can't de�ne the anisotropy in the residual free air gravity anomalies. The estimation of the anisotropy needs the statistical analysis of the residual free air gravity anomalies.
The only anisotropy was detected by
covariance map and directional covariance functions (Figs. 6.5 and 6.6) in this region was the
α parameter is �xed to 20◦ for the entire √ dmax and region. From the estimated correlation lengths in Table 6.1, the values a = .3 = √ b = .2 = dmin are chosen to elongate the elliptical kernels in the α = 20◦ azimuth. Some near-north-south anisotropy azimuth
20◦ .
Thus, the
conditions from Swall (1999) and Paciorek and Schervish (2006) are considered to design the
τ
factor in each observation point:
90
•
Larger-value observations are attributed smaller
τ
and vice versa. Table 6.1 shows
there is smaller correlation length for the rougher western region. The choice of the size of the ellipses is indirectly proportional to the modulus of the gradient; or in other words, a shorter correlation length distinguishes a rougher �eld. This choice agrees with the presence of the inverse of the covariance matrix of observations in LSC (Eq. 2.3), where the scaling factor
τ
attributes weight to each observation at each point in
LSC;
• τ
can not be zero;
τ = 0 causes a singularity in the inversion of the covariance matrix
of observations in LSC;
• τ
should vary smoothly across the region; sudden changes in
τ
will cause discontinu-
ities in the LSC result;
•
In this data set, because scaling factor of
τ
0 < τ < 1,
a = .3 =
√
dmax
and
b = .2 =
√
should also be less than 1. The scaling factor
dmin τ
are less than 1, the
should be in the range
so as not to scale the ellipses to be larger than the correlation lengths
found in Table 6.1. Numerical tests showed much smaller or larger and
τ
values make
b ineffective in LSC and gives biased result.
The size of the elliptical kernels are shrunk from east to west by decreasing the from
a
1 to 0.6 to satisfy all the above conditions.
in Fig. 6.7.
τ
scale factor
The resulting elliptical kernels are plotted
91
115˚ 30'
116˚ 00'
mGal 160 -32˚ 30'
-32˚ 30' 140 120 100 80
-33˚ 00'
-33˚ 00'
60 40 20
115˚ 30'
116˚ 00'
Figure 6.7: Elliptical kernels attributed to each location and used to construct the nonstationary covariances for LSC interpolation. The underlying image shows the residual free air gravity anomalies after adding 100 mGal [Mercator projection].
α has been �xed at 20◦
for all ellipses.
For this non-stationary case, the Cauchy non-stationary model in Table 5.2 was applied. As seen in Table 5.2, unlike stationary covariance models that are a function of non-stationary covariance model is a function of the elliptical kernels
Σ
d
and
C0 ,
the
at each location
(Eq. 5.27). In this case, these kernels have the elliptical forms in Fig. 6.7. For estimation of covariances between two points
i and j , the ellipse parameters are inserted for each point
from Fig. 6.7 into Eq. (5.27) and then the non-stationary Cauchy model of Table 5.2. The residual free air gravity anomalies were then interpolated using non-stationary covariances in LSC.
92
6.1.6
Interpolation error estimates
Two types of error were computed to assess the effectiveness of using non-stationary covariances in LSC in comparison with stationary covariances for the residual free air gravity anomaly interpolation.
1.
The �rst is the formal standard (or internal) error of LSC as obtained from the error
covariance matrix. This is given by
σεF∆g = where
p
C0 − C P Q (C P P 0 )−1 (C P Q )0
(6.4)
C0 is the signal variance, C P Q is the cross-covariance of the predicted point Q and the
observation point
P , and C P P
0
is the auto-covariance of observation points (Moritz, 1980a).
2. The second is the prediction error estimated from a cross-validation approach (Featherstone and Sproule, 2006), where one point is omitted from each LSC prediction, then the predicted value at that point is compared with the observed value via:
σεE∆g = ε∆g obs − ε∆g pred
(6.5)
That is, each test point used is not used in each LSC prediction, and the statistics computed for all data points in the test area. While time-consuming, this does give an external error estimate.
Figures 6.8 and 6.9 compare the internal errors from LSC covariance propagation and the external errors from cross-validation for stationary and non-stationary LSC predictions, respectively, of the residual free air gravity anomalies. Note the different scales in each panel. Tables 6.2 and 6.3 give a summary of the respective statistics for all points in the test data-set.
Firstly, Tables 6.2 and 6.3 and Figs. 6.8 and 6.9 together illustrate the slight superiority of using non-stationary covariances over the stationary covariances for this test region, which has already been shown to be anisotropic and non-stationary (Sections 6.1.3 and 6.1.4). As such, the application of non-stationary covariances to non-stationary data is more appropriate (and better) than assuming a stationary covariance.
93
115˚ 30'
116˚ 00'
115˚ 30'
116˚ 00'
mGal -32˚ 30'
mGal 8
-32˚ 30'
-32˚ 30'
1.6
-32˚ 30' 1.4
6 1.2 4 1.0 2 0.8 0 0.6 -33˚ 00'
-2
-33˚ 00'
-33˚ 00'
-33˚ 00'
0.4
-4 0.2 -6 0.0
115˚ 30'
116˚ 00'
115˚ 30'
116˚ 00'
Figure 6.8: Stationary LSC interpolation errors from external cross-validation (left) and from internal LSC covariance propagation (right) [Mercator projection] 115˚ 30'
116˚ 00'
115˚ 30'
116˚ 00'
mGal -32˚ 30'
-32˚ 30'
mGal 0.40 4
-32˚ 30'
-32˚ 30' 0.35
2
0.30 0.25
0
0.20 -2 -33˚ 00'
-33˚ 00'
-4
0.15 -33˚ 00'
-33˚ 00'
0.10 0.05
-6
0.00
115˚ 30'
116˚ 00'
115˚ 30'
116˚ 00'
Figure 6.9: Non-stationary LSC interpolation errors from external cross-validation (left) and from internal LSC covariance propagation (right) [Mercator projection]
Another key observation from Tables 6.2 and 6.3 and Figs. 6.8 and 6.9 is that the internal errors from the error propagation in LSC are smaller than the external errors from the crossvalidation. In particular, note the need to use substantially different scales in the left and
94
right panels of Figs. 6.8 and 6.9. This is of some concern, showing that the internal LSC error propagation may be far too optimistic by nearly an order of magnitude.
However,
there is a marginally better agreement between the internal and external errors for the nonstationary case.
Table 6.2: Statistics from the external cross-validation of the differences between observed and predicted residual free air gravity anomalies (units in mGal) No. points
Min
Max
Mean
STD
RMS
stationary covariance
529
-6.343
8.063
-0.165
1.180
1.192
non-stationary covariance
529
-6.191
5.827
-0.018
1.130
1.131
Table 6.3: Statistics of internal errors from LSC covariance propagation (units in mGal) No. points
Min
Max
Mean
STD
RMS
stationary covariance
529
0.369
1.347
0.412
0.115
0.428
non-stationary covariance
529
0.001
0.302
0.015
0.033
0.087
In Fig. 6.9, the magnitude of errors (both internal and external) increase along the fault (cf. Fig. 6.2), which shows that the non-stationary covariance modelling (especially for the internal errors) better re�ects the dif�culty in accurately interpolating data in areas of steep gradients. Basically, the internal error estimates, even though too optimistic in relation to the external error estimates, do re�ect the worse prediction that is intuitively expected along the Darling Fault. On the other hand, the stationary covariance modelling tends to `smear out' the error estimates, thus not re�ecting the fault's actual location.
6.2
Considering non-stationarity for the optimisation of a gravimetric quasigeoid compared with GPS-levelling points
Section 6.1 presented the implementation of the HSK method for non-stationary covariance modelling for the interpolation of residual free air gravity anomaly data by LSC. Nevertheless, There are many questions relating to the optimum means of applying this method in
95
geodesy which are still unanswered:
•
How can non-stationary covariance functions be applied when LSC is used in physical geodesy for the prediction of different functionals of the gravity �eld from each other?
•
How much does accounting for non-stationarity of the mean affect LSC results?
•
How should elliptical kernels be de�ned for the prediction points? For the case of interpolation, when observation and prediction are the same quantity, the statistical analysis of observation is suf�cient, but for the case of prediction of the geoid from gravity anomalies, how should the elliptical kernels be designed for the prediction points.
The study area in this section is the same as in Section 6.1, where the Darling Fault causes non-stationarity in gravity anomalies across the region. This example looks at the prediction of the gravimetric quasigeoid from free air gravity anomalies in the Perth region by planar LSC. This quasigeoid will be compared with other gravimetric quasigeoids that have been estimated in this region before to examine the performance of planar LSC in comparison with other methods.
After that, the non-stationary methods will be applied to planar LSC, to study whether they improve the gravimetric quasigeoid determination in this region. The non-stationary methods for the mean and covariances will be applied separately to examine if non-stationarity of the mean is more critical than non-stationarity of covariances in LSC or vice versa. The model for the non-stationary of the mean (introduced in Section 4.2.1) will be �rst applied to the planar LSC. Then the non-stationary method of HSK for covariances will be implemented in the planar LSC for the residual gravimetric quasigeoid estimation. This time, the elliptical kernels in the observation points (gravity anomalies) are the same as in Section 6.2, although when designing elliptical kernels for the prediction points, the residual geometric quasigeoid at GPS-levelling points will be used. This means that the residual geometric quasigeoid at the prediction points will be used in non-stationary covariance functions to optimise the residual gravimetric quasigeoid in this region. Thus, this section starts with a review of geometric quasigeoid at GPS-levelling points in the Perth region.
96
6.2.1
Geometric quasigeoid in the Perth region
There is an algebraic transform where the orthometric height ellipsoidal height
(H)
is subtracted from the
(h) to give the geoid-ellipsoid separation (N ), or the normal height (HN )
is subtracted from the ellipsoidal height to give the quasigeoid-ellipsoid separation or height anomaly
(ζ) (e.g., Featherstone, 2008).
Since the normal-orthometric height
(HN ) system is
used in Australia, the quasigeoid has to be used for consistency:
. ζgeo = h − HN
(6.6)
This is what will be regarded as the geometric quasigeoid in this section. The approximation in Eq. (6.6) is because the different heights are measured along different lines (Figure 6.10).
Figure 6.10: Ellipsoidal
(h),
normal
(HN )
and orthometric height
(H), g0
and
γ0
are the
gravity on the geoid and the normal gravity on the ellipsoid respectively (adapted from Torge (2001)).
97
There are 99 GPS-AHD points in this test area (Fig.6.11), which are referenced to GRS80 ellipsoidal heights in the ITRF92 (epoch 1994.0) reference frame. This data set has been used before by e.g., Featherstone (2000), Tziavos and Featherstone (2001), Claessens et al. (2001) and Kirby (2003). However, there are several problems with this data set:
•
For the original adjustment of levelling data, this region was divided into the Perth Metropolitan Zone and a `buffer' zone, the max difference between adjustment of these two sets is 4mm (cf. The Australian Height Datum (AHD), 1979).
•
A comparison of around 200 ITRF2005 and ITRF92 ellipsoidal heights across Western Australia by Featherstone (2008) shows a mean difference of
3 cm, but it reached 18
cm in one case.
•
There is a north-south tilt in the Australian Height Datum (AHD) (e.g., Featherstone, 2004; Featherstone and Filmer, 2008). This tilt will be studied in this section.
EGM2008 (Pavlis et al., 2008) complete to degree and order 2160 is used to compute residual geometric quasigeoid:
εζgeo = ζgeo − ζEGM 08−2160
(6.7)
where
¯ λ) = ζEGM 08−2160 (r, φ,
∆GM rγ
+
∆W + γ (6.8)
GMEGM 08 rγ
and
¡ aEGM 08 ¢n ¡ ¢ ¯ ¯n,m cos mλ + S¯n,m sin mλ P¯nm (sin φ) ∆ C m=0 r
P2160 Pn n=2
∆W = VEGM 08 − Vref , is the difference between gravitational potential of EGM08 and
gravitational potential on the surface of the reference ellipsoid (here GRS80);
γ
is normal
gravity on the surface of the reference ellipsoid; the rest of the symbols are the same as for Eq. (6.2). Figure 6.12 show the residual geometric quasigeoid (εζgeo ) at the GPS-AHD points.
98
115˚30'
116˚00'
116˚30'
0.08
52
23
−31˚30'
−31˚30'
67 59
55 42
17 18
20
22 66
93 56 41 95
58
43
0.12
97
92
53
21
91
71
0.2
96
26
0.08
68
70
87
6
57
74 35 6
36
0.1
33
65
0.12
99
90
76
7
15
5
0.1 6
54
69 31 50 2 .1 49 0 25 37
3
51
1 75
0.16
−32˚00'
32
45 44 16
11
27
24
94
12 0. 28 29 16
34 89 12
88
40
0.
39
−32˚00'
86
0.2
8
2
4
60
77
14 10
63 98
79
19 78 72
13 62
61
9
46
8
0.12
0.0
85 30
48 47
38 64
80
81
−32˚30'
−32˚30'
82
04
0.
84
73 83
−33˚00' 115˚30'
116˚00'
−33˚00' 116˚30'
Figure 6.11: Distribution of the 99 GPS-AHD points around Perth (white boxes show station number), with the contours of the GPS-quasigeoid-AHD residuals (εζgeo ) referenced to EGM2008-2160 (contour interval 0.02 m) [Mercator projection]; For 99 GPS-levelling points, the statistics of 0.051m.
εζgeo
are: Maximum 0.311m, Minimum -0.019m, Mean 0.126m, STD
99
0.35
0.35
0.3
0.25 Geometric residual (m)
0.25 Geometric residual (m)
y = − 0.0418 + 4.9719 2 R = 0.0162
0.3 y = 0.0791 x + 2.6575 R2 = 0.2026
0.2 0.15 0.1
0.2 0.15 0.1
0.05
0.05
0
0
−0.05 −33
−32.5
−32 −31.5 ITRF92 latitude (degrees)
−0.05 115.5
−31
116 ITRF92 longitude (degrees)
116.5
Figure 6.12: Linear regression of the 99 GPS-quasigeoid-AHD residuals (εζgeo ) in meters versus (left) latitude and (right) longitude in degrees referenced to EGM2008-2160. From the gradient in degrees, this gives a tilt of
∼ 0.71 mm/km in latitude and ∼ −0.38 mm/km
in longitude.
Linear regressions in latitude and longitude (Figure 6.12) show north-south and east-west tilts in the AHD data, which has been mentioned by ,e.g., Featherstone (2004) and Featherstone and Filmer (2008). The north-south tilt with an LAB (e.g., Martinez and Martinez, 2002)) of tilt of
∼ 0.01.
of
∼ 0.20 is more signi�cant than the east-west
The north-south tilt is equivalent to
to kilometres (one degree is
R2 value (regression analysis in MAT-
∼ 0.71 mm/km when converting degrees
∼ 111 km at the equator), which roughly agrees with the value
∼ 0.81 mm/km determined by Featherstone (2004) for 48 GPS-levelling points in south-
west of Western Australia. Featherstone (2004) used AUSGeoid98 instead of EGM2008 in Eq. (6.7). Featherstone and Filmer (2008) reached the much lower north-south tilt of
∼ 0.27
mm/km with State-wide set of 243 GPS-levelling points in Western Australia, but they used the GRACE-augmented version of AUSGeoid98 (Featherstone, 2007).
100
6.2.2
Gravimetric quasigeoid determination with planar LSC
Gravimetric and geometric quasigeoid determination in the Perth region has attracted several studies (e.g., Featherstone and Alexander, 1996; Friedlieb et al., 1997; Allister and Featherstone, 2001; Kirby, 2003).
There have been two main problems in the Perth region for
gravimetric quasigeoid determination: one is the lack of suf�cient data, and the other is the presence of the Darling Fault, which causes a steep quasigeoid gradient, rising by as much as 38 cm over only 2 km (e.g., Friedlieb et al., 1997; Featherstone, 2000).
New data sets are available now (new gravity data released by Geoscience Australia and new geopotential coef�cients (EGM2008) up to degree and order 2160 (Pavlis et al., 2008)) to improve the residual gravimetric quasigeoid determination in this region. The data sources used in this region for the LSC-based residual gravimetric quasigeoid determination are:
•
Irregularly spaced gravity data from Geoscience Australia, release July 2008, with an average separation of 3 km (Fig.6.13);
•
The 1-arc-minute DNSC2008 (Andersen and Knudsen, 2008) grid of free air anomalies for the marine area (Fig.6.13);
•
EGM2008 geopotential coef�cients;
•
The terrain corrections computed by Kirby and Featherstone (2002).
Figure 6.14 is a �owchart illustrating the steps in the gravimetric quasigeoid determination with planar LSC in this Section. Three different grid sizes of were tested for computation.
The grid size of
20 × 20
10 × 10 , 20 × 20
and
50 × 50
appeared to be suf�cient in terms
of accuracy and time ef�ciency. The terrain corrections computed by Kirby and Featherstone (2002) were added to the free air gravity anomalies. The grdmath command in the GMT package (Smith and Wessel, 1990) was used to add terrain corrections to the free air gravity anomalies (LSC or speci�cally non-stationary LSC was not used because the irregular data caused a singularity problem in numerical inversion of covariance matrix of free air gravity anomalies). By adding the terrain correction to the free air gravity anomalies,
101
115˚
116˚
117˚
mGal −31˚
−31˚
120 90 60 30
−32˚
−32˚
0 −30 −60 −90
−33˚
−33˚
115˚
116˚
−120
117˚
Figure 6.13: Coverage of free air gravity anomalies for residual quasigeoid determination, which is a combination of irregular land data from Geoscience Australia released in 2008, and 1-arc-minute DNSC offshore [Mercator projection]
the terrain-corrected free air gravity anomalies, called Faye anomalies, are obtained (Torge, 2001). After that, the effect of a spherical harmonic expansion (EGM2008-2160) is removed from the data using the program HARMONIC-SYNTH (Holmes and Pavlis, 2006). Finally the input residual Faye anomalies for planar LSC is provided in an area bounded between
[−33.6◦
− 30.4◦
114.4◦
an area bounded between
117.5◦ ]
[−32.5◦
for gravimetric residual quasigeoid determination in
− 31.5◦
115.5◦
116.5◦ ] to avoid any edge effects (cf.
Kirby, 2003).
Planar LSC is applied to the residual Faye anomalies to estimate the residual gravimetric quasigeoid:
εζgra = Cεζ ,ε∆g C−1 ε∆g ,ε∆g ε∆g
(6.9)
For the auto-covariance and cross-covariance of Cεζ ,ε∆g and Cε∆g ,ε∆g the planar covariance functions of Eqs. 3.24 and 3.25 from Forsberg (1987) were used which are related by law of covariance propagation (see Section 3.4.2). Thus, the two are entirely consistent.
102
Figure 6.14: The planar LSC algorithm for optimising the gravimetric quasigeoid to the geometric quasigeoid
103
The residual gravimetric quasigeoid quasigeoid
εζgeo
εζgra
will be compared with the residual geometric
later on, and non-stationary methods will be used to optimise the residual
gravimetric quasigeoid to the residual geometric quasigeoid.
The empirical covariances of residual Faye anomalies rameters of
C²∆g ,²∆g
C0 , D
and
d
ε∆g
are essential to estimate the pa-
(de�ned in Section 3.4) of analytical auto-covariance function of
and cross-covariance function of Cεζ ,ε∆g .
The program GPFIT in GRAVSOFT
(Forsberg and Tscherning, 2008) gives the parameters of the statistical model (covariance function) to be �tted to the empirical covariances to run the planar LSC (Figure 6.15 and Table 6.4).
covariance(mGal^2)
15
10
5
0
−5 0
20
40
60
80
100
120
140
distance(km) Figure 6.15: Fitting of the empirical covariance of residual Faye anomalies
ε∆g
(solid line)
with planar covariance model of Forsberg (1987) (dashed line)
Table 6.4: Parameters describing the �tting of the empirical covariance of the residual Faye anomalies
ε∆g
with the planar covariance model of Forsberg (1987) No. of data
Mean(mGal)
C0 (mGal2 )
D(km) d(km)
9118
-0.83
10.51
4
8
104
Empirical covariances of the residual Faye anomalies anomalies in this data set tend to be zero after of
400
400 (∼ 74 km) (Figure 6.15).
Hence, the planar LSC uses a neighbourhood search
around each point (of 99 points GPS levelling data set) to compute the gravimetric
residual quasigeoid
εζgra .
Figure 6.16 illustrates how the vector of observation changes for
two different points. The resulting gravimetric residual quasigeoid in comparison with other methods are discussed in the next section. 115˚
116˚
117˚
−31˚
115˚
−31˚
mGal
116˚
117˚
−31˚
−31˚
mGal
15
15
10
10
5 −32˚
−32˚ *
−33˚
−33˚
115˚
116˚
117˚
Figure 6.16: Neighbourhood of
5 −32˚
−32˚
0
0
−5
−5
−10
−10
−15
*
−33˚
115˚
400
−33˚
117˚
116˚
around prediction points (marked with a black point),
the underlying colour shows the residual Faye anomalies anomalies
ε∆g
referenced to
EGM2008-2160 [Mercator projection]
6.2.3
Comparing different gravimetric quasigeoids for the Perth region
Figure 6.17 shows the residual gravimetric quasigeoids computed by different methods in the Perth region. All of the residual gravimetric quasigeoids in Figure 6.17 are referenced to the EGM96-360 geopotential model. The same data used by Kirby (2003) was used for residual gravimetric quasigeoid determination for the planar LSC and GEOCOL in Figure 6.17.
−15
105
Figure 6.18 shows the difference of each pair. (AUSGeoid98 − Kirby (2003)), (AUSGeoid98
− GEOCOL) and (AUSGeoid98 − Planar LSC) show the same features on land and offshore. The contour lines for these three are much higher offshore than the land. This is because the gravity data used in AUSGeoid98 included erroneous ship-track gravity observations (cf. Featherstone, 2009), whereas Kirby (2003), planar LSC and GEOCOL used the same satellite altimetry data offshore with no ship-track data. Although both GEOCOL and planar LSC use LSC for the residual gravimetric quasigeoid, they do not give the same result, because they use different covariances. In Table 6.5, GEOCOL shows the biggest STD for
εζgeo − εζgra , which proves the ineffectiveness of the global stationary covariances used for a locally non-stationary data set.
Table 6.5: Statistics of the
εζgeo − εζgra
referenced to EGM96-360 for 99 GPS-AHD points
in metres. Method
Maximum
Minimum
Mean
STD
AUSGeoid98 (Featherstone et al., 2001)
0.258
-0.301
-0.600
0.128
Kirby (2003)
0.294
-0.330
0.156
0.540
GEOCOL
0.241
-0.596
-0.219
0.986
Planar LSC
0.186
-0.373
-0.149
0.102
Figure 6.19 shows the differences in the residual geometric and the residual gravimetric quasigeoid (εζgeo
− εζgra )
for the 99 points GPS levelling data set which computed with
planar LSC and new data set discussed in Section 6.2.2.
106
115˚30' −31˚30'
115˚45'
116˚00'
116˚15'
116˚30' −31˚30'
115˚ 45'
116˚ 00'
116˚ 15'
116˚ 30' -31˚ 30'
-0.6
−31˚45'
-31˚ 45'
−32˚00'
-32˚ 00'
-32˚ 00'
−32˚15'
-32˚ 15'
-32˚ 15'
-31˚ 45'
−0.4
−31˚45'
115˚ 30' -31˚ 30'
0.4
0.2
0
0.2
-0.4
-0.2
0. 4
0.4
−0.4
0
−32˚00'
-0.4
-0.2
0
0.2
0
−0.2
0.2
−0.2 0 0.2
-0.6
0.6
−32˚15'
−32˚30' 115˚30' 115˚ 30' -31˚ 30'
115˚45' 115˚ 45'
116˚00' 116˚ 00'
−32˚30' 116˚30' 116˚ 30' -31˚ 30'
116˚15' 116˚ 15'
-31˚ 45'
-31˚ 45'
-32˚ 30' 115˚ 30' 115˚ 30' -31˚ 30'
115˚ 45' 115˚ 45'
116˚ 00' 116˚ 00'
-32˚ 30' 116˚ 30' 116˚ 30' -31˚ 30'
116˚ 15' 116˚ 15'
-31˚ 45'
-31˚ 45'
0
-0.2
-0.4
-0.2 0 0.2
0.2
-32˚ 15'
-0.6
-32˚ 15'
-0.4
0 0.2
-0.4
-0.4
116˚ 00'
-32˚ 00'
-32˚ 00'
0.2
-32˚ 15'
115˚ 45'
-32˚ 00'
-0.2
0
-0.2
-32˚ 00'
-32˚ 30' 115˚ 30'
0
-0.2
0.4
116˚ 15'
-32˚ 30' 116˚ 30'
-32˚ 30' 115˚ 30'
-32˚ 15'
115˚ 45'
116˚ 00'
116˚ 15'
-32˚ 30' 116˚ 30'
Figure 6.17: Gravimetric AUSGeoid98 (Featherstone et al., 2001) (upper left), quasigeoid from Stokes's formula (Kirby, 2003) (upper right), quasigeoid from the GEOCOL program (lower left), quasigeoid from planar LSC (lower right), all relative to EGM96-360 (contour interval 0.1 m) [Mercator projection]
107
115˚30' −31˚30'
115˚45'
116˚15'
116˚30' −31˚30'
115˚30' −31˚30'
115˚45'
116˚00'
116˚15'
116˚30' −31˚30'
6 0.1
0.2
116˚00'
0.0
8
−0 .0
0.1
8
0
−31˚45'
2
0.2
24
0.
0.
−31˚45'
2
0.1
6
0.2
−31˚45'
−31˚45'
2 0.1
6
0.1 2
0.1
8
.0 −0
0.2
2
0.2 4 0.2 8
0.1 0.2
0.1
0 0..32 28 00. .2 16
−32˚00'
6
0
0.0 4 0.0 8
8 0.4
0.12
0.4 4
28 00.1.0
0.3
6
0 0.1 .2 6
4
4
0. 36 0. 32
6
0.40.3
0.2
0.2
0.52 0.48 0.44 0.4
−32˚00'
2
−32˚00'
2824 0. 0.
3 0.
−32˚00'
0.04
0.16
4
4
.0
−0
0.2
28
0. 2 0.1
6 0.1
−32˚15'
−32˚15'
0.2
−32˚15'
−32˚15'
0.24
0.04
0.32
0.12 0.08
116˚00' 116˚00'
−32˚30' 116˚30' 116˚30' −31˚30'
116˚15' 116˚15'
115˚45' 115˚45'
−32˚30' 116˚30' 116˚30' −31˚30'
116˚15' 116˚15' −0.04
2
0.2
0
08
0.0
−0.2
0.
0.12 0.16
−31˚45'
116˚00' 116˚00'
−0.1
0.24
−32˚30' 115˚30' 115˚30' −31˚30'
.08
115˚45' 115˚45'
−0
−32˚30' 115˚30' 115˚30' −31˚30'
8
0.1 0.1 2 6
−31˚45' 0.0 4
−31˚45'
−31˚45'
0.16
−0
0.16
.16
0.04
0
0.1 2
8
4
0.0
−0.12
0 0.0
.08
−32˚00'
4 0.2
0.2
4
0 0..232 8
0.2
36 4 0.4 0.
−0
−32˚00'
0.12
0.4
−0.0 4
0.2
48 0.
−0.08
−32˚00'
−0 .0
4
0.08
0.1
6
−32˚00'
0.2 4
6
0.1
0.2
−32˚15'
2 0.16
−32˚15'
−32˚15'
0.2
0.2
6
1 0.
0.24
0.
−32˚15'
0.16
−32˚30' 115˚30' 115˚30' −31˚30'
115˚45' 115˚45'
116˚00' 116˚00'
−32˚30' 116˚30' 116˚30' −31˚30'
116˚15' 116˚15'
−32˚30' 115˚30' 115˚30' −31˚30'
115˚45' 115˚45'
116˚00' 116˚00'
0
0
−0 .08
4 .12
−0.0
−0.1
0.08
0.16
0.12
0.08
4
0.04
0.0
2
−32˚15'
.08
−32˚15'
−32˚00'
0
2 0.1
−32˚00'
−0
4
−32˚00'
.1 −0
0.08
0.04
0
−0.0
.04
−0
8
0.04 0 −0.04 −0.0 8
0.12
8
4 0.0 0 4
−0.0
0.0
−0
2
0
−32˚00'
−31˚45'
4
0.0
.04
−31˚45'
.0 −0
−31˚45'
−0
−31˚45'
−32˚30' 116˚30' 116˚30' −31˚30'
116˚15' 116˚15'
0
0.04
−32˚15'
−32˚15' −0.04
0
8
0 0.
−0
.0
8
0.12
−32˚30' 115˚30'
115˚45'
116˚00'
−32˚30' 116˚30'
116˚15'
−32˚30' 115˚30'
115˚45'
116˚00'
116˚15'
−32˚30' 116˚30'
Figure 6.18: Gravimetric quasigeoid differences from different methods: (AUSGeoid98 Kirby (2003)) (upper left), (AUSGeoid98 nar LSC) (middle left), (Kirby (2003) LSC) (lower left) and (GEOCOL [Mercator projection]
−
−
− GEOCOL) (upper right), (AUSGeoid98 − Pla-
− GEOCOL) (middle right), (Kirby (2003) − Planar Planar LSC) (lower right) (contour interval 0.02 m)
108
115˚30'
116˚00'
−31˚30'
116˚30'
−31˚30'
0
0.04
0.04
2 0.1
0.0
8
08
0.08
0
0.
0.12
−32˚00'
0.1
2
−32˚00'
4 0.0
0.08
08 0.
0.04
0
−32˚30'
−32˚30'
0
−0
.04
−33˚00' 115˚30'
116˚00'
−33˚00' 116˚30'
Figure 6.19: Contours of the difference in the geometric and gravimetric quasigeoids (εζgeo −
εζgra ) referenced to EGM2008-2160 (contour interval 0.02 m) [Mercator projection]; For 99 GPS-levelling points, the statistics of Mean 0.126m, STD 0.037m.
εζgeo −εζgra are: Maximum 0.217m, Minimum 0.052m,
109
The statistics of
εζgeo −εζgra in Figure 6.19 shows that the residual geometric and the residual
gravimetric quasigeoids agree, although there are 2 points (point numbers 22 and 52 in Fig. 6.13 along the coast) with differences of more than 15 cm. There are two reasons for these large differences. The altimeter data are poor near the coast which cause planar LSC overdetermine or under-determine the residual gravimetric quasigeoid for points along the coast (cf. Deng and Featherstone, 2006). Another reason is residual geometric quasigeoid in 99 GPS-levelling points are referenced to ITRF92. If these points were referenced to ITRF2005, they might show less difference to the residual gravimetric quasigeoid. In the next section, non-stationary methods will be used to minimise this difference (εζgeo
− εζgra ) at each GPS-
levelling point.
6.2.4
Using non-stationary mean and covariance methods to optimise a gravimetric quasigeoid to a geometric quasigeoid
There are several reasons why geodesists are interested in matching gravimetric and geometric quasigeoids. A precise model of the quasigeoid not only enables us to convert GPS ellipsoidal heights to normal heights and vice versa, but also plays an important role in combining levelling data with GPS measurements to study vertical crustal movements for a longer period of time (e.g., Milbert and Dewhurst, 1992; Kuroishi et al., 2002). The long list of papers for just Australia proves the importance of this subject (e.g., Kearsley, 1988; Friedlieb et al., 1997; Featherstone, 1998, 2000; Featherstone et al., 2001; Featherstone and Sproule, 2006; Featherstone and Kuhn, 2006; Soltanpour et al., 2006; Featherstone, 2008).
For the �tting of a gravimetric quasigeoid to a geometric quasigeoid, two approaches have been applied in geodesy. Recent papers (e.g., Featherstone, 1998, 2000; Featherstone et al., 2001; Featherstone and Sproule, 2006; Soltanpour et al., 2006), apply a two stage method:
•
Gravimetric quasigeoid determination on a grid;
•
Estimation of the difference in the gravimetric and geometric quasigeoids for GPSlevelling points and de�ning a surface to interpolate the difference onto the quasigeoid grid.
110
These two stages are independent, and different methods could be used for gravimetric quasigeoid determination in the �rst stage (e.g., LSC, Stokes's formula) and interpolation (e.g., LSC, polynomials, splines) in the second stage.
In some of the older literature (e.g., Kearsley, 1988), the �tting is performed as a part of gravimetric quasigeoid determination. Kearsley (1988) reached the optimum cap size of the ring-integration approach by optimising the gravimetric quasigeoid to the geometric quasigeoid at GPS-levelling points. The same idea is used here, but using non-stationary covariance functions to optimise the gravimetric quasigeoid to the geometric quasigeoid. In Section 6.2.3, the planar covariance functions of Forsberg (1987) were used to estimate gravimetric quasigeoid at the GPS-levelling points. These planar covariance functions consist of three physical parameters (Table 6.4), and relate the free air gravity anomaly to the quasigeoid in LSC.
When using non-stationary covariance functions, the statistical elliptical parameters are added to the planar covariance functions. These parameters should be de�ned for every observation (gravity) and prediction (GPS-levelling) point. It was discussed in Section 6.1.5 how to design elliptical parameters for the observation points. In the following, it will be explained how to design the parameters of the ellipses at prediction points to reach a prescribed difference (εζgeo
6.2.4.1
− εζgra ) between residual gravimetric and geometric quasigeoids.
Non-stationarity of mean
It was mentioned in Section 2.2 that the standard LSC formulation is based on the zero mean assumption of the vector of observations (Moritz, 1980a). Table 6.6 demonstrates the mean and variance of the observation vector (residual gravity anomalies
ε∆g ) for a representative
sample of the 99 GPS-levelling prediction points. It shows how much the mean value of the observation vector (ε∆g ) is offset from zero, and how the observation vector is nonstationary: the bigger variance indicates that data is more offset from the mean, thus, it is used as a coarse measure of non-stationarity.
111
The non-zero mean formulation of Deutsch and Journel (1998) introduced in Section 4.2.1 is used to account for the non-stationary of the mean at each point. Thus, the LSC Eq. (6.9) based on the zero mean assumption changes to
εζgra = Cεζ ,ε∆g C−1 ε∆g ,ε∆g ε∆g + (1 −
X
(Cεζ ,ε∆g C−1 ε∆g ,ε∆g ))m(ε∆g )
(6.10)
Table 6.6: A typical sample of the mean and variance of the observation vectors for the GPS-levelling prediction points. Point No.
Mean(mGal)
C0 (mGal2 )
53
-1.066
15.413
54
-1.916
20.323
58
-1.861
16.261
59
-1.571
15.410
60
-0.435
14.506
61
-0.129
12.576
62
-0.441
15.094
63
-0.878
16.451
76
-0.722
13.590
77
-1.560
18.873
78
-1.010
18.518
79
-0.159
12.444
80
-0.328
14.553
81
-1.518
20.073
82
0.082
11.105
83
-0.522
13.335
84
-1.288
17.916
112
In Eq. (6.10),
m(ε∆g ) is the mean value of the residual gravity anomalies used for the pre-
diction at each point (ie., the mean of the neighbourhood of
400 around the prediction points
in Figure 6.16). If the mean is zero in Eq. (6.10), this degenerates the usual LSC formulation of Eq. (6.9).
Changes in residual gravimetric quasigeoid heights based on the non-stationary mean LSC of Eq. (6.10) were small (millimetres). Because in this case the mean values of the residual gravity anomaly of the observation vectors for each point are reasonably small (cf. Table 6.6), the zero stationary assumption of the mean does not affect the result much; although for points with larger mean values, the changes were larger. This method might be much more effective in the cases when the zero stationary assumption of the mean is more strongly contradicted, that is, when there are much larger mean values. The general Kriging method of Reguzzoni et al. (2005), which accounts for non-zero mean in LSC, also concluded the same. Therefore, accounting for non-stationary of the mean in planar LSC formulation did not change signi�cantly the residual gravimetric quasigeoid at the GPS-levelling points.
6.2.4.2
Non-stationarity of covariances
The same approach of the HSK kernel convolution method used for the interpolation of the residual free air gravity anomalies over the Darling Fault (Section 6.1) will be applied for non-stationary covariances for planar residual gravimetric quasigeoid prediction. This means that the Euclidean distance of
2 = x2 + y 2 = rij
h
i xi y i
−1
1 0 0 1
xi
yi
(6.11)
for building covariance matrices of Cζ,∆g and C∆g,∆g is replaced with
Q2ij = x2 + y 2 =
h xi yi
¸−1 x i (Σi + Σj ) 2 yi
i ·1
(6.12)
113
where
1 2
Σi = τ
a 0
cos α
sin α
(6.13)
− sin α cos α
0 b
Now, the main task is to design elliptical kernels or de�ne elliptical parameters scaling factor
τ
{α, a, b} and
of each observation and prediction point. Recalling that here, the observa-
tion points are residual Faye anomalies and prediction points are 99 GPS-levelling residual geometric qusigeoids. Unlike the interpolation example in Section 6.1, where the observation and prediction points were the same (residual free air gravity anomalies), here elliptical parameters are designed for observation and prediction points separately. Covariance map 21.000
14.000
Ylag
10.000
6.000
2.000
-2.000 0.0 0.0
Xlag
21.000
Figure 6.20: Covariance map of the residual Faye anomalies anomalies
ε∆g
referenced to
2 EGM2008-2160 (in mGal ) [linear projection]
Empirical covariance functions in different directions and covariance map of residual Faye anomalies were calculated to detect anisotropy directions (Figures 6.21 and 6.20).
The
covariance map of residual Faye anomalies (Figure 6.20) shows two main directions of anisotropy. One is azimuth
0◦ ,
which is caused by presence of Darling Fault (north-south
direction) in the Perth region. The residual Faye anomalies along the Darling Fault show values of more than 5 mGal, which are marked in red in Figure 6.22. Other anisotropy is along azimuth
150◦ , which is caused by negative residual Faye anomalies in Figure 6.22.
114
12
12
10
10
d ~ 6.66 km
6
4
0
0
−2
−2 0.2
0.4
0.6
0.8 1 1.2 Distance(Degree)
1.4
1.6
1.8
2
0
12
12
10
10 d ~ 3.88 km
6
4
0
0
−2
−2 0.4
0.6
0.8 1 1.2 Distance(Degree)
1.4
1.6
1.8
2
12
10
10
d ~ 4.44 km covariance(mGal2)
4
0
0
−2
−2 0.6
0.8 1 1.2 Distance(Degree)
1.4
1.6
1.8
2
1.6
1.8
2
0.4
0.6
0.8 1 1.2 Distance(Degree)
1.4
1.6
1.8
2
1.6
1.8
2
d ~ 4.44 km
4
2
0.4
1.4
6
2
0.2
0.2
8
6
0
0.8 1 1.2 Distance(Degree)
d ~ 5.55 km
0
12
8
0.6
4
2
0.2
0.4
6
2
0
0.2
8 covariance(mGal2)
covariance(mGal2)
4
2
8
covariance(mGal2)
6
2
0
d ~ 3.88 km
8 covariance(mGal2)
covariance(mGal2)
8
0
0.2
0.4
0.6
0.8 1 1.2 Distance(Degree)
1.4
Figure 6.21: Empirical covariances for the residual Faye anomalies anomalies ε∆g referenced to EGM2008-2160 for azimuth: (middle right),
0◦
(upper left),
30◦
120◦ (lower left) and 150◦ (lower right)
(upper right),
60◦
(middle left),
90◦
115
Directional empirical covariance functions (Figure 6.21) show the same anisotropy directions. In directional empirical covariances, two pairs of perpendicular azimuths are searched to de�ne minor and major axis of the ellipses.
1. The azimuths
0◦
and
90◦
d0◦ = 6.66km and d90◦ = √ {α = 0◦ , a = 6.66km, b =
show the correlation lengths of
5.55km, which de�nes the parameters of ellipses √ 5.55km} for observations points along the Darling Fault. 150◦
60◦
d150◦ = 4.44km and d60◦ = √ √ 3.88km, de�ne the parameters of ellipses {α = 150◦ , a = 4.44km, b = 3.88km}.
2. Azimuths of
and
with correlation lengths of
These ellipses attributed to the points with Faye anomalies with less than -5 mGal, which are marked with dark blue in Figure 6.21.
There is no anisotropic evidence for residual Faye anomalies between -5 mGal and 5 mGal, thus the circles with the elliptical parameters of {α
= 0◦ , a = b =
p
(d0◦ + d60◦ + d90◦ + d150◦ )/4 =
5.13km} were attributed to these points. For gravimetric quasigeoid determination, however, estimation of elliptical kernels is more complicated, because unlike the �rst example of this Chapter, the ellipses have to be de�ned for negative and positive residual Faye anomalies. Comparing the size of ellipses (a
× b) in
each category
•
For residual Faye anomalies more than 5 mGal, mainly along the Darling Fault:
{α = 0◦ , a = •
√
6.66km, b =
5.55km}: a × b = 6.0797km2
For residual Faye anomalies between -5 mGal and 5 mGal:
{α = 0◦ , a = b = •
√
p (d0◦ + d60◦ + d90◦ + d150◦ )/4 = 5.13km}:a × b = 5.1300km2
For residual Faye anomalies less than -5 mGal:
{α = 150◦ , a =
√
4.44km, b =
√
3.88km}:a × b = 4.1506km2
116
115˚
116˚
117˚
mGal −31˚
−31˚ 10 5
−32˚
−32˚
0 −5 −10
−33˚
−33˚
115˚
116˚
−15
117˚
Figure 6.22: Elliptical kernels attributed to each observation point used to construct the nonstationary auto covariance matrix of Cε∆g ,ε∆g . The underlying image shows the residual Faye anomalies referenced to EGM2008-2160 [Mercator projection]
117
shows that the size of ellipses already describes the non-stationarity of residual Faye anomalies in this region. The negative residual Faye anomalies with the magnitude of more than 5 mGal shows the shortest correlation length, which mainly belong to points to the west of the Darling Fault, when the residual Faye anomalies suddenly drop to negative values from positive residual Faye anomalies between 5 mGal to 10 mGal along the Fault. Therefore there is no need to vary the scaling factor of
τ
across the region. Thus the scaling factor of
τ
was �xed to 1.
The next stage is to de�ne the elliptical kernels at the 99 GPS-levelling points. In this case, the number of GPS-levelling points are not enough to calculate the covariance map or directional empirical covariances to detect any anisotropy in the residual geometric quasigeoid. Thus the parameters of
{α = 0◦ , a = 1km, b = 1km} were �xed equally for all of the el-
liptical kernels at all GPS-levelling points. The scaling factor of GPS-levelling point, until the difference of
εζgeo − εζgra
τ
is allowed to vary at each
is obtained for a threshold of 0.17
metre in each GPS-levelling point. This threshold is arbitrary. To start the optimising loop in Figure 6.14, an initial value is needed for the scaling factor of point. Again the scaling factor the scaling factor of
τ
τ
in each GPS-levelling
τ , should satisfy all of the conditions in Section 6.1.5; thus,
is set to vary between
0 < τ < 1.
However there is one difference between variation of scaling factor of with observation points. The scaling factor
τ
τ
in prediction points
at the prediction points contributes to cross-
covariance matrix of Cεζ ,ε∆g , which is directly used in planar LSC Eq. (6.9), not inversely; therefore GPS-levelling points with larger residual geometric quasigeoids are attributed to larger scaling factors of
τ.
Remembering that in the real case, there is not any signal or
information at the prediction points, but in the special case of GPS-levelling points, we have the value of the geometric residual quasigeoid, which desirably should be exactly equal to gravimetric quasigeoid estimated by LSC at these prediction points. In this case, elliptical kernels in cross-covariance matrix of Cεζ ,ε∆g have the role of weights in LSC. The larger ellipses give larger value of residual gravimetric quasigeoids where there is larger a geometric quasigeoid value at the GPS-levelling points.
118
115˚30'
116˚00'
−31˚30'
116˚30'
−31˚30'
m
0.3 −32˚00'
−32˚00'
0.2
0.1
0.0 −32˚30'
−32˚30'
−33˚00' 115˚30'
116˚00'
−33˚00' 116˚30'
Figure 6.23: Elliptical kernels attributed to each prediction point used to construct the nonstationary cross-covariance matric of Cεζ ,ε∆g . The color of the ellipses shows the residual geometric heights
εζgeo
referenced to EGM2008-2160 [Mercator projection]
119
Figure 6.23 shows elliptical kernels at 99 GPS-levelling points for the last iteration [third] loop for the threshold of 17 cm where the results in Table 6.7 are obtained.
The number of iterations depend on the value of the threshold and the initial values for elliptical kernels at GPS-levelling points. A higher threshold can be used to get a reasonable number of iterations (2 or 3 times) or vice versa. The more GPS-levelling points available, the better initial elliptical parameters can be estimated.
Table 6.7: Statistics of the (εζgeo
− εζgra ) referenced to EGM2008-2160 in metres for the 99
GPS-levelling points Method
Maximum
Minimum
Mean
STD
LSC with planar stationary covariances
0.217
0.052
0.126
0.037
LSC with planar non-stationary covariances
0.166
-0.108
0.020
0.048
Table 6.7 shows LSC with planar non-stationary covariances decreased the difference of (εζgeo
− εζgra )
at each GPS-levelling points. It means the residual gravimetric quasigeoid
in each point has the difference of less than 17 cm with residual geometric quasigeoid as expected. Just the STD in non-stationary case is more than stationary case. The STD would be improved too if a lower threshold was set for the optimisation process.
Using non-stationary covariances introduced extra statistical parameters in addition to the stationary covariance parameters of (C0 , D, d) in Table 6.4, which are parameters of elliptical kernels
(a, b, α, τ )
at the observation and prediction points. These extra parameters were
used to optimise the residual gravimetric quasigeoid to residual geometric quasigeoid. In other words, prediction points have the role of control points, the statistical parameters of non-stationary covariance function change at these points while the difference of residual geometric and gravimetric quasigeoid reaches a threshold at each GPS-levelling point. The unique advantage of non-stationary covariances lies in controlling the threshold at each GPSlevelling point individually. By changing a parameters of an elliptical kernel at a speci�c
120
GPS-levelling, the value of the residual gravimetric quasigeoid changes at that point, and others are not affected.
6.3
Summary
In this Chapter, non-stationary covariance functions are used for two different applications of LSC in gravity �eld modelling. The study area was the Perth region in Western Australia, where the Darling Fault produces one of the most evident non-homogenous gravity �elds in the world.
First, the problem of gravity anomaly interpolation with LSC was solved in the Perth region by non-stationary covariance functions using the kernel convolution method. The results with non-stationary covariance functions were better than standard LSC in terms of formal errors and cross-validation against data not used in the interpolation, demonstrating that the use of non-stationary covariance functions can improve upon standard (stationary) LSC for interpolation.
In the second example, both non-stationary covariance functions and a non-stationary model of the mean were applied for residual gravimetric quasigeoid determination by planar LSC. Non-stationary model of the mean did not change the LSC result. However, elliptical kernels in non-stationary covariance functions, used to create an iterative optimisation loop to decrease the difference of the residual gravimetric quasigeoid and residual geometric quasigeoid at GPS-levelling points.
121
7. SUMMARY, CONCLUSIONS AND OUTLOOK
In this thesis, new solutions for determining non-stationary mean and covariance functions have been introduced from the geostatistics and spatial statistics literature and modi�ed for least-squares collocation (LSC) in gravity �eld applications: gravity anomaly interpolation and optimising of the gravimetric quasigeoid to the geometric quasigeoid. Section 7.1 contains a short summary of the approach and derived solutions. The main conclusions resulting from this research are summarised in Section 7.2, and based on these conclusions, an outlook to possible future research directions is provided in Section 7.3.
7.1
Summary
The main objective of this research was to derive solutions for dealing with non-stationarity in gravity �eld modelling using LSC (Chapter 1).
Chapter 2 explained how LSC is different from various Kriging systems in geostatistics in terms of the mean assumption of observation. LSC assumes the observation vector has a zero mean which automatically causes the stationarity assumption of the mean. Through comparing LSC with Kriging in, the superior capabilities of LSC over Kriging in deal with different functionals of gravity �eld in both local and global scales are identi�ed.
Chapter 3 discussed the literature related to covariance computation and modelling for LSC. The paradox of stationary assumptions of mean and covariances in LSC and non-stationary nature of gravity data were discussed.
Chapter 4 discussed different methods in the three disciplines of geodesy, geostatistics and spatial statistics for dealing with non-stationarity of mean and covariances, and argued why some were inapplicable to LSC, though the kernel convolution method was applicable.
122
The kernel convolution method (Chapter 5) borrowed from the discipline of spatial statistics (Higdon et al., 1999), was modi�ed to provide non-stationary covariance functions for geodetic 2D LSC. Conceptually, these are elliptical kernels that orient and scale according to the level of anisotropy and non-stationarity in the data. The non-stationary mean formulation of Deutsch and Journel (1998) introduced in Chapter 4 is used to account for non-stationarity of the mean in LSC.
Non-stationary and stationary 2D LSC were used to interpolate residual (to EGM96) free air gravity anomalies over the Darling Fault in Western Australia, where this particular gravity �eld functional is highly anisotropic and non-stationary (Chapter 6). From internal and external error estimates, the non-stationary covariance models in LSC were consistently better than stationary LSC for interpolation: they also gave more realistic error estimates in areas where the �eld varies signi�cantly over short distances. Then, both non-stationarity of mean and covariance have been applied to the problem of the optimising of the gravimetric quasigeoid to geometric quasigeoid, to test how differently non-stationarity of mean and covariance affect the LSC result (Chapter 6). The mean was not important in this case, but the non-stationary covariances could be scaled to get an arbitrarily good �t to GPS-levelling points.
7.2
Conclusions
The most important conclusions that can be drawn from the work presented in this thesis are:
1. Advantages of LSC over other BLUE solutions
Comparison of other BLUE solutions with LSC in Chapter 2 proved the unique capabilities of LSC. Kriging systems, the most common in the geoscience disciplines, has only been applied to the interpolation and griding at local scales. Literature review of Chapter 2 showed that LSC in physical geodesy is capable to solve a broader range of problems:
•
Estimation of different functionals from each other
123
•
Merging of different functionals to estimate another functional
•
Global and local scale solutions
2. Disadvantages of LSC with respect to other BLUE solutions
The lack of advanced statistical analysis in LSC applications for physical geodesy, has led to problems such as non-stationarity to be neglected. A review of non-stationary solutions in Chapter 4 proved that there are a broad range of statistical methods mostly based on Bayesian statistics, which were never applied in physical geodesy. Modern statistical theories recommend the use of likelihood-based or Bayesian methods for estimating the parameters of a spatial random �eld (SRF).
It shall be mentioned again that approximation solutions like LSC are highly dependent on pre statistical analysis of input data. The better knowledge of statistical parameters gives a more realistic solution from LSC.
3. Improvement of LSC results with new non-stationary methods
Numerical tests in Chapter 6 showed:
•
The impact of non-stationary covariances on prediction. Cross-validation against data not used in the interpolation demonstrated that the use of non-stationary covariance functions can improve upon standard (stationary) LSC;
•
Impact of non-stationary covariances on error prediction. The results with non-stationary covariance functions were more realistic than standard LSC in terms of formal errors;
•
Impact of non-stationarity of mean for optimising of residual gravimetric quasigeoid to residual geometric quasigeoid. Non-stationary model of mean did not change the LSC result for the case study in Chapter 6;
•
Impact of non-stationarity of covariances for optimising of residual gravimetric quasigeoid to residual geometric quasigeoid. Non-stationary covariance functions was used
124
to create an iterative optimisation loop to decrease the difference of the residual gravimetric quasigeoid and residual geometric quasigeoid at GPS-levelling points.
7.3
Outlook
There are several potentially valuable future studies arising form this work.
1. Modi�cation of Bayesian non-stationary covariance modelling for LSC.
The kernel convolution method of Higdon et al. (1999) for modelling non-stationary covariance functions, which was expanded upon by Paciorek and Schervish (2006), forms an important part of the non-stationary solution in LSC. The prospects of the kernel convolution method for LSC have become feasible, as shown with practical applications in Chapter 6.
Instead of estimating the parameters of non-stationary covariance function by traditional empirical covariances, the Bayesian framework for prior speci�cation of the distributional of the mean parameters and covariance functions can be used.
2.
Improvement of Bayesian non-stationary covariances for different functionals on the
globe.
The covariance function models, including non-stationary methodologies (HSK method in this thesis), borrowed from spatial statistics, have two main obstacles:
•
They are de�ned for small-scale data-sets that can only currently be applied in planar approximation.
•
These covariance models are suitable for prediction solutions like interpolation, extrapolation, gridding or mapping.
In geodesy, however, the superiority of LSC is the determination of a functional expression instead of the estimation of a single quantity or even combination of different functionals.
125
In gravity �eld determination, for example, estimation of geoid heights can come from the merging of gravity anomalies and disturbances with satellite data.
In Paciorek (2003) there is a possible development of kernel convolution approach for nonstationary covariances on the sphere; The HSK covariance model can be extended for use on the sphere,
S2 ,
and other non-Euclidean spaces. On the sphere, however, the equiva-
lence of translation and rotation causes dif�culty in de�ning kernels that produce correlation behaviour varying with direction (Paciorek, 2003).
The harmonicity of HSK covariance model should be studied further for the expansion of non-stationary covariances for different quantities of the gravity �eld for points having spherical coordinates. The existing non-stationary methods in spatial statistics should be expanded on the sphere to implement non-stationary LSC on a global scale. That is the reason why HSK covariance model has just been applied to planar covariance functions in this thesis (Chapter 6), not for the spherical covariance functions of Tscherning and Rapp (1974) on a global scale.
3. Non-stationary LSC applications
LSC based on non-stationary covariances can improve spatial predictions in several applications in geodesy and other geoscience disciplines:
•
Chapter 6, showed two real case studies in physical geodesy while non-stationary covariances improved LSC results.
There are numerous other LSC applications in
geodesy where non-stationarity should not be ignored, such as the treatment of satellite altimeter data (e.g., Fieguth et al., 1995), the recovery of the gravity �eld from a combination of different satellite data sets (e.g., Knudsen and Tscherning, 2007);
•
Spatio-temporal systems, non-stationary methods introduced in spatial statistics for local scales and developed in geodesy for global scales provide a new vision to research on non-stationarity in time and space simultaneously for spatio-temporal interpolation and prediction problems like time-space variable gravity modelling in geodesy.
REFERENCES
Abd-Elmotaal, H. A. 1998. An ef�cient technique for the computation of the gravimetric quantities from geopotential earth models.
In Geodesy on the Move, Volume 119, pp.
182187. IAG Symposia Series, Springer, Berlin, Germany. ´ am, J., H. Denker, A. S´ ´ 1995. The Hungarian contribution to the Ad´ arhidai, and Z. Szabo determination of a precise European reference geoid. In Gravity and Geoid, Volume 113, pp. 579587. IAG Symposia Series, Springer, Berlin, Germany.
Adjaout, A. and M. Sarrailh 1997. A new gravity map, a new marine geoid around Japan and the detection of the Kuroshio current.
Journal of Geodesy 71(12), 725735, doi:
10.1007/s001900050139.
� 2004. Wiener �lters and collocaAlbertella, A., F. Migliaccio, M. Reguzzoni, and F. Sanso tion in satellite gradiometry. In V Hotine-Marussi Symposium on Mathematical Geodesy, Volume 127, pp. 3237. IAG Symposia Series, Springer, Berlin, Germany.
Alberts, B. and R. Klees 2004. A comparison of methods for the inversion of airborne gravity data. Journal of Geodesy 78(1-2), 5565, doi: 10.1007/s001900030366x.
Alberts, B. A., P. Ditmar, and R. Klees 2007.
A new methodology to process airborne
gravimetry data: advances and problems. In Dynamic Planet, Volume 130, pp. 251258, doi: 10.1007/978354049350138. IAG Symposia Series, Springer, Berlin, Germany.
Allister, N. A. and W. E. Featherstone 2001.
Estimation of Helmert orthometric heights
using digital barcode levelling, observed gravity and topographic mass-density data over part of the Darling Scarp, Western Australia. Geomatics Research Australasia 75, 2552.
Amos, M. J., W. E. Featherstone, and J. Brett 2005. Crossover adjustment of New Zealand marine gravity data, and comparisons with satellite altimetry and global geopotential models.
In Gravity, Geoid and Space Missions, Volume 129, pp. 266271. IAG Symposia
Series, Springer, Berlin, Germany.
127
Andersen, O. B. and P. Knudsen 1998.
Global marine gravity �eld from the ERS-1 and
GEOSAT geodetic mission altimetry. Journal of Geophysical Research 103(C4), 8129 8137.
Andersen, O. B. and P. Knudsen 2008.
The DNSC08 global mean sea surface and
bathymetry, EGU-2008, Vienna, Austria, April.
Andersen, O. B., P. Knudsen, and C. C. Tscherning 1996. Investigation of methods for global gravity �eld recovery from the dense ERS-1 geodetic mission altimetry. In Global Gravity Field and Its Temporal Variations, Volume 116, pp. 218226. IAG Symposia Series, Springer, Berlin, Germany.
Arabelos, D. 1998.
On the possibility to estimate ocean bottom topography from marine
gravity and satellite altimeter data using collocation. In Geodesy on the Move, Volume 119, pp. 105118. IAG Symposia Series, Springer, Berlin, Germany.
Arabelos, D. and P. Papaparaskevas 2003. Estimation of error covariance functions using gravity gradiometry and surface gravity data. In Gravity and Geoid 2002, Proceedings of the 3rd Meeting of the International Gravity and Geoid Commission, pp. 358363. Ziti publications, Thessaloniki, Greece.
Arabelos, D. and C. C. Tscherning 1990. Simulation of regional gravity �eld recovery from satellite gravity gradiometer data using collocation and FFT. Journal of Geodesy 64(4), 363382, doi: 10.1007/BF02538409.
Arabelos, D. and C. C. Tscherning 1995. Regional recovery of the gravity �eld from satellite gravity gradiometer and gravity vector data using collocation.
Journal of Geophysical
Research 100(B11), 2200922015.
Arabelos, D. and C. C. Tscherning 1998. Calibration of satellite gradiometer data aided by ground gravity data. Journal of Geodesy 72(11), 617625, doi: 10.1007/s001900050201.
Arabelos, D. N., , and I. N. Tziavos 1995. Gravity and geoid in the Mediterranean from a common adjustment of ERS-1 and TOPEX altimeter data. In Gravity and Geoid, Volume 113, pp. 376385. IAG Symposia Series, Springer, Berlin, Germany.
128
Arabelos, D. N., R. Forsberg, and C. C. Tscherning 2007.
On the a priori estimation of
collocation error covariance functions: a feasibility study. Geophysical Journal International 170(20), 527533.
Arabelos, D. N. and C. C. Tscherning 2003.
Globally covering a-priori regional gravity
covariance models. Advances in Geosciences 1, 143147.
Arabelos, D. N., C. C. Tscherning, and M. Veicherts 2007. External calibration of GOCE SGG data with terrestrial gravity data: a simulation study. In Dynamic Planet, Volume 130, pp. 337344, doi: 10.1007/978354049350150. IAG Symposia Series, Springer, Berlin, Germany.
Arabelos, D. N. and N. Tziavos 1998. Gravity-�eld improvement in the Mediterranean Sea by estimating the bottom topography using collocation. Journal of Geodesy 72(3), 136 143.
Armstrong, M. 1998. Basic Linear Geostatistics. Germany: Springer-Verlag Berlin Heidelberg.
Atkinson, P. M. and C. D. Lloyd 2007. Non-stationary variogram models for geostatistical sampling optimisation: an empirical investigation using elevation data.
Computers
&
Geosciences 33, 12851300, doi: 10.1016/j.cageo.2007.05.011.
Banerjee, S., B. P. Carlin, A. E. Gelfand, and B. P. Carlin 2004. Hierarchical Modeling and Analysis for Spatial Data. Florida, USA: Chapman Hall/CRC.
Barthelmes, F., R. Dietrich, and R. Lehmann 1991. Use of point masses on optimised positions for the approximation of the gravity �eld. In Determination of the Geoid, Volume 106, pp. 484493. IAG Symposia Series, Springer, Berlin, Germany.
Barzaghi, R., A. Borghi, B. Ducarme, and M. Everaerts 2003. Quasi-geoid BG03 computation in Belgium. Newton's Bulletin (1).
Barzaghi, R. and G. Bottoni 1991. Fast collocation. In Determination of the Geoid: Present and Future, Volume 106, pp. 442443. IAG Symposia Series, Springer, Berlin, Germany.
129
Barzzaghi, R., A. Borghi, and G. Sona 1998. New covariance models for local applications of collocation. In IV Hotine-Marussi Symposium on Mathematical Geodesy, Volume 122, pp. 91101. IAG Symposia Series, Springer, Berlin, Germany.
¨ Ba� si´ c, T., M. Brki´ c, and H. Sunkel 1999.
A new, more accurate geoid for Croatia.
Physics and Chemistry of the Earth, Part A: Solid Earth and Geodesy 24(1), 6772, doi: 10.1016/S14641895(98)00012X.
� and D. Sguerso 1991. ITALGEO'90: progress report Benciolini, B., A. Manzino, F. Sanso, June'90. In Determination of the Geoid: Present and Future, Volume 106, pp. 201213. IAG Symposia Series, Springer, Berlin, Germany.
Bjerhammar, A. 1964.
A new theory of geodetic gravity.
Technical Report 243, Royal
Institute of Technology, Stockholm, Sweden.
Blais, J. A. R. 1982. Synthesis of Kriging estimation methods. manuscripta geodaetica 7(4), 325352.
Blais, J. A. R. 1984. Generalized covariance functions and their applications in estimation. manuscripta geodaetica 9(4), 307322.
Bl´ azquez, E. B., A. J. Gil, G. Rodriguez-Caderot, C. de Lacy, and J. J. Ruiz 2003. A gravimetric geoid in Andalusia, results and precision estimates. In Gravity and Geoid 2002, Proceedings of the 3rd Meeting of the International Gravity and Geoid Commission, pp. 213216. Ziti publications, Thessaloniki, Greece.
Bottoni, G. P. and R. Barzaghi 1993. Fast Collocation. Bulletin G´ eod´ esique 67(2), 119126, doi: 10.1007/BF01371375.
Bouman, J. and R. Koop 2003. Calibration of GOCE SGG data combining terrestrial gravity data and global gravity �eld models. In Gravity and Geoid 2002, Proceedings of the 3rd Meeting of the International Gravity and Geoid Commission, pp. 275280. Ziti publications, Thessaloniki, Greece.
¨ Bouman, J., R. Koop, R. Haagmans, J. Mueller, N. Sneeuw, C. C. Tscherning, and P. Visser 2005. Calibration and validation of GOCE gravity gradients. In A Window on the Future of Geodesy, Volume 128, pp. 265270. IAG Symposia Series, Springer, Berlin, Germany.
130
Box, G. E. P. and G. M. Jenkins 1976. Time Series Analysis: Forecasting and Control, 2rd Edition. San Francisco, USA: Holden-Day.
� and G. Venuti 2003. A discussion on the Wiener-Kolmogorov Brovelli, M. A., F. Sanso, prediction principle with easy-to-compute and robust variants. Journal of Geodesy 76(11), 673683, doi: 10.1007/s0019000202923.
Brown, R. G. and P. Y. C. Hwang 1997. Introduction to Random Signals and Applied Kalman Filtering with Matlab Exercises and Solutions, 3rd Edition. New York, USA: John Wiley & Sons Inc.
Brozena, J. M. 1992. The Greenland aerogeophysics project-Airborne gravity, topographic and magnetic mapping of an entire continent.
In From Mars to Greenland: Charting
gravity with space and airborne instruments - Fields, tides, methods, results, Volume 110, pp. 203 214. IAG Symposia Series, Springer, Berlin, Germany.
Burki, B. and U. Marti 1991. The Swiss geoid computation: a status report. In Determination of the Geoid: Present and Future, Volume 106, pp. 220229. IAG Symposia Series, Springer, Berlin, Germany.
Catalao, J. and M. J. Sevilla 1998. Geoid studies in the north-east Atlantic (Azores-Portugal). In Geodesy on the Move, Volume 119, pp. 269274. IAG Symposia Series, Springer, Berlin, Germany.
Chil� es, J. P. and P. Del�ner 1999. Geostatistics. New York, USA: John Wiley & Sons Inc.
Claessens, S. J. 2006.
Solutions to ellipsoidal boundary value problems for gravity �eld
modelling. Ph. D. thesis, Department of Spatial Sciences,Curtin University of Technology, Perth, Australia.
Claessens, S. J., W. E. Featherstone, and F. Barthelmes 2001. Experiences with point-mass modelling in the Perth region, Western Australia. Geomatics Research Australia 75, 53 86. � Coli´ c, K., T. Ba� si´ c, S. Petrovi´ c, B. Pribi� cevi´ c, and M. Ratkajec 1993. Improved geoid solution for Slovenia and a part of Croatia. In Geodesy and Physics of the Earth, Volume 112, pp. 141144. IAG Symposia Series, Springer, Berlin, Germany.
131
Collier, P. A., F. J. Leahy, and V. S. Argeseanu 1997. Options and strategies for transition to GDA94. The Australian Surveyor 42(3), 116125.
Collier, P. A., F. J. Leahy, and V. S. Argeseanu 1998. Distortion modelling and the transition to GDA94. The Australian Surveyor 43(1), 2940.
Cressie, N. 1993. Statistics for Spatial Data. New York, USA: John Wiley & Sons Inc.
Daho, S. B. A. and S. Kahlouche 1998. The gravimetric geoid in Algeria: �rst results. In Geodesy on the Move, Volume 119, pp. 262268. IAG Symposia Series, Springer, Berlin, Germany.
Damian, D., P. Sampson, and P. Guttorp 2001. non-stationary spatial covariance structures.
Bayesian estimation of semi-parametric Environmetrics 12(2),
161178,
doi:
10.1002/1099095X(200103)12:23.0.CO;2G.
Darbeheshti, N. and W. E. Featherstone 2008. Non-stationary covariance function modelling in 2D least-squares collocation. Journal of Geodesy, (online �rst) doi: 10.1007/s00190 00802670.
Daubechies, I. 1992. Ten Lectures on Wavelets. Philadelphia, USA: SIAM.
de Min, E. 1995. A comparison of Stokes' numerical integration and collocation, and a new combination technique. manuscripta geodaetica 69(4), 223232.
de Sa, N. C., N. Ussami, and E. C. Molina 1993. Gravity map of Brazil; 1. Representation of free-air and Bouguer anomalies. Journal of Geophysical Research 98(B2), 21872197.
Deng, X. L. and W. E. Featherstone 2006. A coastal retracking system for satellite radar altimeter waveforms: application to ERS-2 around Australia.
Journal of Geophysical
Research - Oceans 111(C06012), doi: 10.1029/2005JC003039.
Denker, H., W. Torge, and G. Wenzel 2000. Investigation of different methods for the combination of gravity and GPS/levelling data.
In Geodesy Beyond 2000. The Challenges
of the First Decade, Volume 121, pp. 137142. IAG Symposia Series, Springer, Berlin, Germany.
Dermanis, A. 1984. Kriging and collocation - a comparison. manuscripta geodaetica 9(3), 159167.
132
Deutsch, C. V. and A. G. Journel 1998. GSLIB. New York, USA: Oxford University Press.
Drewes, H. and O. Heidbach 2005.
Deformation of the South American crust estimated
from �nite element and collocation Methods. In A Window on the Future of Geodesy, Volume 128, pp. 544549, doi: 10.1007/354027432492. IAG Symposia Series, Springer, Berlin, Germany.
Duquenne, H., M. Everaerts, and P. Lambot 2005. Merging a gravimetric model of the geoid with GPS/levelling data: an example in Belgium. In Gravity, Geoid and Space Missions, Volume 129, pp. 131136. IAG Symposia Series, Springer, Berlin, Germany.
Duquenne, H., Z. Jiang, and C. Lemari´ e 1995. Geoid determination and levelling by GPS: some experiments on a test network. In Gravity and Geoid, Volume 113, pp. 559568. IAG Symposia Series, Springer, Berlin, Germany.
Eeg, J. and T. Krarup 1973.
Integerated geodesy.
Technical Report No. 7, The Danish
Geodetic Institute, Copenhagen, Denmark.
El-Fiky, G. S., T. Kato, and Y. Fujii 1997.
Distribution of vertical crustal movement
rates in the Tohoku district, Japan, predicted by least-squares collocation.
Journal of
Geodesy 71(7), 432442, doi: 10.1007/s001900050111.
Eren, E. 1980. Spectral analysis of GEOS-3 altimeter data and frequency domain collocation. Report 297, Department of Geodetic Science, The Ohio State University, Columbus, USA.
Featherstone, W. 2008. GNSS-heighting in Australia: current, emerging and future issues. Journal of Spatial Science 53(2), 115133.
Featherstone, W. and K. Alexander 1996. An analysis of GPS height determination in Western Australia. The Australian Surveyor 41(1), 2934.
Featherstone, W. E. 1992. A G.P.S. controlled gravimetric determination of the Geoid of the British Isles. Ph. D. thesis, Department of Earth Sciences, University of Oxford, Oxford, UK.
Featherstone, W. E. 1998. Do we need a gravimetric geoid or a model of the base of the Australian Height Datum to transform GPS heights? 273280.
The Australian Surveyor 43(4),
133
Featherstone, W. E. 2000. Re�nement of gravimetric geoid using GPS and levelling data. Journal of Surveying Engineering 126(2), 2756, doi: 10.1061/(ASCE)07339453(2000).
Featherstone, W. E. 2004. Evidence of a north-south trend between AUSGeoid98 and the AHD in southwest Australia. Survey Review 37(291), 334343.
Featherstone, W. E. 2007. Augmentation of AUSGeoid98 with GRACE satellite gravity data. Journal of Spatial Science 52(2), 7586.
Featherstone, W. E. 2009. study around Australia.
Only use ship-track gravity data with caution:
a case-
Australian Journal of Earth Sciences 56(2), 191195, doi:
10.1080/08120090802547025.
Featherstone, W. E. and M. S. Filmer 2008. A new GPS-based evaluation of distortions in the Australia Height Datum in Western Australia. Journal of the Royal Society of Western Australia 91, 199206.
Featherstone, W. E., J. F. Kirby, A. H. W. Kearsley, J. R. Gilliland, G. M. Johnston, J. Steed, R. Forsberg, and M. G. Sideris 2001. The AUSGeoid98 geoid model of Australia: data treatment, computations and comparisons with GPS-levelling data. Journal of Geodesy 75(5-6), 313330, doi: 10.1007/s001900100177.
Featherstone, W. E. and M. Kuhn 2006. Height systems and vertical datums: a review in the Australian context. Journal of Spatial Science 51(1), 2142.
Featherstone, W. E. and D. M. Sproule 2006. Fitting AusGeoid98 to the Australian height datum using GPS-levelling and least squares collocation: application of a cross-validation technique. Survey Review 38(301), 573582.
Fieguth, P. W., W. C. Karl, A. S. Willsky, and C. Wunsch 1995. Multiresolution optimal interpolation and statistical analysis of TOPEX/POSEIDON satellite altimetry. IEEE Transactions on Geoscience and Remote Sensing 33(2), 280292.
Flury, J. 2006.
Short-wavelength spectral properties of the gravity �eld from a range of
regional data sets. Journal of Geodesy 79(10-11), 624640, doi: 10.1007/s00190005 0011y.
134
Forsberg, R. 1986. Spectral properties of the gravity �eld in the Nordic countries. Bolletino di Geodesia e Scienze Af�ni XLV, 361384.
Forsberg, R. 1987. A new covariance model for inertial gravimetry and gradiometry. Journal of Geophysical Research 92(B2), 13051310.
Forsberg, R. 1991. A new high-resolution geoid of the Nordic area. In Determination of the Geoid: Present and Future, Volume 106, pp. 241250. IAG Symposia Series, Springer, Berlin, Germany.
Forsberg, R. 2003. Downward continuation of airborne gravity data-an Arctic case story. In Gravity and Geoid 2002, Proceedings of the 3rd Meeting of the International Gravity and Geoid Commission, pp. 5156. Ziti publications, Thessaloniki, Greece.
Forsberg, R., D. Munkhtsetseg, and A. Amarzaya 2007. Downward continuation and geoid determination in Mongolia from airborne and surface gravimetry and SRTM topography. In Gravity Field of the Earth, pp. 259264. Proceedings of the 1st International Symposium of the International Gravity Field Service, General Command of Mapping, Ankara, Turkey.
Forsberg, R., G. Strykowski, J. C. Iliffe, M. Ziebart, P. Cross, C. C. Tscherning, P. Cruddace, O. Finch, C. Bray, and K. Stewart 2003. A new geoid model of the British Isles. In Gravity and Geoid 2002, Proceedings of the 3rd Meeting of the International Gravity and Geoid Commission, pp. 132137. Ziti publications, Thessaloniki, Greece.
Forsberg, R. and C. C. Tscherning 1981. The use of height data in gravity �eld approximation. Journal of Geophysical Research 86, 78437854.
Forsberg, R. and C. C. Tscherning 2008. An overview manual for the GRAVSOFT. Technical Report 2th edition, Technical University of Denmark, Copenhagen, Denmark.
Friedlieb, O. J., W. E. Featherstone, and M. C. Dentith 1997. A WGS84-AHD pro�le over the Darling Fault, Western Australia. Geomatics Research Australasia 67, 1732.
Fuentes, M. 2001.
A high frequency Kriging approach for non-stationary environmental
processes. Environmetrics 12(5), 469483, doi: 10.1002/env.473.
135
Fuentes, M. and R. Smith 2001. A new class of nonstationary spatial models. Technical report, Department of Statistics, North Carolina State University, USA.
Fujii, Y. and S. Xia 1993. Estimation of distribution of the rates of vertical crustal movements in the Tokai district with the aid of least squares prediction.
Journal of Physics of the
Earth 41(4), 239256.
Fukuda, Y., J. Kuroda, Y. Takabatake, J. Itoh, and M. Murakami 1997.
Improvement of
JGEOID 93 by the geoidal heights derived from GPS/levelling survey. In Gravity, Geoid and Marine Geodesy, Volume 117, pp. 589596. IAG Symposia Series, Springer, Berlin, Germany.
Fukuda, Y. and J. Segawa 1991. Derivation of the most reliable geoid in the area of Japan and some comments on the variability of sea surface topography. In Determination of the Geoid: Present and Future, Volume 106, pp. 191200. IAG Symposia Series, Springer, Berlin, Germany.
Fukunaga, K. 1990. Introduction to Statistical Pattern Recognition. New York, USA: Elsevier.
Gandin, L. S. 1963. Objective analysis of meteorological �elds. Report 1373, Israeli Program for Scienti�c Translations, Jerusalem, Israel.
Gaposchkin, E. M. 1973. Standard Earth III-1973. Special Report 353, Smithsonian Astrophysical Observatory, Cambridge, USA.
Gelderen, M. V. and R. H. N. Haagmans 1991. The GEMT1 variance-covariance matrix, its characteristics and applications in geoid computations. In Determination of the Geoid: Present and Future, Volume 106, pp. 410421. IAG Symposia Series, Springer, Berlin, Germany.
Gil, A. J., M. J. Sevilla, and G. Rodriguez-Caderot 1993. central Spain from gravity and height.
Geoid determination in
Bulletin G´ eod´ esique 67(1),
4150,
doi:
10.1007/BF00807296.
Goad, C. C., C. C. Tscherning, and M. M. Chin 1984. Gravity empirical covariance values for the continental United States. Journal of Geophysical Research 89(B9), 79627968.
136
Goovaerts, P. 1997. Geostatistics for Natural Resources Evaluation. New York, USA: Oxford University Press.
Haar, A. 1910.
Zur Theorie der orthogonalen Funktionensysteme.
Mathematische An-
nalen 69(3), 331371.
Hanafy, M. S. and M. A. E. Tokhey 1993. Simulation studies for improving the geoid in Egypt. In Geodesy and Physics of the Earth, Volume 112, pp. 153158. IAG Symposia Series, Springer, Berlin, Germany.
Hanafy, M. S. A. and M. E. A. E. Tokhey 1995. Towards a high precision geoid for Egypt. In Gravity and Geoid, Volume 113, pp. 597606. IAG Symposia Series, Springer, Berlin, Germany.
Hancock, M. S. and M. L. Stein 1993. A Bayesian analysis of Kriging. Technometrics 35(4), 403410.
Hauck, H. and D. Lelgemann 1985. Regional gravity �eld approximation with buried masses using least-norm collocation. manuscripta geodaetica 10, 5058.
Hein, G. W. 1986. Mathematical and numerical techniques in physical geodesy. In Integrated geodesy state-of-the-art, Volume 7, pp. 505548. IAG Symposia Series, Springer, Berlin, Germany.
Heiskanen, W. and H. Moritz 1967. Physical Geodesy. San Francisco, USA: W. H. Freeman & Co.
Heliani, L. S., Y. Fukuda, and S. Takemoto 2003. Precise Indonesian gravity �eld determination from a combination of surface gravity, altimeter and digital terrain model data. In Gravity and Geoid 2002, Proceedings of the 3rd Meeting of the International Gravity and Geoid Commission, pp. 201206. Ziti publications, Thessaloniki, Greece.
Herzfeld, U. C. 1992. Least-squares collocation, geophysical inverse theory and geostatistics: a bird's eye view. Geophysical Journal International 111(2), 237249.
Higdon, D., J. Swall, and J. Kern 1999.
Non-stationary spatial modelling.
In Bayesian
Statistics, Volume 6, pp. 761768. Proceedings of the Sixth Valencia International Meeting, Oxford University Press, New York, USA.
137
Hirt, C. and J. Flury 2008. Astronomical-topographic levelling using high-precision astrogeodetic vertical de�ections and digital terrain model data. Journal of Geodesy 82(4-5), 231248, doi: 10.1007/s001900070173x.
Holland, D., N. Saltzman, L. Cox, and D. Nychka 1999. Spatial prediction of sulfur dioxide in the eastern United States. In geoENV II- Geostatistics for Environmental Applications, Volume 10, pp. 6576. Springer, Berlin, Germany.
Holmes, S. A. and N. K. Pavlis 2006. Program HARMONIC-SYNTH, a fortran program for very-high-degree harmonic synthesis. Technical report, NIMA, USA.
Howe, E. 2006. CHAMP satellite gravity �eld determination by collocation. Ph. D. thesis, Niels Bohr Institute, Faculty of Science, University of Copenhagen, Denmark.
Hwang, C. and B. Parsons 1995. Gravity anomalies derived from Seasat, Geosat, ERS-1 and TOPEX/POSEIDON altimetry and ship gravity: a case study over the Reykjanes Ridge. Geophysical Journal International 122(2), 551568.
Hwang, C. and B. Parsons 1996. An optimal procedure for deriving marine gravity from multi-satellite altimetry. Geophysical Journal International 125(3), 705718.
Iliffe, J. C., M. Ziebart, P. A. Cross, R. Forsberg, G. Strykowski, and C. C. Tscherning 2003. OSGM02: A new model for converting GPS-derived heights to local height datums in Great Britain and Ireland. Survey Review 37, 276293.
Jekeli, C. 1982.
A numerical study of the divergence of spherical harmonic series of the
gravity and height anomalies at the Earth's surface. Bulletin G´ eod´ esique 57(1), 1028, doi: 10.1007/BF02520909.
Jekeli, C. 1989. Using line averages in least-squares collocation. Journal of Geodesy 63(2), 203212, doi: 10.1007/BF02519151.
Jekeli, C., J. K. Lee, and J. H. Kwon 2007. Modeling errors in upward continuation for INS gravity compensation. Journal of Geodesy 81(5), 297309, doi: 10.1007/s00190006 0108y.
Jordan, S. K. 1972. Self-consistent statistical models for the gravity anomaly, vertical de�ections, and undulations of the geoid. Journal of Geophysical Research 77(20), 36603670.
138
Kahlouche, S., M. I. Kariche, and S. B. A. Daho 1998.
Comparison between altimetric
and gravimetric geoid in the south-west Mediterranean basin. In Geodesy on the Move, Volume 119, pp. 281287. IAG Symposia Series, Springer, Berlin, Germany.
Kasper, J. F. 1971. A second-order Markov gravity anomaly model. Journal of Geophysical Research 76(32), 78447849.
Kearsley, A. H. W. 1977. Non-stationary estimation in gravity prediction problems. Report 256, Department of Geodetic Science, The Ohio State University, Columbus, USA.
Kearsley, A. H. W. 1988.
Test on the recovery of precise geoid height differences from
gravimetry. Journal of Geophysical Research 93(B6), 65596570.
Keller, W. 1998a. Collocation in reproducing kernel Hilbert spaces of a multiscale analysis. Physics and Chemistry of the Earth 23(1), 2529.
Keller, W. 1998b. Geoid computation by collocation in scaling spaces. In Geodesy on the Move, Volume 119, pp. 176181. IAG Symposia Series, Springer, Berlin, Germany.
Keller, W. 2000.
A wavelet approach to non-stationary collocation.
In Geodesy Beyond
2000. The Challenges of the First Decade, Volume 121, pp. 208214. IAG Symposia Series, Springer, Berlin, Germany.
Keller, W. 2002. the 2D case.
A wavelet solution to 1D non-stationary collocation with extension to
In Gravity, Geoid and Geodynamics 2000, Volume 123, pp. 7984. IAG
Symposia Series, Springer, Berlin, Germany.
Keller, W. 2004.
Wavelets in Geodesy and Geodynamics.
Berlin, Germany: Walter de
Gruyter.
Kenyon, S. and N. Pavlis 1997. The development of a global gravity anomaly database used in the NIMA/GSFC geopotential model. In Gravity, Geoid and Marine Geodesy, Volume 117, pp. 470477. IAG Symposia Series, Springer, Berlin, Germany.
Kenyon, S. C. 1998. The development by the national imagery and mapping agency of a global surface gravity anomaly database for the EGM96 geopotential model and further applications. In Geodesy on the Move, Volume 119, pp. 99104. IAG Symposia Series, Springer, Berlin, Germany.
139
Kirby, J. F. 2003.
On the combination of gravity anomalies and gravity disturbances for
geoid determination in Western Australia.
Journal of Geodesy 77(7-8), 433439, doi:
10.1007/s0019000303345.
Kirby, J. F. and W. E. Featherstone 2002. High-resolution grids of gravimetric terrain correction and complete Bouguer corrections over Australia. Exploration Geophysics 33(3-4), 161165.
Kirby, J. F. and R. Forsberg 1998. A comparison of techniques for the integration of satellite altimeter and surface gravity data for geoid determination. In Geodesy on the Move, Volume 119, pp. 207212. IAG Symposia Series, Springer, Berlin, Germany.
Knudsen, P. 1987.
Estimation and modelling of the local empirical covariance function
using gravity and satellite altimeter data.
Bulletin G´ eod´ esique 61(2), 145160, doi:
10.1007/BF02521264.
Knudsen, P. 1988. Determination of local empirical covariance function from residual terrain reduced altimeter data.
Report 395, Department of Geodetic Science, The Ohio State
University, Columbus, USA.
Knudsen, P. 1991a. A simultaneous estimation of the gravity �eld and sea surface topography from satellite altimeter data by least-squares collocation. Geophysical Journal International 104(2), 307317, doi: 10.1111/j.1365246X.1991.tb02513.x.
Knudsen, P. 1991b.
Some accuracy estimates of local geoids.
In Determination of the
Geoid-Present and Future, Volume 106, pp. 422431. IAG Symposia Series, Springer, Berlin, Germany.
Knudsen, P. 2005.
Patching local empirical covariance functions-a problem in altimeter
data processing. In A Window on the Future of Geodesy, Volume 128, pp. 483487. IAG Symposia Series, Springer, Berlin, Germany.
Knudsen, P. and O. B. Andersen 1997.
Improved recovery of the global marine gravity
�eld from the GEOSAT and the ERS-1 geodetic mission altimetry.
In Gravity, Geoid
and Marine Geodesy, Volume 117, pp. 429436. IAG Symposia Series, Springer, Berlin, Germany.
140
Knudsen, P. and O. B. Andersen 1998. Global marine gravity and mean sea surface from multi mission satellite altimetry. In Geodesy on the Move, Volume 119, pp. 105118. IAG Symposia Series, Springer, Berlin, Germany. ¨ Knudsen, P., O. B. Andersen, R. Forsberg, H. P. Foh, A. V. Olesen, A. L. Vest, D. Solheim, O. D. Omang, R. Hipkin, A. Hunegnaw, K. Haines, R. Bingham, J. P. Drecourt, J. A. Johannessen, H. Drange, F. Siegismund, F. Hernandez, G. Larnicol, M. H. Rio, and P. Schaeffer 2007. Combining altimetric/gravimetric and ocean model mean dynamic topography models in the GOCINA region. In Dynamic Planet, Volume 130, pp. 310, doi: 10.1007/97835404935011. IAG Symposia Series, Springer, Berlin, Germany. Knudsen, P. and C. C. Tscherning 2007. Error characteristics of dynamic topography models derived from altimetry and GOCE gravimetry. In Dynamic Planet, Volume 130, pp. 1116, doi: 10.1007/97835404935012. IAG Symposia Series, Springer, Berlin, Germany. Koch, K. R. 1977. Least squares adjustment and collocation. Bulletin G´ eod´ esique 51(2), 127135, doi: 10.1007/BF02522282. Kotsakis, C. 2000a. The multiresolution character of collocation. Journal of Geodesy 74(34), 275290, doi: 10.1007/s001900050286. Kotsakis, C. 2000b. Wavelets and collocation: An interesting similarity. In Geodesy Beyond 2000. The Challenges of the First Decade, Volume 121, pp. 214220. IAG Symposia Series, Springer, Berlin, Germany. Kotsakis, C. 2007. Least-squares collocation with covariance-matching constraints. Journal of Geodesy 81(10), 661677, doi: 10.1007/s0019000701335. Kotsakis, C. and M. G. Sideris 1999. The long road from deterministic collocation to multiresolution approximation. Report 1999.5, Department of Geodesy and Geoinformatics, Stuttgart University, Germany. Krarup, T. 1969. A contribution to the mathematical foundation of physical geodesy. Report 44, Danish Geodetic Institute, Copenhagen, Denmark. Krige, D. G. 1951. Witwatersrand.
A statistical approach to some basic mine valuation problems on the Journal of the Chemical, Metallurgical and Mining Society of South
Africa 52(6), 119139.
141
¨ Kuhtreiber, N. and H. A. Abd-Elmotaal 2007. Ideal combination of de�ection components and gravity anomalies for precise geoid computation. In Dynamic Planet, Volume 130, pp. 259265, doi: 10.1007/978354049350139. IAG Symposia Series, Springer, Berlin, Germany.
Kuroishi, Y., H. Ando, and Y. Fukuda 2002. A new hybrid geoid model for Japan GSIGEO 2000. Journal of Geodesy 76(8), 428436, doi: 10.1007/s0019000202665.
Kwon, J. H., T. S. Bae, Y. Choi, D. C. Lee, and Y. W. Lee 2005. Geodetic datum transformation to the global geocentric datum for seas and islands around Korea. Geosciences Journal 9(4), 353361, doi: 10.1007/BF02910324.
Lambeck, K. 1987. The Perth Basin: a possible framework for its formation and evolution. Exploration Geophysics 18(2), 124128.
Lemoine, F. G., S. C. Kenyon, J. K. Factor, R. G. Trimmer, N. K. Pavlis, D. S. Chinn, C. M. Cox, S. M. Klosko, S. B. Luthcke, M. H. Torrence, Y. M. Wang, R. G. Williamson, E. C. Pavlis, R. H. Rapp, and T. R. Olson 1998. The development of the joint NASA GSFC and the National Imagery and Mapping Agency (NIMA) geopotential model EGM96. Technical Report NASA/TP-1998-206861, National Aeronautics and Space Administration, USA.
LeQuentrec-Lalancette, M. F. and D. Rouxel 2003. Mapping of the free air anomaly using altimetric and marine gravity data. In Gravity and Geoid 2002, Proceedings of the 3rd Meeting of the International Gravity and Geoid Commission, pp. 353357. Ziti publications, Thessaloniki, Greece.
Li, J. and M. G. Sideris 1997.
Marine gravity and geoid determination by optimal com-
bination of satellite altimetry and shipborne garvimetry data. Journal of Geodesy 71(4), 209216, doi: 10.1007/s001900050088.
Lyszkowicz, A. 1991.
Efforts towards a preliminary gravimetric geoid computations in
Poland area. In Determination of the Geoid: Present and Future, Volume 106, pp. 269 275. IAG Symposia Series, Springer, Berlin, Germany.
Lyszkowicz, A. 2003. The analysis of gravity �eld data in view of sub-decimetre geoid in
142
Poland. In Gravity and Geoid 2002, Proceedings of the 3rd Meeting of the International Gravity and Geoid Commission, pp. 229234. Ziti publications, Thessaloniki, Greece.
Maggi, A., F. Migliaccio, M. Reguzzoni, and N. Tselfe 2007.
Combination of ground
gravimetry and goce data for local geoid determination: a simulation study. In Gravity Field of the Earth, pp. 16. Proceedings of the 1st International Symposium of the International Gravity Field Service, General Command of Mapping, Ankara, Turkey.
Mahalanobis, P. C. 1936.
On the generalized distance in statistics.
Proceedings of the
National Institute of Science of India 12, 4955.
Mallat, S. G. 1989. A theory for multiresolution signal decomposition: the wavelet representation. IEEE Transactions on Pattern Analysis and Machine Intelligence 11(7), 674693.
Marchenko, A. and O. Abrikosov 1995. Covariance functions set derived from radial multipoles potentials: theory and some results for regional gravity �eld in central Europe. In Gravity and Geoid, Volume 113, pp. 296303. IAG Symposia Series, Springer, Berlin, Germany.
Marchenko, A. N., F. Barthelmes, U. Meyer, and P. Schwinzer 2002.
Ef�cient regional
geoid computations from airborne and surface gravimetry data: a case study. In Vistas for Geodesy in the New Millennium, Volume 125, pp. 223228. IAG Symposia Series, Springer, Berlin, Germany.
Marti, U. 1995. Test of collocation models for the Swiss geoid computation. In Gravity and Geoid, Volume 113, pp. 588596. IAG Symposia Series, Springer, Berlin, Germany.
Marti, U. 2007. Comparison of high precision geoid models in Switzerland. In Dynamic Planet, Volume 130, pp. 377382. IAG Symposia Series, Springer, Berlin, Germany.
Martinez, W. M. and A. R. Martinez 2002. Computational Statistics Handbook with MATLAB. New York, USA: Chapman & Hall/CRC.
Mat´ ern, B. 1986.
Spatial Variation, Lecture Notes in Statistics, 2nd Edition.
New York,
USA: Springer.
Matheron, G. 1962.
Trait´ e de g´ eostatistique appliqu´ ee, tome i.
Report 14, M´ emoires du
Bureau de Recherches G´ eologiques et Mini� eres, Editions Technip, Paris.
143
Matheron, G. 1963. Trait´ e de g´ eostatistique appliqu´ ee, tome ii. Report 24, M´ emoires du Bureau de Recherches G´ eologiques et Mini� eres, Editions Technip, Paris.
Menz, J. and S. Bian 2000. Collocation: a synonym of kriging in geodesy. Mathematische Geologie 5, 4348.
Migliaccio, F., M. Reguzzoni, and N. Tselfes 2007. GOCE: a full-gradient simulated solution in the space-wise approach. In Dynamic Planet, Volume 130, pp. 383390, doi: 10.1007/978354049350156. IAG Symposia Series, Springer, Berlin, Germany.
Milbert, D. G. 1995. Improvement of a high resolution geoid model in the United States by GPS height on NAVD88 benchmarks. International Geoid Service Bulletin 4, 1336.
Milbert, D. G. and W. T. Dewhurst 1992.
The Yellowstone-Hebgen lake geoid obtained
through the integrated geodesy approach. Journal of Geophysical Research 97(B1), 545 557.
Mohammad-Karim, M. 1981. Diagrammatic approach to solve least-squares adjustment and collocation problem. Report 83, Department of Surveying Engineering, University of New Brunswick, Fredericton, Canada.
Molodenskij, M. S., V. F. Eremeev, and M. I. Yurkina 1962. Methods for study of the external gravitational �eld and �gure of the earth. Technical Report Translated from Russian by the Israeli Program for Scienti�c Translations for the Of�ce of Technical Services, U.S. Department of Commerce, Washington, D.C., U.S.A.
Moreaux, G. 2007.
Compactly supported radial covariance functions.
Journal of
Geodesy 82(7), 431443, doi: 10.1007/s0019000701954.
Moritz, H. 1962. Interpolation and prediction of gravity and their accuracy. Report 24, Institute of Geodesy, Photogrammetry and Cartography, The Ohio State University, Columbus, USA.
Moritz, H. 1972. Advanced least squares methods. Report 175, Department of Geodetic Science, The Ohio State University, Columbus, USA.
Moritz, H. 1980a. Advanced Physical Geodesy. Karsruhe, Germany: Herbert Wichmann Verlag.
144
Moritz, H. 1980b. Geodetic reference system 1980. Bulletin G´ eod´ esique (54), 395405.
Morrison, F. 1977. Azimuth-dependent statistics for interpolating geodetic data. Bulletin G´ eod´ esique 51(2), 105118, doi: 10.1007/BF02522280.
¨ Muller, J., F. Jarecki, and K. I. Wolf 2003. External calibration and validation of GOCE gradients. In Gravity and Geoid 2002, Proceedings of the 3rd Meeting of the International Gravity and Geoid Commission, pp. 268274. Ziti publications, Thessaloniki, Greece.
Nahavandchi, H. and A. Soltanpour 2006. Improved determination of heights using a conversion surface by combining gravimetric quasi-geoid/geoid and GPS-levelling height differences. Studia Geophysica et Geodaetica 50(2), 165180, doi: 10.1007/s11200006 00103. NASA 2008. [Website] http://daac.gsfc.nasa.gov/geomorphology/GEO6 /GEOP LAT EC
−
20.shtml. accessed : N ovember2008. Ning, J. S. 1984. The determination of relative geoidal height by least-squares collocation. In Local Gravity Field Approximation:Proceedings Beijing International Summer School, pp. 363412. Division Surveying Engineering, University of Calgary, Calgary.
Nott, D. and W. Dunsmuir 2002. Estimation of nonstationary spatial covariance structure. Biometrika 89(4), 819829, doi: 10.1093/biomet/89.4.819.
Nychka, D. and N. Saltzman 1998.
Design of air quality monitoring networks.
In Case
Studies in Environmental Statistics, Volume 132, pp. 5175. Lecture Notes in Statistics, Springer, New York, USA.
Nychka, tionary
D.,
C.
spatial
Wikle,
and
covariance
J.
Royle 2002.
functions.
Multiresolution
Statistical
Modelling
models 2(4),
for
nonsta-
315331,
doi:
10.1191/1471082x02st037oa.
Paciorek, C. J. 2003. Nonstationary Gaussian Processes For Regression And Spatial Modelling. Ph. D. thesis, Carnegie Mellon University, Pittsburgh, USA.
Paciorek, C. J. and M. J. Schervish 2006. Spatial modelling using a new class of nonstationary covariance functions. Environmetrics 17(5), 483506, doi: 10.1002/env.785.
145
P aquet, P., Z. Jiang, and M. Everaerts 1997. A new Belgian geoid determination BG96. In Gravity, Geoid and Marine Geodesy, Volume 117, pp. 605612. IAG Symposia Series, Springer, Berlin, Germany.
Pavlis, N. K., S. A. Holmes, S. C. Kenyon, and J. K. Factor 2008. An Earth Gravitational Model to Degree 2160: EGM2008, EGU-2008, Vienna, Austria, April.
Perrin, O. and W. Meiring 1999. Identi�ability for non-stationary spatial structure. Journal of Applied Probability 36(4), 12441250, doi: 10.1239/jap/1032374771.
Rapp, R. H. 1964. The prediction of point and mean gravity anomalies through the use of the digital computer. Report 43, Department of Geodetic Science, The Ohio State University, Columbus, USA.
Raymond, A., J. R. Nash, and S. K. Jordan 1978. Statistical geodesy - an engineering perspective. Proceedings of the IEEE 66(5), 532550.
� and G. Venuti 2005. The theory of general Kriging, with appliReguzzoni, M., F. Sanso, cation to the determination of a local geoid. Geophysical Journal International 162(2), 303314, doi: 10.1111/j.1365246X.2005.02662.x.
Reguzzoni, M. and N. Tselfes 2008.
Optimal multi-step collocation: application to the
space-wise approach for GOCE data analysis.
Journal of Geodesy, (online �rst), doi:
10.1007/s001900080225x.
Reguzzoni, M. and G. Venuti 2004. Testing invariance for random �eld modelling. In V Hotine-Marussi Symposium on Mathematical Geodesy, Volume 127, pp. 218225. IAG Symposia Series, Springer, Berlin, Germany.
Robbins, J. W. 1985. Least squares collocation applied to local gravimetric solutions from satellite gravity gradiometry data. Report 368, Department of Geodetic Science, The Ohio State University, Columbus, USA.
Robert, C. P. and G. Casella 2004. Springer.
Monte Carlo Statistical Methods.
Berlin, Germany:
146
Rodriguez-Caderot, G., M. J. Sevilla, and A. J. Gil 1993. Gravimetric data validation in the Mediterranean sea. In Geodesy and Physics of the Earth, Volume 112, pp. 149152. IAG Symposia Series, Springer, Berlin, Germany.
Ruffhead, A. 1987. An introduction to least-squares collocation. Survey Review 29(224), 8594.
Rummel,
R.
1976.
A
model
comparison
in
least-squares
collocation.
Bulletin
G´ eod´ esique 50(2), 181192, doi: 10.1007/BF02522317.
Rummel, R. 1991. Physical geodesy II. Technical report, Faculteit der Geodesie, Technische Universiteit Delft, Delft, The Netherlands.
Rummel, R. and K. P. Schwarz 1977.
On the non homogeneity of the global covariance
function. Bulletin G´ eod´ esique 51(2), 93103.
Sampson, P., D. D. P., and Guttorp 2001. Advances in modeling and inference for environmental processes with nonstationary spatial covariance. In geoENV III- Geostatistics for Environmental Applications, Volume 11, pp. 1732. Springer, Berlin, Germany.
Sampson, P. D. and P. Guttorp 1992.
Nonparametric estimation of non-stationary spatial
covariance structure. Journal of The American Statistical Association 87(417), 108119.
� F. 1986. Mathematical and numerical techniques in physical geodesy, In Statistical Sanso, methods in physical geodesy, pp. 49155, doi: 10.1007/BFb0010132. Germany: Springer Berlin / Heidelberg.
� F. and C. C. Tscherning 1980. Notes on convergence problems in collocation theory. Sanso, Bolletino di Geodesia e Scienze Af�ni 19(2), 221252.
� F. and C. C. Tscherning 2002. Fast spherical collocation: A general implementation. Sanso, In Vistas for Geodesy in the New Millennium, Volume 125, pp. 131137. IAG Symposia Series, Springer, Berlin, Germany.
� F. and C. C. Tscherning 2003. Sanso,
Fast spherical collocation: theory and examples.
Journal of Geodesy 77(1-2), 101112, doi: 10.1007/s0019000203105.
147
� F. and G. Venuti 2004. Sanso,
The estimation theory for random �elds in the Bayesian
context: a contribution from geodesy. In V Hotine-Marussi Symposium on Mathematical Geodesy, Volume 127, pp. 201217. IAG Symposia Series, Springer, Berlin, Germany.
� F., G. Venuti, and C. C. Tscherning 2000. A theorem of insensitivity of the collocation Sanso, solution to variations of the metric of the interpolation space. In Geodesy Beyond 2000. The Challenges of the First Decade, Volume 121, pp. 233240. IAG Symposia Series, Springer, Berlin, Germany.
Schaffrin, B. 1986. On robust collocation. In I Hotine-Marussi Symposium on Mathematical Geodesy, pp. 343361. IAG Symposia Series, Springer, Berlin, Germany.
Schaffrin, B. 1989.
An alternative approach to robust collocation.
manuscripta geodaet-
ica 63(4), 395404, doi: 10.1007/BF02519637.
Schaffrin, B. and Y. Felus 2005.
On total least-squares adjustment with constraints.
In
A Window on the Future of Geodesy, Volume 128, pp. 417421. IAG Symposia Series, Springer, Berlin, Germany.
Schoenberg, I. 1938.
Metric spaces and completely monotone functions.
The Annals of
Mathematics 39(4), 811841.
Schuh, W. D. 1991.
Numerical behaviour of covariances matrices and their in�uence on
iterative solution techniques. In Determination of the Geoid: Present and Future, Volume 106, pp. 432441. IAG Symposia Series, Springer, Berlin, Germany.
Schwarz, K. P. 1984. Data types and their spectral properties. In Local Gravity Field Approximation:Proceedings Beijing International Summer School, pp. 166. Division Surveying Engineering, University of Calgary, Calgary.
Schwarz, K. P. and G. Lachapelle 1980. Local characteristics of the gravity anomaly covariance function. Bulletin G´ eod´ esique 54(1), 2136, doi: 10.1007/BF02521093.
Schwarz, K. P., M. G. Sideris, and R. Forsberg 1990. The use of FFT techniques in physical geodesy. Geophysical Journal International 100(3), 485514, doi: 10.1111/j.1365 246X.1990.tb00701.x.
148
� 1991. The gravimetric geoid in Spain: �rst result. In Sevilla, M. J., A. J. Gil, and F. Sanso Determination of the Geoid: Present and Future, Volume 106, pp. 276285. IAG Symposia Series, Springer, Berlin, Germany.
Shaw, L., I. Paul, and P. Henrikson 1969. Statistical models for the vertical de�ection from gravity-anomaly models. Geophysical Journal International 74(17), 42594265.
Smith, D. A. and D. G. Milbert 1999. The GEOID96 high-resolution geoid height model for the United States. Journal of Geodesy 73(5), 219236, doi: 10.1007/s001900050239.
Smith, R. L. 1996. Estimating nonstationary spatial correlations. Technical report, Department of Statistics, Cambridge University, UK.
Smith, W. H. F. and P. Wessel 1990. Gridding with continuous curvature splines in tension. Geophysics 55(293), 293305, doi: 10.1190/1.1442837.
Soltanpour, A., H. Nahavandchi, and W. E. Featherstone 2006. The use of second-generation wavelets to combine a gravimetric geoid model with GPS-levelling data.
Journal of
Geodesy 80(2), 8293, doi: 10.1007/s0019000600330.
Stopar, B., A. T. M. Kuhar, and G. Turk 2006.
GPS-derived geoid using arti�cial neural
network and least squares collocation. Survey Review 38(300), 513524.
Strykowski, G. 1996. Inverse Methods, In Improving the planar isotropic covariance, pp. 254261. Germany: Springer Berlin / Heidelberg.
Strykowski, G. and R. Forsberg 1998. Operational merging of satellite airborne and surface gravity data by draping techniques. In Geodesy on the Move, Volume 119, pp. 207212. IAG Symposia Series, Springer, Berlin, Germany.
¨ Sunkel, H. 1984.
Splines: Their equivalence to collocation.
Report 357, Department of
Geodetic Science, The Ohio State University, Columbus, USA.
Swall, J. L. 1999. Non-stationary spatial modelling using a process convolution approach. Ph. D. thesis, Institute of Statistics and Decision Sciences, Duke University, Durham, USA.
149
Teunissen, P. J. G. 2007a. Best prediction in linear models with mixed integer/real unknowns: theory and application. Journal of Geodesy 81(12), 759780, doi: 10.1007/s00190007 01406.
Teunissen, P. J. G. 2007b. Least-squares prediction in linear models with integer unknowns. Journal of Geodesy 81(9), 565579, doi: 10.1007/s0019000701380.
Teunissen, P. J. G. 2008. On a stronger than best property for best prediction. Journal of Geodesy 82(3), 167175, doi: 10.1007/s0019000701696.
Torge, W. 2001. Geodesy (3rd Edition). Berlin, Germany: Walter de Gruyter.
Tornatore, V. and F. Migliaccio 1998. Stochastic modelling of non-stationary smooth phenomena. In IV Hotine-Marussi Symposium on Mathematical Geodesy, Volume 122, pp. 7782. IAG Symposia Series, Springer, Berlin, Germany. ´ am, L. Foldv´ ´ ¨ Toth, G. Y., J. Ad´ ary, I. N. Tziavos, and H. Denker 2005. Calibration/validation of GOCE data by terrestrial torsion balance observations.
In A Window on the Future
of Geodesy, Volume 128, pp. 214219, doi: 10.1007/354027432437. IAG Symposia Series, Springer, Berlin, Germany. ´ am, and I. N. Tziavos 2002. Gravity �eld modelling by torsion ´ ´ Toth, G. Y., S. Z. Rozsa, J. Ad´ balance data-a case study in Hungary.
In Vistas for Geodesy in the New Millennium,
Volume 125, pp. 193198. IAG Symposia Series, Springer, Berlin, Germany.
´ ¨ Toth, G. Y. and L. Volgyesi 2007. Local gravity �eld modeling using surface gravity gradient measurements. In Dynamic Planet, Volume 130, pp. 424429, doi: 10.1007/9783540 49350162. IAG Symposia Series, Springer, Berlin, Germany.
Tsaoussi, L. S. 1989. A simulation study of the overdetermined geodetic boundary value problem using collocation. Report 398, Department of Geodetic Science, The Ohio State University, Columbus, USA.
Tschernig, C. C. and D. N. Arabelos 2005. Computation of a geopotential model from GOCE data using fast spherical collocation - A simulation study.
In A Window on the Future
of Geodesy, Volume 128, pp. 6065, doi: 10.1007/354026932011. IAG Symposia Series, Springer, Berlin, Germany.
150
Tscherning, C. C. 1975. Application of collocation for the planning of gravity survey. Journal of Geodesy 49(2), 183198.
Tscherning, C. C. 1976. Covariance expressions for second and lower order derivatives of the anomalous potentials. Report 225, Department of Geodetic Science, The Ohio State University, Columbus, USA.
Tscherning, C. C. 1984. Local approximation of gravity potential by least squares collocation. In Local Gravity Field Approximation:Proceedings Beijing International Summer School, pp. 277362. Division of Surveying Engineering, University of Calgary, Calgary.
Tscherning, C. C. 1985. Geoid modelling using collocation in Scandinavia and Greenland. Marine Geodesy 9(1), 116.
Tscherning, C. C. 1986. Mathematical and numerical techniques in physical geodesy, In Functional methods for gravity �eld approximation, pp. 147, doi: 10.1007/BFb0010131. Germany: Springer Berlin / Heidelberg.
Tscherning, C. C. 1991a.
Density-gravity covariance functions produced by overlapping
rectangular blocks of constant density. Geophysical Journal International 105(3), 771 776, doi: 10.1111/j.1365246X.1991.tb00811.x.
Tscherning, C. C. 1991b. EMPCOV FORTRAN77. Technical report, Department of Geodetic Science, The Ohio State University, Columbus, USA.
Tscherning, C. C. 1994.
Geoid determination by least-squares collocation using GRAV-
SOFT. Technical report, IGeS, DIIAR, Politecnico di Milano, Lectures Notes of the International School for the Determination and Use of the Geoid.
Tscherning, C. C. 1996. Isotropic reproducing kernels for the inner of a sphere or spherical shell and their use as density covariance functions. manuscripta geodaetica 28(2), 161 168, doi: 10.1007/BF02084211.
Tscherning, C. C. 1999.
Construction of anisotropic covariance functions using Riesz-
representers. Journal of Geodesy 73(6), 332336, doi: 10.1007/s001900050250.
151
Tscherning, C. C. 2001.
Computation of spherical harmonic coef�cients and their
estimates using least-squares collocation.
Journal of Geodesy 75(1), 1218, doi:
10.1007/s001900000150.
Tscherning, C. C. 2004. A discussion of the use of spherical approximation or no approximation in gravity �eld modelling with emphasis on unsolved problems in least-squares collocation. In V Hotine-Marussi Symposium on Mathematical Geodesy, Volume 127, pp. 184188. IAG Symposia Series, Springer, Berlin, Germany.
Tscherning, C. C. 2005. Testing frame-transformation, gridding and �ltering of goce gradiometer data by least-squares collocation using simulated data.
In A Window on the
Future of Geodesy, Volume 128, pp. 277282. IAG Symposia Series, Springer, Berlin, Germany.
Tscherning, C. C. 2006. Comments on Stopar et al. Survey Review 38(302), 716.
Tscherning, C. C. and R. Forsberg 1992.
Harmonic continuation and gridding effects on
geoid height. Journal of Geodesy 66(1), 4153, doi: 10.1007/BF00806809.
Tscherning, C. C., P. Knudsen, and R. Forsberg 1994. Description of the GRAVSOFT package, 4th edn. Technical report, Geophysical Institute, University of Copenhagen, Copenhagen, Denmark.
Tscherning, C. C. and R. H. Rapp 1974. Closed covariance expressions for gravity anomalies, geoid undulations, and de�ections of the vertical implied by anomaly degree variance models. Report 208, Department of Geodetic Science, The Ohio State University, Columbus, USA.
Tscherning, C. C., F. Rubek, and R. Forsberg 1998. Combining airborne and ground gravity data using collocation. In Geodesy on the Move, Volume 119, pp. 1823. IAG Symposia Series, Springer, Berlin, Germany.
� and D. Arabelos 1987. Merging regional geoids-preliminary Tscherning, C. C., F. Sanso, considerations and experiences. 206.
Bollettino di Geodesia e Scienze Af�ni XLVI(3), 191
152
Tsuei, G. C., D. N. Arabelos, R. Forsberg, M. G. Sideris, and I. Tziavos 1995. Geoid computations in Taiwan. In Gravity and Geoid, Volume 113, pp. 446458. IAG Symposia Series, Springer, Berlin, Germany.
Tukey, J. W. 1970.
Some further inputs.
In Geostatistics, a Colloquium, pp. 163174.
Proceedings of a Colloquium on Geostatistics, Plenum Pub Corp, New York, USA.
Tziavos, I. N. and W. E. Featherstone 2001. gravimetric geoid computation in australia.
First results of using digital density data in In Gravity, Geoid and Geodynamics 2000,
Volume 123, pp. 335340. IAG Symposia Series, Springer, Berlin, Germany.
Tziavos, I. N., J. Li, and M. G. Sideris 1997. A comparison of marine gravity �eld modeling methods using non-isotropic a-priori information. In Gravity, Geoid and Marine Geodesy, Volume 117, pp. 400407. IAG Symposia Series, Springer, Berlin, Germany.
Tziavos, I. N., G. S. Vergos, V. Kotzev, and L. Pashova 2005. Mean sea level and sea level variation studies in the Black sea and the Aegean. In Gravity, Geoid and Space Missions, Volume 129, pp. 254259. IAG Symposia Series, Springer, Berlin, Germany.
� ek, P. and E. Krakiwsky 1986. Geodesy, the Concepts (2nd Edition). Amsterdam, The Van´�c Netherlands: Elsevier Science Publishers.
Vergos, G. S. and M. G. Sideris 2002. Improving the estimation of bottom ocean topography with satellite altimetry derived gravity data using the integrated inverse method. In Vistas for Geodesy in the New Millennium, Volume 125, pp. 529534. IAG Symposia Series, Springer, Berlin, Germany.
Vergos, G. S., I. N. Tziavos, and V. D. Andritsanos 2005a. Gravity data base generation and geoid model estimation using heterogeneous data. In Gravity, Geoid and Space Missions, Volume 129, pp. 155160. IAG Symposia Series, Springer, Berlin, Germany.
Vergos, G. S., I. N. Tziavos, and V. D. Andritsanos 2005b. On the determination of marine geoid models by least-squares collocation and spectral methods using heterogeneous data. In A Window on the Future of Geodesy, Volume 128, pp. 332337, doi: 10.1007/3540 27432457. IAG Symposia Series, Springer, Berlin, Germany.
153
Vermeer, M. 1995. Mass point geopotential modelling using fast spectral techniques; historical overview, toolbox description, and numerical experiment. manuscripta geodaetica 20(5), 362378.
Vysko� cil, V. 1970. on the covariance and structural functions of anomalous gravity �eld. Studia Geophysica et Geodaetica 14(2), 174177, doi: 10.1007/BF02585616.
Wackernagel, H. 2003.
Multivariate Geostatistics:
An Introduction with Applications.
Berlin, Germany: Springer.
Wiener, N. 1949.
Extrapolation, Interpolation and Smoothing of Stationary Time Series.
Cambridge, Massachusetts: MIT Press.
Wolf, K. I. and H. Denker 2005. Upward continuation of ground data for GOCE calibration/validation purposes . In Gravity, Geoid and Space Missions, Volume 129, pp. 6065, doi: 10.1007/354026932011. IAG Symposia Series, Springer, Berlin, Germany. ¨ Wolf, K. I. and J. Muller 2008.
Accuracy analysis of external reference data for GOCE
evaluation in space and frequency domain. In Observing our Changing Earth, Volume 133, pp. 345352, doi: 10.1007/978354085426541. IAG Symposia Series, Springer, Berlin, Germany.
Xu, P. L. 1991. Least squares collocation with incorrect prior information. Zeitschrift fur ¨ Vermessungswesen 116(6), 266273.
Yang, Y. 1992. Robustfying collocation. manuscripta geodaetica 17(1), 2128.
Yang, Y., A. Zeng, and J. Zhang 2008. Adaptive collocation with application in height system transformation. Journal of Geodesy, (online �rst), 10.1007/s0019000802269.
You, R. J. 2006. Local geoid improvement using GPS and levelling data: case study. Journal of Surveying Engineering 132(3), 101107.
You, R. J. and H. W. Hwang 2006. Coordinate transformation between two geodetic datums of Taiwan by least-squares collocation. Journal of Surveying Engineering 132(2), 6470.
Zhang, K. and W. E. Featherstone 2004. Investigation of the roughness of the Australian gravity �eld using statistical, graphical, fractal and Fourier power spectrum techniques. Survey Review 37(293), 520530.
154
Zhu, L. 2007. Gradient modeling with gravity and DEM. Ph. D. thesis, Ohio State University, Geodetic Science and Surveying, Columbus, USA.