H. FERRIS 1. Abstract: New data on egg development and death rates, and refinements of logic concerning interaction of the nematode and host, were ...
198 Journal o[ Nematology, Volume 10, No. 2, April 1978 12. S M I T H , E. 1972. C u t t i n g schedules a n d m a i n t a i n i n g p u r e stands. Pages 481-496 in C. H. H a n s o n , ed. Alfalfa science a n d technology. A m . Soc. Agron., Madison, Wisc. 13. S M O L I K , J. D., a n d R. B. M A L E K . 1973. Effect of T y l e n c h o r h y n c h u s n u d u s o n g r o w t h of K e n t u c k y bluegrass. J. N e m a t o l . 5:272-274. 14. S T E I N E R , G. 1937. O p u s c u l a miscellanea n e m a tologica, V. (l) T y l e n c h o r h y n c h u s claytoni,
n. sp., a n a p p a r e n t l y rare n e m i c parasite of the tobacco p l a n t . Proc. H e l m i n t h o l . Soc. W a s h . 4:33-34. 15. W A S I L E W S K A , L. 1967. Analysis of the occurrence of n e m a t o d e s in alfalfa crops. I. Species composition of n e m a t o d e s in two alfalfa crops of different age a n d p e n e t r a t i o n of species from soil to plants. Ekol. Pol. (Series A) 15:31-74.
Modification of a Computer Simulation Model for a Plant-Nematode System H. FERRIS 1 Abstract: New d a t a o n egg d e v e l o p m e n t a n d d e a t h rates, a n d r e f i n e m e n t s of logic c o n c e r n i n g interaction
of the
nematode
and
host, were
incorporated
into
a simulation
model
of a
Meloidogyne arenaria a n d grapevine system. S i m u l a t i o n s of field d a t a i m p r o v e d h u t o t h e r areas of weakness in the m o d e l were discovered. T w o peaks in the egg p o p u l a t i o n curve suggested t h a t the n e m a t o d e was able to complete two life cycles before host d o r m a n c y a n d d e c l i n i n g t e m p e r a t u r e s l i m i t e d physiological acti.vity. Key Words: Meloidogyne arenaria, p o p u l a t i o n dynamics, n e m a t o d e - h o s t interaction.
T h e development of a computer simulator (MELSIM) of a nematode-plant system (2, 3) has assisted in directing research efforts (4, 6). Experimentation with the simulator has exposed errors which required refinements in the logic of the model. T h e result is that the simulator must be updated periodically. It is hoped that the simulators predictive ability will improve as knowledge of the system is gained. This paper reports the effects of incorporating data on egg development and death rates (4) into the model, and of some logic refinements in the relationship of numbers of nematodes to plant damage and the influence of the physiological status of the host. T r i a l simulations are compared with field data (5). Egg development and death rates: Experiments on Meloidogyne arenaria egg development relative to temperature (4) indicated the need for two regression models, one to describe the development and hatch rate of 74% of the egg population and the other to describe the slower hatch of the remainder. T h e simulator was modified to partition each cohort of newly Received for publication 17 Octnher 1977. ~Assistant Nematologlst, Department of Nematology, University of California, Riverside, California 92521. Supported in part by USDA-CSRS Grant 316-15-63.
deposited eggs into two developmental/ hatch groups. Eggs developed according to a temperature-dependent rate (proportion of development completed per h): D = (2~.5 T - ~35)(10-~)
Seventy-four percent of the eggs hatched at maturity while the remainder hatched at a rate (egg hatch~egg~h): H = 0X
-
30.5)(10-0)
Studies of the effects of temperature on egg death rate (4) were used to formulate models based on temperature and length of exposure. Death rates (deaths/egg/h) during the first week of exposure to sub-optimal temperature were described by: R = ( 4 5 9 . 5 - 38.5T + 0.9T2)(10 -~) and during subsequent exposures by: R = ( 1 0 8 5 5 . 9 - 606.2T + 14.7T ~ + 20.gL 2 - 1.9TL 2 + 0.04T2L2)(10-0 where T -- temperature and L -- length of exposure in days. Since temperature experiences of each daily cohort of eggs will vary, the deaths of each age group of eggs are determined individually. T h e data base for the models was developed at constant temperatures (4), and the simulations involve fluctuating temperature. It could be argued, therefore, that the temperature-death rate models are somewhat misused in the simulator since the age of an egg is not a measure of time
Simulation Model Refinement: Ferris 199 of exposure to constant temperature. However, temperature fluctuations in soil are buffered, and changes are gradual. Consequently, use of these models is more reasonable than in an aerial system, where time-temperature interactions might be greater.
Relationship between nematode densities and plant damage: Seinhorst (13) developed models relating plant damage to numbers of nematodes based on Nicholson's (11) competition curve. T h e essential point of these models is that as the n u m b e r of nematodes per unit weight of root increases, the damage to plant growth caused by each nematode decreases. T h e relationship between log nematode density and plant growth approaches linearity beyond the tolerance limit of the plant, supporting empirical observations (12). T h e diminishing effect of increased densities was not considered in the original simulation model (2), but its logic is recognized and has been included. Seinhorst (13) elaborated upon the basic model in consideration of continued plant growth and replacement of affected parts. This elaboration is unnecessary for the simulation model since the n u m b e r of nematodes and a m o u n t of root tissue are continually updated. T h e validity of the underlying assumptions of Seinhorst's (13) damage model has been questioned on the basis that attraction of larvae to infected root tips would negate the criterion of independent larval activity (16). Attraction of larvae to root tips could be incorporated in the simulator if conclusive quantitative data were available. In the modified simulation model, numbers of nematodes per unit weight of root and plant damage are related through the epidemiological rationale of Vanderplank (15). T h e effect of increased density was originally expressed arithmetically, each additional nematode having equal influence on plant growth (2). Applying Seinhorst's (13) damage function to the relationship, the proportion of the root not damaged after infection by one nematode is (1 1 / T W ) , where T is the n u m b e r of nematodes per unit weight of root at which growth ceases, and W is the root weight. T h e n , the proportion of the root not damaged by (A + P) nematodes is:
(1 -- 1 / T W ) (A + ~P) where A is the n u m b e r of adult females, P the n u m b e r of third- and fourth-stage larvae, and /3 the ratio of the damage caused by a parasitic larva to that caused by an adult female. T h i s function now becomes the value (i -- X) in the simulation model (2); it represents the p r o p o r t i o n of root which is healthy and available for plant and nematode growth. At each iteration in the simulation, the root weight and n u m b e r of nematodes are calculated and updated and (1 - X) is reevaluated.
Effects of seasonal changes in host physiology: T h e r e is an annual cycle of vine (Vitis vini[era L.) growth, related to temperature and season, expressed in differential root, shoot, and berry growth, and translocation of carbohydrates to and from the roots (17). Freeman and Smart (7) observed a periodic pattern of root production in grapevines with aerial and subterranean parts competing for assimilates. Active root development began several weeks after bud burst and the start of shoot elongation, and continued until after berry maturity. It is a reasonable assumption that growth activity aboveground can be used as a measure of physiological activity within the plant at the beginning of tile annual growth cycle. This would include physiological activity of root tissues because water uptake and mobilization of stored assimilates must occur at this time. Productive activity (growth and reproduction) of the nematode parasitic stages is related to the physiological activity of the plant (1) as intensive host metabolic activity is generated at the site of host-parasite interaction (9). Accordingly, a host physiology function has been incorporated in the simulator. T h e grapevine growth algorithm is based u p o n degree-hours accumulated by the plant on a seasonal basis (2). T h e host physiology function is calculated from the rate of plant growth (vegetative and fruit) at any time relative to the m a x i m u m rate of growth during the season and is modified by root growth activity. Thus, Pt = (Gt/Gmax)(Rt/Rmax) where P t is the effect of host physiology at time t, G t represents the total aboveground growth rate and G,~,~xthe m a x i m u m growth rate possible according to the degree-hour
200 Journal of Nematology, Volume 10, No. 2, April 1978
(A)
.
2z ~i
~
.
iQo5 ~ ~rN~tto
A/"
I
'
X" \'
~
'
/ I \,, ~' /'
/I
.t,
O0
~I*00
~a. O0
~b~*O0
~,,',
"
"
~h4, O0
~bS. O0
;I
2 q q . OO
$0S.00
DRY5
(B)
~m
u.. ~.
°0', rJq
51.00
IZZ,O0
183,00 O~Y5
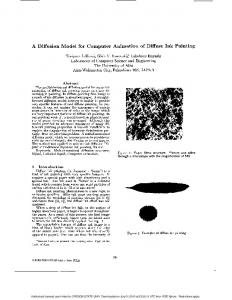
FIG. I-(A-B). Simulated population data for
Meloidogyne arenaria after model refinement, compared with field validation data. A) Eggs. B) Secondstage larvae. Broken lines indicate data from field samples for 1973. curve, Rt and R .... are equivalent values for root growth rates. T h e function influences the development and productivity of nematode parasitic stages as a multiplier in the relevant equations. T h i s arrangem e n t permits consideration of the inherent decrease in vine metabolic activity as d o r m a n c y is a p p r o a c h e d in the fall. RESULTS AND DISCUSSION Refinement of the simulation model i m p r o v e d its predictive ability (Fig. l-A, l-B), particularly regarding second-stage larvae in the soil. Simulations now show two peaks in the egg p o p u l a t i o n curve, although the predictions are offset from observations. Data of Milne and DuPlessis (10) and T y l e r (14) suggest that a b o u t 20,000 heat units (Centigrade degree-hours above 10 C) are required to complete the life cycle. T h e r e are 25,000 heat units from the simulated date of first overwintering egg-hatch (day 95) to the start of the first simulated egg p o p u l a t i o n peak (Fig. l-A),
and another 25,000 units f r o m that peak to the next (day 260). The heat units available a p p e a r sufficient for two completions of the life cycle before d o r m a n c y of the vines. T h e r e were indications of a double p e a k in the initial sample b u t not in simulations with the original model (2). T h e appearance of the simulated initial peak earlier than detected in samples, indicates a need for current studies on rates of parasitic larval d e v e l o p m e n t and on rates of egg production by females. A point of weakness in the model is the lack of data on the variability inherent in the n e m a t o d e life cycle. N o t all larvae in the vicinity of the root penetrate simultaneously, because of genetic and spatial variances. Data on larval p e n e t r a t i o n (8, f4) could be m a n i p u l a t e d into a penetration probability function relative to physiological time. A p r o p o r t i o n of M. arenaria eggs hatched more slowly than the majority, so that eggs f r o m the same age cohort could be expected to produce larvae over a considerable period (4). Similarly, variation occurs in the time of larval develo p m e n t to adult females, and p r o b a b l y in the length and pattern of egg production, because of genetic variability and differences in the suitability of infection sites. T h e s e factors will have a p r o f o u n d influence on the n e m a t o d e p o p u l a t i o n curve and on the interaction with the host. Few data are currently available, and rates used in the model frequently represent m a x i m a rather than the range of observations. Consideration of this variability should result in delay of the simulated egg p r o d u c t i o n peaks so that they a p p r o a c h coincidence with observed values. LITERATURE
CITED
1. BARKER, K. R., R. S. HUSSEY, and H. YANG. 1975. Effects of light intensity and quality on reproduction of plant parasitic nematodes. J. Nematol. 7:364-368. 2. FER.RIS, H. 1976. Development of a computersimulation model for a plant-nematode system. J. Nematol. 8:255-263. 3. FERRIS, H. 1976. A generalized nematode simulator based on heat-uni.t summation. J. Nematol. 8:284 (Abstr.). 4. FERRIS, H., H. S. DUVERNAY, and R. H. SMALL. 1978. Development of a data base on the effects of soil temperature on Meloidogyne arenaria eggs for a simulation model. J. Nematol. 10"39-42.
Simulation Model Refinement: Ferris 201 5. FERRIS, H., a n d M. V. M c K E N R Y . 1974. Seasonal fluctuations in the spatial distribution of n e m a t o d e p o p u l a t i o n s in a California vineyard. J. N e m a t o l . 6:203-210. 6. FERRIS, H., a n d R. H. SMALL. 1975. C o m p u t e r s i m u l a t i o n of Meloidogyne a r e n a r i a egg d e v e l o p m e n t a n d h a t c h at f l u c t u a t i n g temp e r a t u r e . J. Netnatol. 7:322 (Abstr.). 7. F R E E M A N , B. M., a n d R. E. S M A R T . 1976. Research note: a root ohservation laboratory for studies with grapevines. A m . J. Enol. Viticult. 27:36-39. 8. G R I F F I N , G. D., a n d J. H. E L G I N , J R . 1977. P e n e t r a t i o n a n d d e v e l o p m e n t of Meloidogyne h a p l a in resistant a n d susceptible alfalfa u n d e r differing t e m p e r a t u r e s . J. N e m a t o l . 9:51-56. 9. M c C L U R E , M. A. 1977. Meloidogyne incognita: a m e t a b o l i c sink. J. N e m a t o l . 9:88-90. 10. M I L N E , D. L., a n d D. P. DUPLESSIS. 1964. Dev e l o p m e n t of Meloidogyne javanica ( T r e u b ) Chit., o n tobacco u n d e r f l u c t u a t i n g soil t e m p e r a t u r e s . S. Afr. J. Agr. Sci. 7:673-680.
11. N I C H O L S O N , A. J. 1933. T h e balance of a n i m a l p o p u l a t i o n s . J. Anita. "Ecol. 2:132-178. 12. O O S T E N B R I N K , M. 1966. M a j o r characteristics of the relation between n e m a t o d e s a n d plants. Meded. L a n d b H o g e s c h . W a g e n i n g e n 66:46 p. 13. S E I N H O R S T , J. W. 1965. T h e relation b e t w e e n n e m a t o d e density a n d d a m a g e to plants. N e m a t o l o g i c a 11 : 137-154. 14. T Y L E R , J. 1933. D e v e l o p m e n t of the root-knot n e m a t o d e as affected by t e m p e r a t u r e . Hilgardia 7:391-415. 15. V A N D E R P L A N K , J. E. 1963. P l a n t Diseases: Epidemics a n d Control. A c a d e m i c Press, New York. 349 p. 16. W A L L A C E , H. R. 1973. N e m a t o d e Ecology a n d P l a n t Disease. E d w a r d Arnold, New York. 228 p. 17. W I N K L E R , A. J., J. A. C O O K , W. M. K L I E W E R , a n d L. A. L I D E R . 1974. G e n e r a l Viticulture. University of California Press, Berkeley. 710 p.
Dolichodorus aestuarius n. sp. ( N e m a t o d e : Dolichodoridae) 1 F. H. CHOW and A. L. TAYLOW Abstract: Dolichodorus aestuarius n. sp. from a n e s t u a r i n e h a b i t a t n e a r C e d a r Key, Florida is described. T h i s n e m a t o d e h a s a stylet r a n g e of 62-76 # m in females a n d 60-72 # m in males. T h e styler is shorter t h a n those of all described species except D. brevistilus. T h e p r o b a b l e host p l a n t is Juncus roemerianus. Key Words: n e m a t o d e , t a x o n o m y .
During May 1976, a survey of nematode fauna in estuarine habitats in the Cedar Key, Florida area was conducted, and a new species of the awl nematode (Dolichodorus) was found in a habitat where Juncus roemerianus Scheele was the only plant. It is presumed that the nematode was feeding upon the roots of this plant.
11.7), c 58.9 (52.6-67.9), stylet 66.2 /zm (60-72 tLm). Spicule 49.43 /~m (47-51 #m) and gubernaculum 26.8 t~m (26-29 /~m) (average of 7 specimens). Allotype (male): L 2.31 mm, a 51.3, b 9.7, c 60.8, styler 68 /zm, spicule 48 izm, gubernaculum 29/~m. DESCRIPTION:
Dolichodorus aestuarius n.sp. DIMENSIONS:
Paratypes (14 females): L 2.66 mm (2.502.87 mm), a 42.6 (38.8-47.8), b 11.3 (10.112.1), c 34.7 (30.9-44.8), V 55% (51-59%), stylet 68.1 /~m (62-76 t~m). Holotype (female): L 2.87 mm, a 44.2, b 11.9, c 39.9, V 2s.2, 53 %, ~0.s, stylet 68 /~m. Paratypes ( 11 males): L 2.32 mm (2.112.59 mm), a 48.1 (39.1-60.0), b 10.1 (9.2Received for publication 30 March 1977. xFlorida Agricultural Experiment Station Journal Series No. 462. ~Department of Entomology and Nematology, University of Florida, Gainesville, Florida 32611.
Females.--Body long and cylindrical, somewhat ventrally curved; tapers gradually anteriorly and abruptly posteriorly to concave, conoid terminus (Fig. 1-C,H). Cuticle very finely striated, 1.5 /zm/annule at midbody; lateral field areolated with three incisures on most of the body; incisures start as one, about 15 annules posterior to head, and end as one, just anterior to phasmid (Fig. 1-C,E,H). Head with six lips; laterals bear amphid (Fig. l-B). Stylet with comparatively broad shaft and rounded knobs; stylet slopes gently at posterior; guiding ring not seen. Esophagus typical for genus; dorsal gland orifice about 5 tzm behind