Methods. A planar computer simulation model of a spring- board and a diver was developed (Figure 1). The springboard was modeled as a uniform rod allowing.
Original Research Journal of Applied Biomechanics, 2006; 22:167-176. © 2006 Human Kinetics, Inc.
Parameter Determination for a Computer Simulation Model of a Diver and a Springboard Maurice R. Yeadon,1 Pui W. Kong,2 and Mark A. King1 Loughborough University; 2University of Texas at El Paso
1
This study used kinematic data on springboard diving performances to estimate viscoelastic parameters of a planar model of a springboard and diver with wobbling masses in the trunk, thigh, and calf segments and spring dampers acting at the heel, ball, and toe of the foot segment. A subject-specific angle-driven eightsegment model was used with an optimization algorithm to determine viscoelastic parameter values by matching simulations to four diving performances. Using the parameters determined from the matching of a single dive in a simulation of another dive resulted in up to 31% difference between simulation and performance, indicating the danger of using too small a set of kinematic data. However, using four dives in a combined matching process to obtain a common set of parameters resulted in a mean difference of 8.6%. Because these four dives included very different rotational requirements, it is anticipated that the combined parameter set can be used with other dives from these two groups. Key Words: diving, takeoff, parameters, visco elastic
A springboard diver aims to generate sufficient linear and angular momentum to somersault and twist, and to travel safely away from the board.
Yeadon and King are with the School of Sport and Exercise Sciences, Loughborough University, Loughborough, United Kingdom, LE11 3TU; Kong is with the Department of Kinesiology, Univ. of Texas at El Paso.
Because the linear and angular momenta that a diver possesses during flight are determined by the end of the takeoff phase, simple models of springboard diving takeoffs have been developed to search for the optimal timing of arm swing (Sprigings and Watson, 1985) and knee extension (Cheng and Hubbard, 2004) to produce maximum height jumps. In such models, a linear mass-spring system with no damping (Sprigings et al., 1989) has been used to represent the vertical behavior of the springboard. In order to understand the mechanics of the takeoff in terms of generating both linear and angular momentum, it will be necessary to model also the horizontal and rotational movement of the springboard because this will influence the diver’s horizontal velocity, orientation, and angular momentum. The takeoff phase of running dives begins with the touchdown on the springboard from a hurdle step in which the diver produces the initial horizontal and vertical mass center velocities. Wobbling mass models have been used to represent soft tissue movements during impact and have been shown to reproduce better ground reaction forces than rigid body models (Gruber et al., 1998; Pain and Challis, 2001). The interface of the foot and the contact surface, such as the ground (Gilchrist and Winter, 1996) or tumbling track (Yeadon and King, 2002), has been successfully modeled using spring-damper systems. In order to model the landing on the springboard, it is necessary to include viscoelastic elements allowing deformation at the foot–springboard interface because otherwise there will be an instantaneous impact between foot and board in a simulation. Alternatively, it is not clear a
167
168 Yeadon, Kong, and King
priori whether it is necessary to include viscoelastic elements to represent soft tissue movement within body segments because the springboard is itself compliant and will reduce the effects of any impact. However, it would be prudent to include such wobbling masses in a diver model in case they have a substantial effect. The question of whether such elements are needed in a model of impact with a compliant surface remains open. Indeed the level of model complexity is not a simple matter that can be established with total confidence prior to model construction. If the model is too complex, this may be established once the model is built using sensitivity analyses, whereas if the model is too simple this should be revealed during model evaluation by an inability of the model to reproduce performances accurately. Although personalized model parameters such as segmental inertias can be estimated from anthropometric measurements (Jensen, 1978; Hatze, 1980) and strength parameters may be determined from isovelocity torque measurements (King and Yeadon, 2002), the determination of segmental viscoelastic parameters is less straightforward (Pain and Challis, 2004). These parameters can be estimated indirectly from video recordings of a performance using an angle-driven human body model by minimizing the difference between simulation and performance. The use of a single performance to determine these parameters is problematic because there may not be a sufficient range of information in that one performance to determine the parameters accurately. As a consequence, when that parameter set is used for other performances, the simulations may be inaccurate (Wilson et al., 2006). Using a range of performances to determine a single parameter set may overcome this weakness. The aim of this study is to use a range of performance data to determine a single set of model parameters for a diver and a springboard that are appropriate for use in the simulation of forward and reverse dives. The ability of data on a single performance of a dive to determine such parameters will be evaluated using simulations of other diving performances, and the improvement in the procedure arising from the combined use of data on several dives will be assessed. Additionally, the need to include wobbling masses within body segments of a diving model will be investigated.
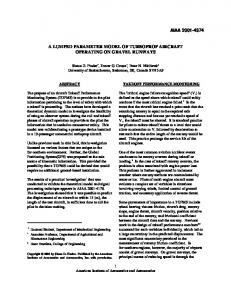
Methods A planar computer simulation model of a springboard and a diver was developed (Figure 1). The springboard was modeled as a uniform rod allowing vertical (z), horizontal (x), and rotational () movements. The vertical movement of the springboard was modeled as a linear mass-spring system with no damping, and the stiffness was allowed to increase with the distance of the foot from the springboard tip (Sprigings et al., 1989), as in Equation 1:
ks = m(d + 0.15) + c
(1)
where ks = vertical springboard stiffness, d = the distance from the toes to the tip of the springboard, and m and c are constants. The springboard stiffness was defined by the two parameters m and c. Two regression equations were obtained from experimental data to relate the horizontal and angular displacements to the vertical displacement of the springboard tip. This enabled the horizontal and angular displacement, velocity, and acceleration to be computed from the vertical displacement time history. The diver was represented by an eight-segment planar model comprising head, upper arm, lower arm, trunk, thigh, shank, and a two-segment foot. Wobbling masses were included within the trunk, thigh, and shank segments to represent soft tissue
Figure 1 — Planar simulation model of a springboard and an eight-segment diver. Wobbling masses are included in the trunk, thigh, and shank segments, and viscoelastic spring dampers are acting at the heel, ball, and toe representing the foot–springboard interface.
Parameter Determination 169
movement during the landing on the springboard (Figure 2). Each wobbling mass mw was attached to a fixed mass mf via two pairs of identical parallel and perpendicular nonlinear damped springs. The spring force was given by Equation 2:
Fw = – kwxw3 – cwvw
(2)
where Fw = spring force, kw = stiffness, cw = damping, xw = displacement, and vw = velocity (Pain and Challis, 2001). Each wobbling mass was defined by three parameters mw, kw, and cw for each of the three segments, giving a total of nine parameters.
Figure 2 — The trunk, thigh, and shank segments are each represented by a wobbling mass attached at the end points of a fixed mass by means of damped springs. The wobbling mass has three degrees of freedom because it can translate (x, z) and rotate () relative to the fixed mass.
The foot–springboard interface was modeled using three identical pairs of parallel and perpendicular damped springs acting at the toe, ball, and heel. The perpendicular force Fz in each spring was a function of perpendicular spring displacement and velocity, whereas the parallel force Fx depended on both parallel and perpendicular displacements:
Fz = – kzz – cz|z|vz
(3)
Fx = |z|(–kxx – cx|x|vx)
(4)
where k = spring stiffness, c = damping coefficient, x = parallel displacement, z = perpendicular displacement, and v = velocity. Each damped spring was defined by the same four parameters, kx, kz, cx, and cz. Each damping term was a product of both velocity
and displacement so that the damping force was zero when the displacement was zero. In addition, the horizontal force included vertical displacement as a factor so that the force was zero when the vertical displacement was zero. The FORTRAN code implementing the angledriven model was generated by the Autolev 3.4 software package based on Kane’s method of formulating the equations of motion (Kane and Levinson, 1985). There were 13 degrees of freedom in the angle-driven simulation model: 9 for wobbling mass displacements, 2 for foot position, 1 for trunk orientation, and 1 for vertical springboard displacement. The input to the model consisted of the initial conditions at touchdown, including the vertical springboard displacement and velocity; the diver’s foot position; mass center velocity; trunk orientation and angular velocity; and joint angle time histories throughout the simulation. The output of the model consisted of the time histories of the springboard movement, wobbling mass and foot–springboard interface displacements, trunk orientation, mass center velocity, and whole-body angular momentum about the mass center. Subject-specific model parameters were required to customize the model to a diver so that simulation output could be compared with the diver’s own performance. An elite female diver competing at junior international level (mass = 64.1 kg, height = 1.68 m) participated in this study as approved by the Loughborough University Ethical Advisory Committee. Anthropometric measurements of the diver were taken to calculate segmental inertias using a mathematical inertia model (Yeadon, 1990b). The remaining model parameters were the nine wobbling mass parameters, the four foot–springboard interface parameters, and the two springboard parameters described above. A high-speed Phantom V5 camera (Vision Research) operating at 200 Hz was used to record 18 dives with different rotational requirements in the forward and reverse groups from a 1-m springboard. The end of the springboard was digitized for each of the 18 dives. Four dives, which required minimal and maximal angular momentum in the two dive groups, were selected for analysis: forward dive pike (101B), forward two-and-one-half somersault pike (105B), reverse dive tuck (301C), and reverse one-and-onehalf somersault pike (303B). In each dive, 10 body landmarks (right wrist, elbow, shoulder, hip, knee,
170 Yeadon, Kong, and King
ankle, heel, ball, toes, and the center of the head) and the end of the springboard were digitized from the hurdle landing until the diver entered the water. A two-dimensional direct linear transformation method was used to reconstruct the projections of the body landmarks on a vertical plane through the center line of the springboard. The coordinate data were then used to calculate the springboard’s linear and angular displacement, the diver’s orientation, and joint angle time histories (Yeadon, 1990a), and these were fitted using quintic splines (Wood and Jennings, 1979) in order to provide continuous data and to calculate mass center velocity and wholebody angular momentum (Yeadon, 1990c). Dynamic loading of the springboard (set at the diver’s preferred fulcrum number) with various body weights was carried out to determine the vertical stiffness and effective mass of the springboard (Miller and Jones, 1999). Initial estimates of the springboard parameters m and c in Equation 1 for foot placement were taken from the study of Sprigings et al. (1990). The masses of the fixed and the wobbling elements were distributed by reestimating the segmental bone to non-bone mass ratio reported in the literature (Clarys and Marfell-Jones, 1986) using the percent body fat of the diver measured using a threesite skinfold test (Jackson and Pollock, 1985). The fixed mass (representing bone) was modeled as a uniform cylinder of known length and with a density of 1.2 kg·L–1 (Clarys and Marfell-Jones, 1986) for the shank and the thigh and 1.1 kg·L–1 (Dempster, 1955) for the trunk. The inertia parameters for the (rigid) wobbling mass were then determined in such a way that the combined mass center position and moment of inertia were equal to those calculated previously for the whole segment. The viscoelastic parameters for the diver model were determined by driving the model with known joint angle time histories with the aim of matching simulation to performance. Firstly, dives were matched individually to determine parameter values, and these were assessed by using the parameter values in the simulation of each of the three other recorded dives. Secondly, combined matching of four dives was used to determine a common set of parameter values, and the closeness of simulation matchings was compared with the individual matchings. Initial estimates of the stiffness parameters were based on trial simulations with estimates of
maximum displacements assumed to be 5 mm (foot–springboard interface), 6 mm (shank wobbling mass), 8 mm (thigh wobbling mass), and 16 mm (trunk wobbling mass). Initial estimates of the damping parameters were based on trial simulations with the requirement that critical damping should be reached after one or two oscillations. A score S was used to measure the percentage difference between the simulation and the performance in terms of the following: takeoff time (S1), maximum springboard depression (S2), mass center horizontal velocity (S3), mass center vertical velocity (S4), angular momentum about the mass center (S5), and trunk orientation (S6). To weight each of the six scores comparably, a 1° difference in orientation was counted as equivalent to a 1% difference in the other scores. In addition, penalties were used to constrain the foot–springboard interface displacements to be within 10 mm in the perpendicular direction and 15 mm in the parallel direction (Equation 5). S = (S1 + S2 + S3 + S4 + S5 + S6)/6 + penalties
(5)
In the individual matching of each of the four dives, five parameters were varied until the best match between the simulation and the performance of that dive was found by minimizing the difference score S using the simulated annealing optimization algorithm (Corana et al., 1987). The four foot–springboard viscoelastic interface parameters (kx, kz, cx, and cz in Equations 3 and 4) were varied between one-third and three times their initial estimates. The springboard stiffness was allowed to vary between 2,000 N·m–1 and 6,000 N·m–1. The nine wobbling mass parameters were kept constant at their initial estimates in order to preserve a consistent parameter set over the four dives. The four foot–springboard parameters were allowed to vary to determine whether parameters from a single diving performance were suitable for use in the simulation of another dive. The springboard parameter c was allowed to vary to compensate for small variations in fulcrum setting between dives. Additionally, two initial input values with uncertainties were also allowed to vary to compensate for measurement errors in initial values of mass center location and velocity, joint angles and angular velocities, and trunk angle and angular velocity. These variables comprised the initial trunk orientation (±1°) and angular velocity (±1 rad·s–1). The sensitivity of simulations to the five parameters was assessed by using the parameter set
Parameter Determination 171
determined from each individual matching in the other three dives. In the combined matching using all four dives, 15 parameters were varied (4 for the foot–springboard interface, 9 for the wobbling masses, and 2 for the springboard) along with another 8 initial values of the trunk orientation and angular velocity. The wobbling mass parameters were allowed to vary in the combined matching because this maintained a common parameter set for the four dives. The vertical springboard stiffness was adjusted by two parameters (m and c) in the combined matching because the four different foot placements allowed this. The four foot–springboard interface parame ters and the springboard parameter c were varied within and slightly outside the ranges obtained in the individual matchings. The nine wobbling mass parameters (stiffness, damping, and mass of the wobbling element) and the springboard parameter m were varied by ±20% from their initial estimates. Some flexibility in the initial trunk orientation (±1°) and angular velocity (±1 rad·s–1) for each dive was again allowed. In order to assess the sensitivity of simulations to individual parameters, scores corresponding to changes of ±10% in each viscoelastic and wobbling mass parameter were obtained by running single simulations. In order to assess the need to include wobbling masses in the model, single simulations were run with 500 times the wobbling mass stiffness and damping values so that there were minimal spring displacements (less than 0.5 mm in shank, 1 mm in thigh, and 2 mm in trunk). In order to assess the robustness of the method of using a number of trials to determine a common parameter set, three trials (101B, 105B, and 303B) were used to generate a common parameter set, which was then used in a simulation of the fourth trial (301C).
Results From the springboard loading measurements, the vertical stiffness of the springboard at the fulcrum number of 7.5 was 5,446 N·m–1, and the effective springboard mass was 8.87 kg. A quadratic function (Figure 3) was obtained using regression to relate the horizontal displacement to the vertical displacement of the springboard tip (x = −0.194z2, R2 = 0.98, SE = 4.8 mm). Similarly, a linear function (Figure 4) was used to relate the angular displace-
Figure 3 — Linear regression of the horizontal springboard deflection against the vertical springboard deflection squared using experimental data of 18 dives.
Figure 4 — Linear regression of the springboard rotation angle against the vertical springboard deflection using experimental data of 18 dives.
ment in degrees to the vertical displacement of the springboard tip (θ = −28.599z, R2 = 0.96, SE = 1.7°). In the individual matchings, the springboard constant c ranged from 2,830 to 3,703 N·m–1. The slope m and the constant c of Equation 1 determined from the combined matching were 7,551 N·m–2 and 3,597 N·m–1, respectively. When each dive was matched individually, the simulation matched the performance closely, with scores of 4.4% (101B), 2.2% (105B), 2.4% (301C), and 4.1% (303B). The values obtained for the foot–springboard parameters in the individual matching ranged from 2.7 to 9.0 × 10⁷ N·m–2 for parallel stiffness kx, from 0.8 to 2.4 × 10⁷ N·s·m–3 for parallel damping cx, from 2.0 to 7.2 × 10⁵ N·m–1 for perpendicular stiffness kz, and from 0.8 to 7.2 × 10⁵ N·s·m–2 for perpendicular damping cz. No penalties were incurred for excessive relative foot–springboard movement for any dives. When
172 Yeadon, Kong, and King
an individual parameter set was used in other dives, the resulting matching scores ranged from 5.9% to 30.8%. In the combined matching, reasonably close agreement between simulation and performance was found with a mean score of 8.6%. The scores for individual dives within the combined matching were 8.9% (101B), 14.2% (105B), 6.4% (301C), and 4.8% (303B). There were no penalties in general except for 301C with a 1.2-mm penalty in the perpendicular heel spring displacement. The largest discrepancy in the combined matching resulted from insufficient angular momentum being produced by the simulation of 105B. This difference may have been due to the optimization choosing a matching simulation with a shorter contact time than the performance and therefore insufficient hip flexion to generate angular momentum. Personalized segmental inertias obtained from the anthropometric measurements and viscoelastic parameters for the wobbling masses and Table 1 Personalized Segmental Inertias
Segment
Mass (kg)
Length (m)
CM from proximal joint (m)
Moment of inertia (kg·m2)
Ball/toes Ankle/ball Shank fixed Shank wob Thigh fixed Thigh wob Trunk fixed Trunk wob Upper arm Lower arm Head + neck
0.07 1.30 2.10 6.03 2.14 16.74 3.96 21.86 3.66 2.79 4.78
0.068 0.134 0.403 0.403 0.411 0.411 0.541 0.541 0.263 0.425 0.265
0.029 0.051 0.202 0.214 0.205 0.180 0.271 0.299 0.115 0.164 0.136
0.00001 0.002 0.029 0.053 0.030 0.226 0.099 0.529 0.023 0.036 0.028
Note. wob = wobbling mass; the values of mass and moment of inertia of the left and right limbs are combined. CM = segment mass center.
Table 2 Stiffness and Damping Values of the Viscoelastic Elements Parameter
Stiffness
Damping
Foot x Foot z Shank Thigh Trunk
87.9 × 10⁶ N·m–2 0.26 × 10⁶ N·m–1 1,718 × 106 N·m–3 691 × 106 N·m–3 101 × 106 N·m–3
11.1 × 10⁶ N·s·m–3 0.73 × 10⁶ N·s·m–2 148 N·s·m–1 117 N·s·m–1 76 N·s·m–1
the foot–springboard interface obtained from the combined matching are given in Tables 1 and 2. Detailed matching scores for 105B and 303B are included in Table 3. Graphs showing the comparison between combined matching simulation and performance for 105B and 303B are shown in Figures 5 and 6 with corresponding graphics sequences in Figures 7 and 8. Changing the viscoelastic parameters by ±10% generally resulted in changes of less than 1.5% in the matching scores. Exceptions were the springboard vertical stiffness constants m and c (score increased by up to 23%). Trial 303B was also sensitive to the horizontal stiffness and the vertical stiffness and damping of the foot (score increased by up to 23%), and decreased trunk wobbling mass parameters values (score increased by up to 19%). Increasing the wobbling mass stiffness and damping 500 times changed the matching scores by less than ±1.5%. The combined matching using three trials resulted in a mean score of 8.9%, which was nearly the same as that using four trials. When this parame ter set was used in the fourth trial, there was a difference score of 14.1%. Table 3 Comparison of the Matching Simulation and Performance of 105B and 303B Matching Simulation Variable
Performance
Individual
Combined
Forward two-and-one-half somersault pike (105B) 0.435 s 0.435 s 0.404 s t –0.73 m –0.73 m –0.67 m zmax –1 –1 1.33 m·s 1.33 m·s 1.31 m·s–1 vx –1 –1 4.39 m·s 4.63 m·s 4.98 m·s–1 vz 2 –1 2 –1 58.9 kg·m ·s 58.9 kg·m ·s 42.4 kg·m2·s–1 H 14° 21° 40° S 2.2% 14.2% Reverse one-and-one-half somersault pike (303B) 0.495 s 0.469 s 0.465 s t –0.74 m –0.70 m –0.70 m zmax 1.25 m·s–1 1.25 m·s–1 1.22 ms–1 vx 4.40 m·s–1 4.94 m·s–1 4.97 m·s–1 vz 2 –1 2 –1 53.9 kg·m ·s 53.9 kg·m ·s 53.7 kg·m2·s–1 H 119° 119° 118° S 4.1% 4.8% Note. t = takeoff time; zmax = maximum springboard depression; CM = segment mass center; vx = CM horizontal velocity; vz = CM vertical velocity; H = angular momentum; θ = trunk orientation; S = score.
Parameter Determination 173
Figure 5 — Comparison of combined matching simulation and performance of a forward two-and-one-half somersault pike dive (105B) in terms of mass center movement and trunk orientation (dotted line: performance; thick line: simulation).
Figure 6 — Comparison of combined matching simulation and performance of a reverse and one-half somersault pike dive (303B) in terms of mass center movement and trunk orientation (dotted line: performance; thick line: simulation).
Figure 7 — Sequences of the takeoff for a forward two-andone-half somersault pike dive (105B) showing the comparison of performance and combined matching simulation.
Figure 8 — Sequences of the takeoff for a reverse and onehalf somersault pike dive (303B) showing the comparison of performance and combined matching simulation.
Discussion
the parameter set determined from an individual matching with another dive could result in a very poor match between simulation and performance. This indicates that parameters determined from an individual matching are sensitive to the individual performance and should not be applied to other performances. Using the combined parameter set, alternatively, demonstrated a close correspondence for all four dives. The discrepancies that exist are
A single set of viscoelastic parameters for a diver and springboard model were determined using kinematic data on four diving performances by minimizing the difference between angle-driven simulations and the performances. While the mean difference between individual matching simulations and performance was less than 4%, using
174 Yeadon, Kong, and King
probably associated with errors in joint kinematics estimates obtained from manual digitization leading to noisy joint torque estimates in the angle-driven model and inherently inaccurate simulations as a consequence. This problem was particularly acute at the foot–springboard interface owing to the difficulties in locating the heel, ball, and toe positions in the same plane during digitization, as this would have led to parallax errors. It may be expected that repeated digitization of the same diving performance would lead to some improvement in the robustness of the parameters obtained because the random digitizing errors would be different. More improvement might be expected from digitizing several performances of the same dive, but even this procedure would be vulnerable if the parameters obtained were used in the simulation of a dive with different angular momentum requirements or a dive from a different group. The problem is not that different parameters would be expected for a different dive—only that a different dive would reveal the inadequacy of the parameter values based upon a narrow range of performance. The procedure of using as much variety as possible in the performances may be expected to produce the greatest robustness in the calculated parameter values. Despite the difficulties arising from the use of an angle-driven model, there is the advantage that the parameter values constitute the majority of the unknowns in this formulation whereas a torque-driven model also requires the joint torque activations to be determined in the optimization. The technique described will have a wide range of application for the determination of subject-specific viscoelastic parameters in all computer simulation models of human movement. The effective mass (8.87 kg, fulcrum number = 7.5) of the springboard measured was comparable with the values (7.6 kg and 8.1 kg, fulcrum number = 8) reported by Miller and Jones (1999) using the same dynamic springboard loading method. The vertical stiffness parameter m (7,551 N·m–2) was close to the initial estimate (7,143 N·m–2) taken from the study of Sprigings et al. (1990), whereas the parameter c (3,597 N·m–1) was less than its initial estimate (4,375 N·m–1). The calculated values of m and c correspond to a stiffness of 5,386 N·m–1, which was similar to the measured value of 5,446 N·m–1 when the toes were at the end of the springboard,
and this value lies within the range for a Maxiflex-B springboard reported by Miller and Jones (1999): approximately 4,300 N·m–1 to 5,500 N·m–1 for a fulcrum setting of 7.5. The close agreement in the takeoff time and maximum springboard depression between the matching simulations and the performances indicates that the springboard model reproduces realistic springboard movement. There was a tendency for the simulated time of contact to be slightly less than the measured time. In a simulation, contact was lost once the perpendicular foot–springboard force became zero whereas contact time was determined from the high-speed video on the basis of visible contact between the feet and the board being lost. As a consequence, in the model contact was lost before the springboard reached the horizontal whereas from the video contact was lost after the springboard reached horizontal. This springboard model, which incorporates foot placement on the springboard and allows horizontal and rotational movements in addition to vertical movement, is an improvement upon the mass-spring model of Sprigings et al. (1989) and the rotational system of Sprigings and Miller (2004). The general close agreement in the diver’s mass center velocity, angular momentum, and orientation in the individual matching demonstrates the potential of combining the springboard model with the diver model to reproduce diving takeoff movements accurately. The sensitivity analysis showed that, in general, the simulations were sensitive only to the vertical springboard parameters and for 303B the horizontal foot stiffness and the vertical foot stiffness and damping parameters. This implies that it is important to obtain sufficiently accurate springboard parame ters in modeling diving takeoffs. The characteristics of each springboard of the same model made by the same manufacturer can be slightly different (Miller and Jones, 1999) and the stiffness of the springboard is highly dependent on the fulcrum and foot position. Thus, taking the parameter values from the literature (Cheng and Hubbard, 2004), assigning parameters for a soft/hard springboard (Sprigings and Miller, 2004) or assuming the toes are at the end of the springboard may lead to large errors in simulations. Additionally, the variation in springboard stiffness resulting from small variations in the fulcrum settings may account for some of the
Parameter Determination 175
increased difference scores for the combined matching simulations (Table 3). Decreasing the stiffness and damping values of the trunk wobbling mass spring dampers by 10% increased the matching scores of 303B, whereas increasing all wobbling mass parameter values 500 times had only a small effect on all matching scores. This implies that the parameter values obtained are near the lower bound of the appropriate range and also indicates that there is no need to include wobbling masses in modeling takeoff activities from a compliant surface such as a springboard if the research focus is performance. This is an important result with relevance to modeling takeoffs in trampolining and possibly tumbling. The robustness of the method of using a number of trials to determine a common parameter set can be supported by the reasonable match of the 301C simulation using a common parameter set determined from the other three trials. Because four dives with different angular momentum requirements from different dive groups were used in the determination of the combined set of viscoelastic parameters, it can be expected that this parameter set could be used for the simulation of other dives. In order to investigate optimum technique in diving takeoffs, future research will employ a torque-driven model with the parameters determined in this study using the angle-driven model. The use of an independently derived parameter set will permit a more objective evaluation of the performance of the torque-driven model. Acknowledgment This study was supported by the International Society of Biomechanics under the Matching Dissertation Grant Program.
References Cheng, K.B., & Hubbard, M. (2004). Optimal jumping strategies from compliant surfaces: A simple model of springboard standing jumps. Human Movement Science, 23, 35-48. Clarys, J.P., & Marfell-Jones, M.J. (1986). Anthropometric prediction of component tissue masses in the minor limb segments of the human body. Human Biology, 58, 761-769. Corana, A., Marchesi, M., Martini, C., & Ridella, S. (1987). Minimising multimodal functions of continuous variables with the “simulated annealing” algorithm. ACM Trans actions on Mathematical Software, 13, 262-280.
Dempster, W.T. (1955). Space requirements of the seated operator, Wright-Paterson Air Force Base, Ohio WADCTR, pp. 55-159. Gilchrist, L.A., & Winter, D.A. (1996). A two-part, viscoelastic foot model for use in gait simulations. Journal of Bio mechanics, 29, 795-798. Gruber, K., Ruder, H., Denoth, J., & Schneider, K. (1998). A comparative study of impact dynamics: Wobbling mass model versus rigid body models. Journal of Biomechanics, 31, 439-444. Hatze, H. (1980). A mathematical model for the computational determination of parameter values of anthropomorphic segments. Journal of Biomechanics, 13, 833-843. Jackson, A.S., & Pollock, M.L. (1985). Practical assessment of body composition. Physician and Sport Medicine, 13, 76-90. Jensen, R.K. (1978). Estimation of the biomechanical properties of three body types using a photogrammetric method. Journal of Biomechanics, 11, 349-358. Kane, T.R., & Levinson, D.A. (1985). Dynamics: Theory and implementations. McGraw-Hill, New York. King, M.A., & Yeadon, M.R. (2002). Determining subjectspecific torque parameters for use in a torque-driven simulation model of dynamic jumping. Journal of Applied Biomechanics, 18, 207-217. Miller, D.I., & Jones, I.C. (1999). Characteristics of Maxiflex Model B Springboards Revisited. Research Quarterly for Exercise and Sport, 70, 395-400. Pain, M.T.G., & Challis, J.H. (2001). The role of the heel pad and shank soft tissue during impacts: A further resolution of a paradox. Journal of Biomechanics, 34, 327-333. Pain, M.T.G., & Challis, J.H. (2004). Wobbling mass influence on impact ground reaction forces: A simulation model sensitivity analysis. Journal of Applied Biomechanics, 20, 309-316. Sprigings, E., & Miller, D. I. (2004). Optimal knee extension timing in springboard and platform dives from the reverse group. Journal of Applied Biomechanics, 20, 275290. Sprigings, E.J., Stilling, D.S., & Watson, L.G. (1989). Development of a model to represent an aluminium springboard in diving. International Journal of Sport Biomechanics, 5, 297-307. Sprigings, E.J., Stilling, D.S., Watson, L.G., & Dorotich, P.D. (1990). Measurement of the modeling parameters for a Maxiflex ‘B’ springboard. International Journal of Sport Biomechanics, 6, 325-335. Sprigings, E.J., & Watson, L.G. (1985). A mathematical search for the optimal timing of the armswing during springboard diving take-offs. In D.A. Winter, et al. (Eds.), Biomechanics IX B. Champaign, IL: Human Kinetics, pp. 389-394. Wilson, C., King, M.A., & Yeadon, M.R. (2006). Determination of subject-specific visco-elastic elements. Journal of Biomechanics, 39, 1883-1890. Wood, G.A., & Jennings, L.S. (1979). On the use of spline functions for data smoothing. Journal of Biomechanics, 12, 447-479.
176 Yeadon, Kong, and King
Yeadon, M.R. (1990a). The simulation of aerial movement: I. The determination of orientation angles from film data. Journal of Biomechanics, 23, 59-66. Yeadon, M.R. (1990b). The simulation of aerial movement: II. A mathematical inertia model of the human body. Journal of Biomechanics, 23, 67-74.
Yeadon, M.R. (1990c). The simulation of aerial movement: III. The determination of the angular momentum of the human body. Journal of Biomechanics, 23, 75-83. Yeadon, M.R., & King, M.A. (2002). Evaluation of a torque driven simulation model of tumbling. Journal of Applied Biomechanics, 18, 195-206.