XXXXXXXXXXXXXX XXXXXXXXXXXX
MODULARIZING PRODUCT ARCHITECTURES USING DENDROGRAMS Katja Hölttä, Victor Tang, and Warren P. Seering
Abstract Finding common modules across products for platforming a product family or to find a common module for joint development with a partner can be challenging. At the moment there are no repeatable methods for grouping functions into modules and for choosing from different module candidates to form a good platform. We have developed a five-step algorithm that accomplishes this task of grouping and creating a dendrogram. The algorithm is based on a metric, distance function, which we define in the paper. The salient features of this algorithm are: it applies to modularization among simple as well as complex systems; it addresses the synthesis issue by a method that creates a hierarchy of modules, it does not rely on qualitative ordinal measures; it does not rely on non-repeatable heuristics, and it can be implemented and executed in a computer. The algorithm is applied on a group of four products: an intraoral camera, electronic pipette, pencil sharpener, and a fruit/veggie peeler. Keywords: Product structuring, modularization and standardization, platforming
1
Introduction
A module is a structurally independent building block of a larger system with well-defined interfaces. A module is fairly loosely connected to the rest of the system allowing an independent development of the module as long as the interconnections at the interfaces are well thought of. [1][2] The advantages of modularity are possible economies of scale and scope and economies in parts sourcing [1]. Modularity also provides flexibility that enables product variations and technology development without changes to the overall design [2]. Same flexibility allows also for independent development of modules, which is useful in concurrent design or overlapped product development [3], collaborative projects, or when buying the module from a supplier [4]. Modularity also eases the management of complex product architectures [2] and therefore also their development. Modularity can also be used to create product families [5] [6] [7]. This saves design and testing costs and can allow for greater variation but one must be aware of possible excess functionality costs if a low cost and low functionality part is replaced by a higher cost part in order to use the same part in both products [8] [9]. Modularity and product platforms have been shown to be useful [e.g. 6] but there seem to be few methods to choose the best modules for a product family or joint development platform. Baldwin and Clark [1] discuss how to modularize but they do not address the problem of what exactly should be included in a module. Ericsson [2] has developed a modularization method called Modular Function Deployment (MFD) but it is intended for single products only, not product families. Also Design Structure Matrix clustering [10] [11] is intended for single products, but it has an advantage that it has been reduced to a repeatable algorithms that
1
can be run by a computer, which enables the modularizing of also complex systems. Stake [11] introduces a clustering algorithm for MFD to group functions according to modularity driver scores. He and Blackenfelt [12] also show how MFD and DSM can be integrated to combine benefits of the two methods but they are still intended for single products only. Kota et al. [13] present a benchmark method to compare own platform to competitor’s platform. The method takes manufacturing, component’s size, and material into account in addition to functionality, but it is not a platforming tool. Stone et al. [14] discuss heuristics to group functions in a function structure [for more about function structure see 15] into modules within a product and Zamirowski and Otto [7] add three additional heuristics to apply across products in a product family. Dahmus [5] et al. apply the heuristics and introduce a modularity matrix to help decide what modules should and what should not be shared across a product family. The weakness of the heuristics is that they are not repeatable since the functional decomposition and the use of heuristics depend on the user’s point of view. Our goal is to overcome these weaknesses by introducing a more systematic method for grouping functions into modules. Another weakness of the existing methods is that they use nominal or ordinal scales instead of more rigorous ratio scales. Sosa et al. [16] use ordinal scale (-2,-1,0,1,2) in component DSMs, Ericsson [2] in MFD, and Stake [11] and Blackenfelt [12] in their combined MFD/DSM approach. Dahmus [5] as well as Zamirowski and Otto [7] suggest the use of Pugh’s concept selection that is also based on ordinal scales. Kmenta and Ishii [17] discuss the problem of performing arithmetic operations on ordinal measures. Stated simply, it produces inconsistent results. Otto and Wood [18] discuss more broadly the strengths and weakness of these different type measures. Kurshid and Sahai [19] present a rigorous treatment of these measures. Ratio scales are most useful because the point zero has meaning, and mathematical operations such as multiplying and dividing have meaning, e.g., meters/second. In this paper, we address the weakness of all the above. We use a more flexible flow method [20] for identifying possible modules in a function structure and our algorithm can be put into a computer. In addition we develop a genuine metric space with a distance function that is based on the flow characteristics and we will use a ratio scale. This algorithm is designed especially for the flow method [20] but it could possibly be used also in conjunction with other modularization methods. The flow method is based on the heuristics introduced by Stone et al. [14] and further developed for product families by Zamirowski and Otto [7]. The difference is that in flow method the focus is on the flows instead of the functions in a function structure. Functions can even be ignored since often the end result (outputs) and the requirements needed to achieve it (inputs) are all that matter. The flow method was designed to identify commonalties between different products. It is more flexible than the function focused heuristics and can therefore be used also in case of joint development of a common module for even very different products. It is also applicable in product family platforming. The problem we address in this study is how to group functions in a functional decomposition, such as a function structure, to form a module commonalty hierarchy that can be used to define common modules across products. The following section will introduce the grouping algorithm. We will then go on to show an example of this method applied to four products. We will end the article with our conclusions and suggestions for further study.
2
2
Algorithm
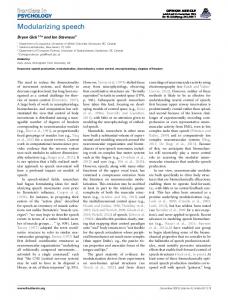
This is a five-step algorithm to calculate the “distance”, which will be defined, between any two modules and group modules into a hierarchical dendrogram [21] that will help decide what function groups are similar enough to be replaced by a common module. Pedersen [22] has also used clustering and dendrograms to create product families, but his approach is based on existing products and is not applicable at product architecture face. We start by creating function structures for each product that is considered to be either part of the same product family platform or developed partially with a partner. We will then look for similar outputs in each function structure, e.g. for rotary motion or gas and thermal energy. We will then start grouping functions before, or close, to the function with the similar outputs and draw black boxes with the outputs and all the inputs that the grouped functions bring to the bundle. Each product should have a couple of alternative black boxes to have more to chose from. We can repeat the procedure for other similar outputs that are found in the function structures. Since many flows, such and torque and rotation speed, depend on one another, they should be combined into a single input or output to avoid redundancy. We will use power as the input and output flow for all power related flows e.g. instead of two flows torque and angular velocity, we use a single flow torque∗velocity. Similar strategy is used in [23] with bond graphs. We are now ready to start the algorithm it self. Step 1: Enumerate all the components, i.e. black boxes. Enumerate all the black boxes to form a seti [mi] i.e. m1,m2,m3,…,mn Step 2: Characterize all the black boxes. Characterize all the black boxes by their inputs and outputs. For example for module mα: xα1 xα2 xα5
mα
yα1 yα2 yα5
Figure 1 Input /output characterization for module mα.
The input set consists of five inputs as follows: xα1 xα2 xα3 xα4 xα5
electrical power translational power rotational power information translation
voltage*current force*velocity torque*angular velocity bandwidth stroke distance
in in in in in
watts watts watts bits mm, m, etc.
yα1, yα2, yα3, yα4, and yα5 are defined in a similar matter. One should notice, that the set of inputs and outputs can be expanded and reduced as needed. We use five in this exemplary case without loss of generality. Step 3: Screen the black boxes for potential groupings. Our goal is to find out how similar two modules are e.g. what is their distance from one another. To define the distance between two modules (mα and mβ), we will start from the distance between inputs and outputs. We say that the distance between inputs xαi and xβi is sαβi, where
3
s1αβ =
( x5α − x5β ) ( x1α − x1β ) αβ s = , …, 5 max( x1α , x1β ) max( x5α , x5β )
(1)
The distance tαβi between outputs yαi and yβι is defined as follows
t1αβ =
( y 5α − y 5β ) ( y1α − y1β ) αβ , …, t = 5 max( y1α , y1β ) max( y 5α , y 5β )
(2)
From the equation (1) we clearly see that if xαi = xβi then sαβi=0. In general sαβi can be less or greater than or equal to zero for i=1,2,3…5. The same applies for outputs in equation (2). Step 4: Calculate the distance metric among black boxes.
We define pseudo-distance between mα and mβ by
m αβ = (( s1αβ ) 2 + ( s 2αβ ) 2 + ... + ( s5αβ ) 2 + (t1αβ ) 2 + (t 2αβ ) 2 + ... + (t 5αβ ) 2 )
(3)
In addition, we define that sααI=0. Now, mαβ≥0 always, and distance matrix M matrix [M] m 1
m 2 m 3 m 4 m
1
m
0 1,52 2,15 1,19
2
m
1,52 0 2,40 2,43
3
2,15 2,40 0 0,78
m
4
2,19 2,43 0,78 0
Note that matrix M is symmetric and that it satisfies all the conditions for an Euclidean metric i.e. it is non-negative, idempotent, reflexive, and the triangle inequality applies. Step 5: Build the dendrogram.
Build the dendrogram by starting with the two modules that have the smallest distance. Connect these modules at their distance value (see Figure below). Take then the next module pair that has neither one of the modules already in the dendrogram and connect them to each other at their distance value. Continue by adding a module at a time that has the shortest distance to either one of the module groups already on the dendrogram and connect it at its distance value to the module group that is closest to it. Continue until the two module groups are connected to one another and all modules are in the dendrogram.
Distance
Figure 2 Exemplary dendrogram.
m3
m4
4
m1
m2
3
Example
We will now show in more detail how to use this algorithm. We will apply it on four products: an intraoral camera, an electronic pipette, a pencil sharpener, and a fruit and veggie peeler. These products are very different and produced by different companies but we want to show that our method, in fact, finds reasonable commonalties between the products. Our goal is not to platform these products but just show with a simple but challenging example how our idea works. Partial function structures around the identified common outputs are shown in Figure 3. image intraoral camera
info to run the drive
measure image resolution
convert electricity to translation
translation
E
E pipette
convert elect. rot to rotation
rot
change rotation
transmit rotation
rot
info to run the motor E pencil sharpener
pencil
E
rot
convert rotation to translation
trans
transmit rotational energy
rot
position
import electricity
E
actuate electricity
E
convert elect. rot to rotation
change rotational energy
rot
sharp pencil, shavings
separate solid
reaction force
human force
fruit/veggie peeler
indicate position
import electricity
E
guide rotation
rot
guide rotation
rot
actuate electricity
E
change rotation
rot
rotate solid
regulate electricity
E
convert elect. rot to rotation
convert trans guide rotation to translation translation
separate solid
distribute rotation
rot rot
change friction
peel, peeled food
food
Figure 3 Exemplary products, veggie peeler and pencil sharpener from [18].
Step 1. We chose to form just one black box for the two simplest products, the intraoral camera and the pencil sharpener, and three alternative black boxes for the electronic pipette and two for the fruit and veggie peeler. The black boxes and their enumeration are show in Figure 4.
Black box m1 is simply the function “convert electricity into translation” in the intraoral camera’s function structure. Black box m2a entails the function chain “convert electricity to rotation – change rotation – transmit rotation – indicate position – convert rotation to translation” from the electronic pipette’s function structure. Black box m2b is the same chain without the last two functions “indicate position - convert rotation to translation” and black box m2c is same as m2a less the last function “convert rotation to translation”. Black box m3 entails the pencil sharpener’s function chain “import electricity – actuate electricity – convert electricity to rotation – change rotational energy”. Black box m4a represents the function chain
5
“import electricity – actuate electricity – regulate electricity – convert electricity to rotation” in the fruit/veggie peeler’s function structure. Black box m4b is the same function chain plus “– guide rotation – change rotation – convert rotation to translation”. x14
info to run the drive
intraoral camera
x
1 1
1
m1
E
y 2a y 2a 2 5 2a 1
x
m2a
pipette
x
2a info to run 4 the motor
x13
pencil sharpener
x14a
fruit/veggie peeler
x12b
transl
E
E
E
m4a
y 2b 3
E
y 2a 4
rot
m2b
x 2b 4
rot
y 33
rot
x14b E
rot
m2c
transl
y 4b 2
y 2c 3
position
info to run the motor
m4b
y 4a 3
x12c E
x 2c 4
info to run the motor
position
m3
y 15
transl y 2
y 2c 4
y 45 b
Figure 4 Exemplary black boxes.
Step 2. We will use the same black box characterization as shown above. The values used in this calculation are imaginary but reasonable for the types of products in question. Table 1 Module inputs and outputs. module 1 inputs
module 1 outputs
x 11 x 21 5 module 2a inputs
x 31
x 41 1
x 51
x 22 x 12 5 module 2b inputs
x 32
x 42 1
x 52
2
2
2
2
3
3
4
4
4
4
x2 x1 5 module 2c inputs x2 x1 5 module 3 inputs
x2 x1 10 module 4b inputs x2
2
x3
2
x3
3
x3
4
x3
4
x4 1
2
x4 1
2
x4
3
x4
4
x4
4
x5
2
x5
2
x5
3
x5
4
x5
4
y21 5 module 2a outputs
y31
y41
y51 15
y12
y32
y42 2
y52 10
y22 5 module 2b outputs y1
2
y2
2
2
2
y5
2
y3 10
y4
y32 10
y42 2
y52
y33 15
y43
y53
module 2c outputs y12
y22
module 3 outputs
x2 x1 5 module 4a inputs
x1 10
x3
y11
y13
y23
module 4a outputs y1
4
y2
4
4
4
y3 20
y4
y34
y44
y5
4
module 4b outputs y14
y24 5
y54 12
Step 3-4. We calculated the distance between each module except between alternative modules from a same product and placed the distances in matrix M. Note that the shaded cells stand for distance between alternative modules in a same product and are thus meaningless and left blank.
6
matrix [M] m 1
m 2a m 2b m 2c m 3 m 4a m 4b m
1
m 0
2a
m
1,05 0
2b
m
1,73
2c
m
2,00
3
2,00 2,24 1,05 1,45 0
0 0 SYMMETRIC
m
4a
m
4b
2,06 2,29 1,22 1,58 0,56 0
1,14 1,51 2,06 2,29 1,80 0
Figure 5 Distance matrix M.
Step 5. We build the dendrogram.
1.5
1.0
.5 m2a
m1
m4b
m2b
m3
m4a
m2c
Figure 6 Dendrogram.
The dendrogram grouped the black boxes according to the type of output force. The three modules on the left represent linear motors and the four on the right rotary motors. This is intuitively a smart way of categorizing the exemplary black boxes. Black box m2c clearly stands out as a module that barely belongs to either category: linear or rotary motors. Closer examination of the module reveals that m2 black boxes are the only rotary motors that have information as input and output, which explains the difference. Two modules, on the other hand, strike as very close to one another in the dendrogram: m4a and m3. These two modules represent black boxes that have exact same flows, only the values differ slightly. Redesigning a common module so that it fits to the original products requires design changes. If we decided to replace the drives in intraoral camera, electronic pipette, and fruit/veggie peeler with a single module i.e. replace modules m2a, m1 and m4b with a single module that has all the required inputs as shown below, some design changes are needed. info to run the drive
transl
E
position
Figure 7 a common module to replace modules m2a, m1 and m4b
7
The electronic pipette has the most complex drive and all the flows of the common module, so only the flow values, information content and amount, voltage, translation speed, stroke length, and accuracy etc., need be adjusted for both the module and the pipette’s module interface. The other two designs need to accommodate flows that they would not otherwise need in addition to adjusting the flow values. The intraoral camera does require position information, but if a common module is chosen to be used and the position information will be there, the intraoral camera needs to be redesigned to accommodate the new flow or even to take use of the new information provided. The fruit/veggie peeler’s original drive was simpler than the new module. Thus there is a tradeoff between over functionality and the benefits from a common module. Another choice, suggested by the dendrogram, is to leave the most complex module, that of the electronic pipette, out of the common module and standardize the two simpler modules. The cost of over functionality and redesign effort is proportional to the distance in the dendrogram. A critical distance, over which commonalizing costs override the benefits, can be calculated for each specific case to help decide what modules to replace by a common module. Concentrating on flows and clustering possible module candidates in a dendrogram highlights differences and commonalties and is a good tool in making a decision how much to commonalize, and what to include and exclude from a common module
4
Discussion
We have shown how a five-step algorithm can be used to group functions in a function structure to form a hierarchy for platform module selection. We focused on flows instead of functions in the function structure, which makes the method more independent of decomposition decisions and enables the use of ratio scales. The core of our approach is predicated on the notion of modules being “close” by virtue of a “distance” function in a function flow system structure. For a distance function, it is necessary to have more information than ordinal rankings or interval scales can provide, because we need to create a metric among modules where zero has meaning. We applied the algorithm on a simple example but we see no problem of applying it also on complex systems since the flow method and our algorithm can be programmed on a computer. Our algorithm treats all flows equal; in real life they will exhibit much more variety. Fixson suggests that interfaces have different intensities. He also points out that different connections have different degrees of reversibility and this should affect the complexity of the interactions of the module to the rest of the system. [24] Work is underway to define the intensities. We used real products as examples, but we used hypothetical input and output values. The case itself is imaginary i.e. the products are not being considered for a real platform and we can thus not test how our platform suggestions would work in real product platforms. Future research is needed to be able to decide what distance value is still acceptable compared to the benefits of common platform. For example, should one group only m1 and m4b into one module, or rather all three: m1, m4b, and m2a? The advantages of this algorithm are: it applies to modularization among simple as well as complex systems; it addresses the synthesis issue by a method that creates a hierarchy of modules, it does not rely on qualitative ordinal measures; it does not rely on non-repeatable heuristics, and it can be implemented and executed in a computer guaranteeing repeatability. References
[1]
Baldwin C.Y. and Clark K.B. “Design rules. Volume 1. the power of modularity”, The MIT Press, Cambridge, Massachusetts, 2000.
8
[2]
Ericsson A. and Erixon G., “Controlling design variants: modular product platforms”, ASME press, New York, 1999.
[3]
Roemer T.A., Ahmadi R., and Wang R.H., “Time-cost trade-offs in overlapped product development”, Operations Research, Vol 48, No. 6, 2000, pp.858-865.
[4]
Camuffo A., “Rolling out a “World Car”: globalization, outsourcing and modularity in the auto industry”, Working Paper, International Motor Vehicle Program, Massachusetts Institute of Technology, 2001.
[5]
Dahmus J.B., Gonzales-Zugasti J.P., and Otto K.N. “Modular product architecture”, Proceedings of DETC 00, ASME Design Engineering Technical Conferences, Baltimore Maryland, 2000.
[6]
Meyer M.H. and Lehnerd A.P., “The power of product platforms” The Free Press, New York, 1997.
[7]
Zamirowski E.J. and Otto K.N., “Identifying product family architecture modularity using function and variety heuristics”, 11th International Conference on Design Theory and Methodology, ASME, Las Vegas, 1999.
[8]
Gupta S. and Krishnan V., “Integrated component and supplier selection for a product family”, Production and Operations Management, 8 (2), 1999, pp.163-181.
[9]
Krishnan V. and Gupta S., “Appropriateness and impact of platform-based product development”, Management Science, Vol. 47, No. 1, 2001. pp.52-68.
[10] Pimmler T.U. and Eppinger S.D., “Integration analysis of product decompositions”, ASME Design Theory and Methodology Conference, Minneapolis, 1994. [11] Stake R.B., “On conceptual development of modular products”, Doctoral Thesis. Division of Assembly Systems, Dept. of Production Engineering, Royal Institute of Technology, Stockholm. 2000. [12] Blackenfelt M., “Modularisation by matrices – a method for the consideration of strategic and functional aspects”, Proceedings of the 5th WDK Workshop on Product Structuring, Tampere, Finland, 2000. [13] Kota S., Sethuraman K., and Miller R., “A metric for evaluating design commonality in product families”, Journal of Mechanical Design, Vol. 122, 2000, pp.403 – 410. [14] Stone R.B., Wood K.L., and Crawford R.H., “A heuristic method for Identifying Modules for Product Architecture”, Design Studies, Vol 21, Issue 1, 2000, pp.5-31. [15] Pahl G. and Beitz W., “Engineering design”, Springer-Verlag, London, 2nd ed., 1999. [16] Sosa M.E., Eppinger S.D., and Rowles C.M., “Understanding the effects of product architecture on technical communication in product development organizations”, MIT Sloan School of Management Working Paper 4130, 2000. [17] Kmenta S. and Kosuke I., “Scenario-based FMEA: a life cycle cost perspective”, Proceeding of DETC 00. ASME Design Engineering Technical Conferences, Baltimore Maryland, 2000. [18] Otto K. and Wood K., “Product design: techniques in reverse engineering and new product development”, Prentice Hall, Upper Saddle River, New Jersey, 2001.
9
[19] Khurshid A. and Hardeo S., “Scales of measurements: an introduction and a selected bibliography”, Quality and Quantity, 27, 1993, pp.303-324. [20] Hölttä K., “Identifying common modules for collaborative R&D”, Presented at POM 2002 Meeting on Production and Operations Management, San Francisco, 2002. [21] Mantegna R.N. and Stanley H.E., “An introduction to econo physics: correlations and complexity in finance”, Cambridge University Press, Cambridge, UK. 2000. [22] Pedersen K., “Designing platform families: an evolutionary approach to developing engineering systems”, Doctoral Thesis, Georgia University of Technology, 1999. [23] Karnopp D. and Rosenberg R., “System dynamics: a unified approach”, John Wiley & sons. 1975. [24] Fixson S., “Methodology development: analyzing product architecture implications on supply chain cost dynamics”, Presented at the 5th Conference on Technology, Policy, and Innovation “Critical Infrastructures”, Delft, 2001. Corresponding author: Katja Hölttä Visiting Scholar Massachusetts Institute of Technology Center for Innovation in Product Development Cambridge, Massachusetts 02142, U.S.A.
Helsinki University of Technology Department of Machine Design P.O.Box 4100 02015 HUT Finland Tel: Int +358 9 451 5072 Fax: Int +358 9 451 3549 E-mail:
[email protected]
10