REPORTS g/ml). After washing, cells were stained with fluorescein isothiocyanate–conjugated anti-rat immunoglobulin G for 45 min on ice, washed, and analyzed by flow cytometry with a FACScan analyzer (Becton Dickinson, Oxford, UK). 23. J. Van Damme et al., Chem. Immunol. 72, 42 (1999). 24. A. J. Gearing et al., Nature 370, 555 (1994).
25. C. L. Wilson et al., Science 286, 113 (1999). 26. G. Openakker, S. Masure, B. Grillet, J. Van Damme, Lymphokine Cytokine Res. 10, 317 (1991). 27. J. J Letterio and A. B. Roberts, Annu. Rev. Immunol. 16, 137 (1998). 28. C. M. Overall, J. L. Wrana, J. Sodek, J. Biol. Chem. 266, 14064 (1991).
Modulation of Human Visual Cortex by Crossmodal Spatial Attention Emiliano Macaluso,1,2* Chris D. Frith,2 Jon Driver1 A sudden touch on one hand can improve vision near that hand, revealing crossmodal links in spatial attention. It is often assumed that such links involve only multimodal neural structures, but unimodal brain areas may also be affected. We tested the effect of simultaneous visuo-tactile stimulation on the activity of the human visual cortex. Tactile stimulation enhanced activity in the visual cortex, but only when it was on the same side as a visual target. Analysis of effective connectivity between brain areas suggests that touch influences unimodal visual cortex via back-projections from multimodal parietal areas. This provides a neural explanation for crossmodal links in spatial attention. Spatial attention picks out particular locations for further sensory processing. Most studies of spatial attention have considered only a single sensory modality at a time (1, 2), but crossmodal links have now been demonstrated psychophysically. For instance, a tactile cue at one location can improve discrimination for visual stimuli at that location relative to others (3, 4). This crossmodal effect arises even if the tactile cues are task-irrelevant and do not predict the location of the visual targets, suggesting an exogenous (stimulusdriven) attentional mechanism. The neural basis of these crossmodal effects in humans remains unknown. It has generally been assumed that they affect only multimodal neural structures (5–7), but recent accounts suggest that back-projections from multimodal areas to unimodal areas may play a role (8–10). We used event-related functional magnetic resonance imaging (f MRI) (11) to test whether tactile stimuli can spatially influence unimodal visual areas via back projections. On each trial, the participants (12) received visual targets in either the left or right hemifield in a manner that was unpredictable. On a randomly chosen half of the trials, this visual stimulus was coupled with concurrent tactile stimulation to the right hand (i.e., at the same external location as any right visual stimulation) (13). Four event types were or1 Institute of Cognitive Neuroscience, University College London, UK. 2Wellcome Department of Cognitive Neurology, Institute of Neurology, London, UK.
*To whom correspondence should be addressed. Email:
[email protected]
1206
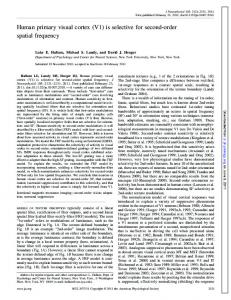
ganized in a 2 by 2 factorial design. One factor was the side of visual stimulation (right or left). The second factor was the occurrence of right tactile stimulation ( present or absent). Our analysis first established the effect of lateralized visual stimulation on contralateral occipital areas. We then tested whether responses within these areas were modulated by the presence of tactile stimulation (14). Figure 1 shows activations due to the side of the peripheral visual stimulation. As expected, activations were found in contralateral occipital areas. The main effect of left hemifield visual stimulation was a cluster of activation in the posterior part of the right lingual gyrus, contralateral to the visual targets. The maximum activation was at x, y, z ⫽ 30, – 84, –14 (Z score ⫽ 4.8; P-corrected ⫽ 0.005). The reverse comparison showed
29. We thank G. Pelman for synovial fluid samples. Supported by a grant from the National Cancer Institute of Canada (NCIC), with funds provided in part by the Canadian Cancer Society, and by Medical Research Council Group grant funding. G.A.M. is supported by a NCIC studentship. 2 May 2000; accepted 30 June 2000
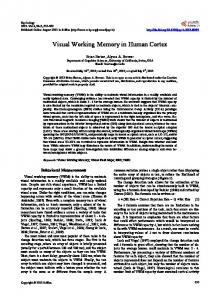
that stimulation in the right hemifield also activated the posterior part of the lingual gyrus, now in the left hemisphere (x, y, z ⫽ –24, –74, –10; Z score ⫽ 5.1; P-corrected ⬍0.001) (15). These symmetrical activations in the lingual gyri define a brain response that is sensitive to the side of our visual stimulation. We then examined the effect of concurrent right tactile stimulation on these contralateral responses by testing for the interaction between the side of the visual stimulation and the presence of touch. The analysis revealed amplification of visual response to lights on the right side by touch on the same side. The left lingual gyrus showed a significant interaction, with the maximum at x, y, z ⫽ –18, – 82, – 6 (Z score ⫽ 3.2, P-corrected ⫽ 0.044) (Fig. 2). Thus, the left lingual gyrus not only responded to right visual stimulation, but did so more strongly with concurrent tactile stimulation on the right (compare red curve with blue curve in left graph of Fig. 2C). Such modulation was not simply due to this brain area responding directly to touch. The crossmodal amplification was spatially specific because bimodal stimulation that was spatially incongruent (i.e., adding right tactile to left visual stimulation) did not cause any signal increase in the same area (see magenta curve in right graph of Fig. 2C). By contrast, in the right lingual gyrus, responses to left visual stimuli tended to show a reverse pattern of suppression by right touch, though this was not significant. In a follow-up study, tactile stimulation was delivered to the left hand instead. This produced mirror-image results with significant cross-
Fig. 1. Effect of side of the visual A B stimulation. The effect of peripheral visual stimulation was projected on a rendered view of the canonical MNI brain template. The cerebellum was removed and the brain was tilted to allow a direct view of the ventral surface of the occipital lobes. (A) Main effect of left versus right visual stimulation. Comparison Right lingual gyrus Left lingual gyrus of left versus right events (with P < 0.001 P < 0.001 and without tactile stimulation) revealed activation of the right lingual gyrus, contralateral to the visually stimulated side. The right middle and superior occipital gyri showed a similar trend. (B) Main effect of right versus left visual stimulation. This comparison also revealed activation of the lingual gyrus, now in the left hemisphere, contralateral to the stimulated hemifield. The cluster was symmetrical to the ventral activation observed in the right hemisphere for the opposite comparison. Additionally, significant contralateral responses were observed (15) in the left middle and superior occipital gyri (not visible in this projection).
18 AUGUST 2000 VOL 289 SCIENCE www.sciencemag.org
REPORTS the lingual gyrus (Fig. 3B) during spatially congruent bimodal stimulation. The only additional areas to show increased coupling were the right posterior parietal lobule (x, y, z ⫽ 16, – 68, 52; Z score ⫽ 3.5) and left lateral occipital gyrus (x, y, z ⫽ –34, – 82, 16; Z score ⫽ 3.7). Reciprocal connections between occipital cortex, posterior parietal cortex, and multimodal areas in the inferior parietal lobe might provide the anatomical substrate for the crossmodal interaction observed in the lingual gyrus. Although there are no known direct connections from the supramarginal gyrus (or area 7b in monkeys) to posterior ventral occipital areas, pathways may
exist via posterior parietal areas (23, 24). Tactile information from the postcentral gyrus (i.e., contralateral somatosensory cortex) might thus be transferred to occipital areas (contralateral visual cortex) via back-projections from parietal areas. This process depends on whether the visual and tactile stimuli are on the same side. Our findings allow several conclusions. First, they demonstrate that spatial cueing in one modality can affect activity in structures that only receive afferent input from a different modality. Second, such crossmodal influences of touch on the visual cortex depend on the spatial relation be-
Effect size (SE)
Effect size (SE)
Fig. 2. Crossmodal effects in the A B 6 left lingual gyrus. An interaction 5 between side of the visual stim4 ulation and the presence of right 3 somatosensory input was detected in the left lingual gyrus. 2 We found signal amplification 1 when the right visual stimulus 0 was coupled with the right tac1 2 3 4 5 6 P < 0.05 tile stimulation. (A) Group reSubject sults of activation rendered on the brain surface. (B) Size of the C Right visual stimulation Left visual stimulation interaction effect for each sub6 6 ject (with SE). The search volume Right touch Right touch 4 4 for each subject-specific maxiNo touch No touch mum was restricted to the same 2 2 region as for the group effect 0 0 (i.e., areas showing a main effect of side of the visual stimulation). -2 -2 The plotted effect is the weight-4 -4 ed sum of parameter estimates 0 20 40 0 20 40 from the multiple regression. For Time after stimulus onset (sec) Time after stimulus onset (sec) the interaction shown, this weighting corresponds to participants receiving right visual stimuli with right tactile stimuli versus those without right touch, minus participants receiving left visual stimuli with right tactile stimuli versus those without. All effects are scaled to SE units. (C) Estimated signal in the cluster showing significant amplification of response to right visual stimuli by right touch. The shape of the curves reflects the function used to fit the data. The effect size (scaled to SE units) is the sum of the parameter estimates for the six participants for each of the four events. For each event type, the parameters were estimated by fitting the mean signal across the activated voxels. Effect size (SE)
www.sciencemag.org SCIENCE VOL 289 18 AUGUST 2000
Effect size (SE) Effect size (SE)
P < 0.01
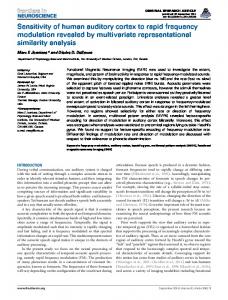
Fig. 3. Changes in effective con- A 5 nectivity with the left lingual gy4 rus. Such changes were revealed 3 by testing for condition-specific 2 changes in the contribution of 1 any other brain areas to the fMRI 0 signal in the left lingual gyrus -1 (18). The right supramarginal gy1 2 3 4 5 6 rus in the inferior parietal lobe y = -22 Subject (A) demonstrated the most significant change in effective con4 nectivity with the left lingual gy- B 3 rus. This inferior parietal region showed higher coupling during 2 bimodal, spatially congruent tri1 als than during bimodal, spatially 0 incongruent trials. A similar pattern was found in the left post-1 central gyrus (B), which is the 1 2 3 4 5 6 y = -34 somatosensory area contralaterSubject al to the stimulated hand. For both brain areas, effects for individual participants are plotted on the right side of the figure (scaled to SE units). P < 0.01
modal attentional effects now in the right lingual gyrus, which showed maximal response for left visual stimulation combined with left touch (16). The lingual gyrus has long been considered a unimodal visual area, with no tactile afferent inputs. This agrees with the lack of any main effect from tactile stimulation in this region (Fig. 2C). A main effect of adding right touch (i.e. regardless of side of visual stimulation) was found only in the left superior postcentral gyrus and postcentral sulcus (x, y, z ⫽ – 44, – 40, 56; Z score ⫽ 4.8; P-corrected ⬍0.001) and in the parietal operculum (x, y, z ⫽ – 64, –22, 16; Z score ⫽ 5.6; P-corrected ⬍0.001). All these tactile activations occur in somatosensory areas (17) contralateral to the stimulated hand; no such overall increase with touch was found anywhere in the occipital lobe. What is the source for the crossmodal spatial effect in the lingual gyrus? We hypothesized that tactile information reaches the occipital lobe via back-projections from higher multimodal areas. We performed a second analysis, testing for condition-dependent changes in “effective connectivity” (18). This analysis highlights changes in the coupling between brain areas (i.e., the contribution of one area to the f MRI signal measured in a different area), which depend on the experimental condition. We anticipated that areas mediating the observed crossmodal influence should increase their effective connectivity with the left lingual gyrus only during the spatially congruent bimodal stimulation, for which the amplification in the left lingual gyrus had been observed. We tested for any such increase of effective connectivity with the left lingual gyrus specific to the spatially congruent bimodal stimulation across the whole brain. Only a few circumscribed areas showed the predicted increase in effective connectivity, indicating a highly specific network. The most robust effect was in the right inferior parietal lobe (x, y, z ⫽ 52, –22, 34; Z score ⫽ 4.0), in the anterior part of the supramarginal gyrus (Fig. 3A). This area has been suggested to be the homolog of area 7b in monkeys (19), where single-unit electrophysiology has demonstrated the presence of visuo-tactile neurons with spatially corresponding bimodal receptive fields (20). The right-hemisphere lateralization of this activation agrees with previous proposals that, in the human parietal lobe, the right-hemisphere plays a dominant role in spatial representation and attention (21), consistent with studies of deficits in neurological patients (22). The left postcentral gyrus (x, y, z ⫽ –30, –34, 56; Z score ⫽ 3.3), which is the somatosensory cortex contralateral to the stimulated right hand, also showed condition-specific increases in coupling with the visual area in
1207
REPORTS tween visual and tactile sensory input. Finally, the analysis of effective connectivity suggests that tactile input to the somatosensory cortex may influence the visual cortex via back-projections through association areas in the parietal lobe. This accords with recent theoretical proposals (8) that such back-projections may play a crucial role in crossmodal links in spatial attention. References and Notes
1. S. A. Hillyard, G. R. Mangun, M. G. Woldorff, S. J. Luck, in The Cognitive Neurosciences, M. S. Gazzaniga, Ed. (MIT Press, Cambridge, MA, 1995), pp. 665– 681. 2. H. E. Pashler, The Psychology of Attention (MIT Press, Cambridge, MA, 1998). 3. C. M. Butter, H. A. Buchtel, R. Santucci, Neuropsychologia 27, 1231 (1989). 4. C. Spence, M. E. Nicholls, N. Gillespie, J. Driver, Percept. Psychophys. 60, 544 (1998). 5. M. J. Farah, A. B. Wong, M. A. Monheit, L. A. Morrow, Neuropsychologia 27, 461 (1989). 6. M. I. Posner, in Cognitive Neuropsychology and Neurolinguistics: Advances in Models of Cognitive Functions and Impairment, A. Caramazza, Ed. (Erlbaum, Hillsdale, NJ, 1990), pp. 187–210. 7. G. Di Pellegrino, E. La `davas, A. Farne ´, Nature 388, 730 (1997). 8. J. Driver and C. Spence, Trends Cogn. Sci. 2, 254 (1998). 9. R. Hahnloser, R. J. Douglas, M. Mahowald, K. Hepp, Nature Neurosci. 2, 746 (1999). 10. P. E. Haenny, J. H. R. Maunsell, P. H. Schiller, Exp. Brain Res. 69, 245 (1988). 11. Data acquisition. For each participant, fMRI data were acquired in a single session lasting 28 min. Each of the four possible event types was repeated 50 times, in randomly intermingled sequence. The interstimulus interval was 8.22 ⫾ 4.11 s (uniform distribution sampled at 85-ms intervals). Functional images were acquired with a 2T Magnetom VISION MRI scanner (Siemens, Erlangen, Germany). BOLD (blood oxygenation-level dependent) contrast was obtained with echo-planar T2* weighted imaging (EPI). For each participant, we acquired 400 volumes in a transverse orientation with 48 slices and an effective repetition time (TR) of 4.11 s. The voxel size was 3 mm by 3 mm by 3 mm. 12. Participants. Six neurologically healthy volunteers participated (mean age 27 years old; range 21 to 34 years old; all right-handed males). After receiving an explanation of the procedures, participants gave written informed consent. The study was approved by the Joint Ethics Committee of The Institute of Neurology and The National Hospital for Neurology & Neurosurgery, London. 13. Stimuli and task. The visual stimulation consisted of light-emitting diodes (LEDs) flickering (at 10 Hz) for 300 ms in one visual field or the other. Two arrays of three LEDs each (arranged to form an equilateral triangle with sides of 2 cm), were placed 10 cm to the left or right of the central fixation point, at 6 degrees of visual angle. The right array was attached to the right index finger, where any concurrent tactile stimulation was delivered. This was a vibration (60 Hz) lasting 300 ms, generated by a pulsed current passed through a coil in the magnetic resonance scanner’s magnetic field. Participants viewed the LEDs and the fixation point via a mirror placed on top of the whole-head radio-frequency coil. The inside of the magnet was illuminated, so participants could also see their right hand placed vertically on a plastic support, with the right LEDs placed on the index finger.
1208
Through the mirror, the right hand still appeared in the right visual hemifield next to the right LEDs. We took care to place the right light very near the right hand in this way, as previous evidence suggests that visuo-tactile links depend on the proximity of visual stimuli to the current location of the hand in external space (7, 8, 20). Future work could vary this proximity systematically in our imaging paradigm. During scanning, participants were asked to respond every time they saw the LEDs flickering by a button press with the (unseen) left index finger (25). Participants were told to ignore any tactile stimulation. The only other task requirement was to maintain central fixation throughout the experiment. 14. fMRI analysis. Data were analyzed with SPM99b (www. fil.ion.ucl.ac.uk). To account for the delay between data acquisition in the top and bottom part of the brain, acquisition timing was corrected using the top slice as reference (26), for each subject. The 400 volumes were realigned with the first as reference. To allow inter-subject analysis, images were normalized to the Montreal Neurological Institute (MNI) standard space, using the mean of the 400 functional images. All images were smoothed using an isotropic Gaussian kernel (full width at half maximum ⫽ 10 mm). Data were best fitted (leastsquares fit) at every voxel using a linear combination of the effects of interest (multiple regression). These were the timing of each of the four event types, convolved with the SPM99 standard hemodynamic response function. Each of these regressors represents the expected BOLD signal for each trial type, given the slow hemodynamic response produced by the underlying neuronal activity. Because of the many voxels tested, we used the Theory of Gaussian Fields to assign P values corrected for multiple comparisons. For the main effect of side of the visual stimulation, and presence of the tactile stimulation, correction at the cluster level was used (cluster size set by thresholding the SPM maps at P-uncorrected ⫽ 0.001). For the interaction between side and presence of the tactile stimulation, the statistical threshold was initially set at P-uncorrected ⫽ 0.05. The search volume was restricted to areas showing an effect of side of the visual stimulation, hence corrected P values were then assigned using a small volume correction (27). The search volume was confined to the cluster in the left lingual gyrus that showed a main effect of right versus left visual stimulation (447 voxels). 15. The activation clusters for the side of visual stimulation extended from the fourth occipital gyrus into the posterior lingual gyrus and posterior fusiform gyrus. Both clusters included several secondary maxima, likely to include the borders of retinotopic visual areas V2v, VP/V3v, and V4v (28). Our peripheral and low-contrast visual stimulation did not produce any robust activation in contralateral striate cortex (V1). 16. To confirm the spatial specificity of the crossmodal effect, three individuals participated in this followup experiment. The visual stimulation and task remained identical, but here any tactile stimulation was applied to the left hand near the left light. Again, the main effects for side of visual stimulation activated the contralateral lingual gyrus (right hemisphere: x, y, z ⫽ 28, –76, –10, Z score ⫽ 4.5; left hemisphere: x, y, z ⫽ –26, –72, –10, Z score ⫽ 4.4). Significant interaction between side of visual stimulation and presence of touch was now found in the right rather than left lingual gyrus (x, y, z ⫽ 26, –78, –12; Z score ⫽ 2.9; P-corrected ⫽ 0.046); again, this is contralateral to the stimulated hand. Maximal response was detected here when left visual targets were coupled with left touch. Responses to right visual stimuli in the left lingual
17. 18.
19. 20. 21. 22. 23. 24. 25.
26. 27. 28. 29. 30.
gyrus showed a nonsignificant trend for the reverse pattern, of suppression by left touch, contrasting with the significant amplification by right touch in this area for the main experiment. R. C. Coghill et al., J. Neurosci. 14, 4095 (1994). Changes in effective connectivity. To highlight areas mediating the crossmodal effects observed in the lingual gyrus, we used an effective connectivity model. Linear regression detected any voxel that changed its contribution (29) to the signal in the left lingual gyrus, depending on the trial type. This was done by fitting the full linear model at every voxel (14), but with the addition of two new regressors. One regressor was the activity at the maxima of the cluster showing an interaction between side of the visual stimulation and presence of tactile input (i.e., the cluster in the left lingual gyrus). The second regressor was created by multiplying the activity of the maxima in the left lingual gyrus with the difference of the regressors modeling the effect of spatially congruent versus incongruent bimodal conditions. The latter regressor represents the effect of interest, i.e., the interaction between activity in the left lingual gyrus and the spatial congruence of the bimodal stimulation. Significant fit for this new regressor indicates (29) a trial-specific change in the contribution of any reported area to the activity in the left lingual gyrus. We refer to this effect as a change in the “coupling” between the two areas. We ensured that this revealed only higher coupling during the bimodal spatially coherent versus spatially incoherent stimulation by specifically testing for positive regression slopes. For this analysis, the SPM threshold was set at P-uncorrected ⫽ 0.001. R. E. Passingham, in Comparative Neuropsychology, D. Milner, Ed. (Oxford Univ. Press, Oxford, 1998), pp. 271–298. M. S. Graziano and C. G. Gross, Curr. Opin. Neurobiol. 8, 195 (1998). M. Corbetta, F. M. Miezin, G. L. Shulman, S. E. Petersen, J. Neurosci. 13, 1202 (1993). S. Weintraub and M. M. Mesulam, Arch. Neurol. 44, 621 (1987). R. A. Andersen, C. Asanuma, G. Essick, R. M. Siegel, J. Comp. Neurol. 296, 65 (1990). D. J. Felleman, A. Burkhalter, D. C. Van Essen, J. Comp. Neurol. 379, 21 (1997). Although this was not designed as a psychophysical study, we analyzed reaction times (RT ) for completeness. The tactile events speeded up visual RTs, especially for visual targets on the same side as the stimulated hand. In the absence of right touch, left lights were responded to faster than right lights due to their compatibility with the left button press (interparticipant means of median RTs were 365 ms and 374 ms, respectively; P ⫽ 0.04). When right touch was added, this difference disappeared (means of 338 ms and 340 ms, n.s.) because adding touch produced the greatest benefit for the closest light stimulus, as observed in other psychophysical studies (4, 8). R. N. A. Henson, C. Buechel, O. Josephs, K. Friston, NeuroImage 9, 125 (1999). K. J. Worsley et al., Hum. Brain Mapp. 4, 58 (1996). E. A. DeYoe et al., Proc. Nat. Acad. Sci. U.S.A. 93, 2382 (1996). K. J. Friston et al., NeuroImage 6, 218 (1997). The Functional Imaging Laboratory and C.D.F. were supported by the Wellcome Trust. E.M. and J.D. were supported by a Programme Grant from the Medical Research Council (UK). E.M. was also supported by a Research Training Grant from The Swiss National Research Foundation and a personal grant from the Janggen-Poehn-Stiftung (Switzerland). 17 March 2000; accepted 15 June 2000
18 AUGUST 2000 VOL 289 SCIENCE www.sciencemag.org