WIT Transactions on Information and Communication Technologies, Vol 42, © 2009 WIT Press ... The common image is processed by means of intelligent vision.
Data Mining X
123
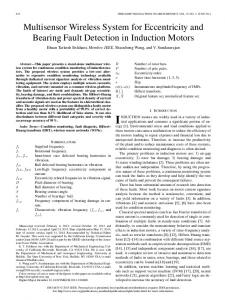
Module multisensor system for strategic objects protection M. Życzkowski, M. Szustakowski, M. Kastek, W. Ciurapiński & T. Sosnowski Institute of Optoelectronics, Military University of Technology, Warsaw, Poland
Abstract Recent terrorist attacks and possibilities of such actions in future have forced the development of security systems for critical infrastructures that embrace sensors technologies and technical organization of systems. Also views and methods of protection organisation have changed considering the growing possibilities and facilities of terrorist groups. The used till now perimeter protection of stationary objects, based on construction of a ring with two-zone fencing, visual cameras with illumination are efficiently displaced by the systems of the multisensory technology that consists of: visible technology – day/night cameras registering optical contrast of a scene, thermal technology – cheap bolometric cameras recording thermal contrast of a scene and active ground radars – microwave and millimetre wavelengths that record and detect reflected radiation. Efficient range of detection, recognition and identification of persons and vehicles depends on the field of view of a scene and types of the used devices. There is also a variety of applications and control of cameras set for a target detected by radar. This paper presents a structure of critical infrastructure protection that bases on a module multisensor security system and its elements. Keywords: perimeter security system, thermal camera, radar.
1
Introduction
One of the common targets of terrorist attacks is a critical infrastructure – airports, harbors, nuclear power plants, pipelines, encampments and other extensive sensitive sites. Countermeasure for terrorist and criminal threats is a physical protection system, which integrates people, procedures and equipment. WIT Transactions on Information and Communication Technologies, Vol 42, © 2009 WIT Press www.witpress.com, ISSN 1743-3517 (on-line) doi:10.2495/DATA090131
124 Data Mining X Physical protection of typical infrastructure should focus on the following systems: (i) perimeter and peripheral (open area outside) and (ii) ground control (inside the protected area). Each of the above mentioned systems has its own tasks that can be determined by possible threats and established security organization. In accordance with the requirements, appropriate technologies that fulfill criterion of reliable detection of intruders and danger materials should be chosen [1, 2]. In order to obtain high intruder detection probability for perimeter and open area security systems two sensor’s technologies should be used. Efficiency of human operation in the system can be increased by means of automation detection of video surveillance. Visualization of an observed scene and video tracking of an intruder are crucial for people in charge in reaction forces. So, the newest security solutions apply as a rule integrated systems that ensure cooperation between access control, perimeter systems and video surveillance (visible and thermal cameras). Digitization of analog signals from video systems and development of computer vision methods cause that the video devices besides observation of the scene can also automatically detect an intruder (or a vehicle), track it and identify. But applied video cameras, even in a day/night version, cannot properly recognize the observed scene especially in poor lighting conditions and in case of rain, snow or fog. Thermal cameras can enhance efficiency of observation by detection of a thermal contrast of the scene. Unfortunately, these systems suffer also from rain and fog, what can reduce the thermal contrast and attenuate infrared radiation. Next step in perimeter and open area protection was to introduce ground radar operating in microwave region of the spectrum. This solution is less susceptible to atmospheric disturbances and improves detection probability and security of the protected area. Signals from the radar are usually marked as a point or group of points on a screen. So, there is a need for cooperation of the above mentioned technologies (cameras and radars) in order to ensure detection, tracking, identification and classification of the intruder. As a result, an image and data fusion technology was developed to merge date from various sensors into one common scene and data to avoid separate analysis of data. The common image is processed by means of intelligent vision surveillance (IVS) to automatically detect and identify the threats. Borders of critical infrastructure objects are determined by a fence that in fact limits the localization of perimeter sensors. It is seen from the above description that physical protection of perimeter and open areas includes not only linear sensors installed along the fence but also wave technologies both passive (visible and thermal) and active (radars) with sectoral detections and visualization. Integrated security technology is needed to combine perimeter and radar detection with intelligent video surveillance, and security analytics to help responders act faster during emergencies and potentially preempt attacks. Modern security infrastructure protection system that applies radar and digital video surveillance, is integrated by means of the open Internet Protocol (IP) Network that would be familiar to any IT professional network. WIT Transactions on Information and Communication Technologies, Vol 42, © 2009 WIT Press www.witpress.com, ISSN 1743-3517 (on-line)
Data Mining X
125
In our paper we present an assumed model of perimeter and open area security system that bases on the multisensory system. Chapter 2 focused on an assumed model of the perimeter security system. Chapter 3 described a proposed multilayered perimeter surveillance intelligent system. In chapter 4 we analyzed parameters of the system and shown integration aspects of radar-camera surveillance systems.
2
Model of perimeter and open area security system
The proposed model consists of two overlapping technologies for intruder detection – active or passive fence (e.g. fiber optic and radar sensor) (i), two coupled technologies for visualization and identification – visible and thermal cameras with IVS (ii) and command & control system that sends the alarm images to the response forces (iii). Multisensor that combines three technologies (visible, thermal and radar) is constructed on one platform which after detection can tract and automatically indicate an alarm image for the operator. The automatic tracking of the event displayed on a screen enables the operator to make the decision and a picture is simultaneously sent to the response forces. This support is important for the forces and also for the commander of the operation. SYSTEM INTEGRATOR
PERIMAETER MONITORING CENTER
ACTIVE FENCE
ACCESS CONTROL
CCTV CAMERAS
RADAR
Command & Control
IR CAMERAS
Ethernet 1GB
Switch
VEHICLE PATROL
DETECTION TRACKING VISUALISATION
RADAR
Sector communication box
FENCE LINE Sensors
Figure 1:
Access Control Gate
~ 3km
Typical model of the perimeter security system.
WIT Transactions on Information and Communication Technologies, Vol 42, © 2009 WIT Press www.witpress.com, ISSN 1743-3517 (on-line)
126 Data Mining X This kind of perimeter and open area security system as well as countermeasure organization is very demanding from a technological point of view. The whole protected area should be geographically orientated. All perimeter sensors, radars and cameras should be plotted on a map. A mobile patrol should be equipped with Global Positioning System (GPS) correlated with the map. The considered infrastructure is extensive with perimeter length of about 10– 20 km (e.g. airport), that is often divided into zones which are under surveillance by multisensor system units. This situation requires a network for communication – both wire and wireless. Radars coupled with visible and thermal cameras make it possible to detect and track the event. In order to improve the operator’s work the additional technologies can be applied: data and image fusion (fusion of data from cameras and sensors) and intelligence video surveillance (IVS). It is seen that operation of the physical protection in this case depends strongly on optoelectronic and radar equipment as well as network technology.
3 Scheme of multisensory system construction Presented in Figure 2 the multisensor system consists of: - detection mount - automatic intelligent surveillance - command & control DETECTOR MOUNT
RADAR
VIS
IR
INTRUDER DETECTION INTELLIGENT SIGNAL PROCESSOR
IMAGE FUSION IMAGE/RADAR DATA FUSION
COMMAND & CONTROL
Figure 2:
RADAR DATA
CAMERA IMAGE
Scheme of multisensory system construction.
Detection mount The detection mount integrates two cameras VIS and IR (FLIR PTZ 50MS) and radar (ICX STS-1400) on one platform. The detection range of the radar is two WIT Transactions on Information and Communication Technologies, Vol 42, © 2009 WIT Press www.witpress.com, ISSN 1743-3517 (on-line)
Data Mining X
127
times longer than cameras for humans and vehicles. The platform is also equipped with GPS and gyrocompass for system localization in the field. The sensors feed a digital map which is displayed on the system monitor. Intelligent signal processor The software instrumentation of the system bases on Nexus system, which has software interface between FLIR cameras and ICX radars. However, the Nexus system does not fulfill all assumed functions. Completed they stayed in own software. The system meets in the regime of the automatic signal processing all things considered: - automatic detection of the intruder, alarming the operator and automatic tracking with giving coordinates and the speed of the target movement; - automatic point out of unit of both cameras the label PTZ setup in accordance with the distance; - cameras automatically analyze images and independently detect intruders, results are displayed with confirmation of the alarm; - the data fusion system performs synthesis of numerical data from detection mount and displays information on the numerical map on the operator’s interface; - system automatically sends the image to the security patrol; - automatic testing and signalization of possible mechanical, software, communication or power supply failure. Command & Control The operator interface is located on the system monitor divided into three parts, like in the figure 2. In the right top corner the operator can see the signal from the radar. Lower, the fusion image from VIS and IR cameras is displayed. The operator's desktop occupy the left part of the screen where synthetic information is displayed on the basis of the digital map in the event of detecting of the intruder. On the background of the image appears data regarding characteristics of the target (speed, location and trend)
4
Multisensor system performance parameters
The security systems are designed to fulfill three basic functions: - detection - discrimination of possible objects from their surroundings; - identification - determination of the threats; - classification - determination of the threats characteristic. The radar realizes the function of detection in the multisensory system, while identification is performed by the VIS/IR cameras unit. In the end, classification (the character of the threat) is determined by the system operator. So, the selection of every element of the system is very important. The performance of the sensors is characterized by four key parameters: sensitivity, probability of correct detection, false detection (alarm) rate, and response time. Probability of
WIT Transactions on Information and Communication Technologies, Vol 42, © 2009 WIT Press www.witpress.com, ISSN 1743-3517 (on-line)
128 Data Mining X correct detection is connected with technical parameters of sensors which are sensitive to: - thermal noise which determines the threshold of detection; - noise reflected from the environment, clutter-background noise - signal reflected from the target; Probability of correct detection involves the chance to distinguish the signal on the background of thermal noises and clutter. The nature of the statistics of the noise, clutter and targets are all different but they can be described mathematically by complex equations which predict detection range for various false alarm condition [6]. Sensors Receive Operating Characteristic (ROC) explicitly captures the performance true – off between sensitivity, probability of correct detection, false alarm rate and time response. These main four sensor parameters are all related and all depend on the sensors operating environment. SENSITIVITY
1 RESPONSE TIME TRESHOLD
10
100
1
10
100
FALSE ALARM RATE
Figure 3:
The key sensor metric and their relation to ROC curve.
The analysis presenting the ROC curve in Figure 3 reveals the fact that there is no ideal responsiveness of the sensing device. Accepting determined responsiveness of the sensing device we have to approve the determined level of false alarms and other attributes of the sensing device. 4.1 Radar performance parameter Maximum detection range The maximum detection range of radar is the longest distance at which the radar can reliability declares that the reference signal from the target has exceeded a set threshold. The return signal is usually very low and must be detected above the thermal noise level in the radar electronics. Many factors influence the ability of radar to detect a target. It is the radar design itself, the type of target (person, vehicle) what characteristic of the target determined its measurability (size, speed) the distance from the radar to the target, the size of the target (radar cross section) the environment between radar and target (rain, snow, fog) and the environment in the vicinity of the target could clutter like trees, grass or building. In spite of many restrictions, range of radar detection is determined mainly by the size of target – see Table 1. WIT Transactions on Information and Communication Technologies, Vol 42, © 2009 WIT Press www.witpress.com, ISSN 1743-3517 (on-line)
Data Mining X
129
All the above factors affect the maximum detection range of the radar for a particular target, and any testing for determining rang detection must be for the statistical nature of the process by doing many trials to establish this parameter. False alarm rate Foregoing description the detection range could be increasing by lowering detection threshold to see lower signal level. But it is clear that increase in the probability of detection is offset by the resulting increase in the probability of false alarm. Thus all radar specification contain a FAR requirement, say 2 or 3 per day, so that a radar operator is not usually districted attending to an alarm that doesn’t really exist. Table 1: Targets Crawler Pedestrian Light ground vehicle Kayak Small boat
Radar cross section (RCS) for different targets. RCS[m2] 0,03-0,1 0,3-1,5 5-50 1-5 5-100
Targets Heavy ground vehicle Ship Small airplane Helicopter
RCS[m2] 20-1000 50-10000 5-20 10-500
Revisit time Radar revisit time is the time it takes for the radar to complete its search for targets and return to begin another search interval. Since the target detection process is statistical it follows that the more time the radar looks at an area where there in target is. Of course, the longer the detection range, the longer period of time can be a located to the detection process. Also the slower target speeds can be allocated more detection time. A short revisit time improves the detection process and also improves target tracing after detection. Radar resolution Radar space is defined in four dimensions: range, speed, azimuth angle and elevation angle. Resolution in range is important to accurately the range to a target and to eliminate clutter behind and in front of the target. The speed resolution feature is useful to discriminate moving vs. stationary target. Almost all radars limit the area they look at an angle. This angle is two dimensional horizontal and vertical. A ”pencil” beam is symmetrical in both plane, but many ground surveillance radars have very narrow azimuth beam width. Radar which has small resolution cells is called high resolution. High resolution radars provide more clutter background rejection which radars discriminate better against competing returns from the ground, grass, tress and rainfalls. Search volume Typically, the more “space” a radar search for targets, the more utility the radar provide to a surveillance system. A 360 degree radar may be more useful than one that scans a sector. However, there is a trade-off between available search volume and resolution. It takes long to search a given volume with high WIT Transactions on Information and Communication Technologies, Vol 42, © 2009 WIT Press www.witpress.com, ISSN 1743-3517 (on-line)
130 Data Mining X resolution radar than a radar with less resolution. Therefore, there is a constant battle between revisit time, resolution and search volume. 4.2 Vision and thermovision camera performance parameters Quality of images is the most important feature of every camera in security surveillance and remote monitoring applications. Image quality depends on many technical factors like: optics (objectives), sensors (matrices), signal processing and transmission. To obtain good image one should also remember about an illumination level and an area of observation. The camera consists of a CCD matrix, which is coupled with the objective and an electronic processing unit to produce video image. The obtained images can be analyzed by the operator or fed into signal processing for automatic target detection recognition, identification and tracking. Field of view of the camera depends on the objective type. The CCD matrix is built of a specific number of pixels which are superimposed on the whole field of view. Thus, if the field of view increases, the number of pixels per square meter decreases and resolution decreases in reverse proportion to the field of view. Simultaneously, contrast of the object in the field of view lenses. As a result, cameras are not suitable for wide field of view observation but find application in detection of the scene with the objective chosen properly for the distance and filed of view. Installation of the cameras on high poles with long focal length decreases the field of view and improves resolution. In this case, the camera should be adjusted by other sensors on a specific point (area) in order to identify intrusion. Usefulness of the visible cameras for detection is small in comparison with the thermal cameras which detect thermal contrast between the object and the scene. However, all above considerations about pixels and resolution are still valid. The visible cameras detect radiation reflected from the objects, so there is a need for illumination of the scene. At night, the illumination level is insufficient and normal cameras are useless for long distance observation. Some solutions of this problem have been found but only for short distances: amplification of an image, matrixes with sensitivity shifted to infrared region and monochromatic filters for color cameras. A disadvantage of the thermal cameras in comparison to the visible cameras is their low resolution and poor contrast especially for small temperature difference between the object and the scene. So, taking into account advantages of both technologies, a multisensor head is often applied for security surveillance and remote monitoring in perimeter protection Both visible and thermal cameras are susceptible to atmospheric conditions. Rain, snow, fog can reduce the observation distance and image quality. For example, radiation in the 3–5 µm range is strongly attenuated when water drops have diameter equals to the radiation wavelength. Image analysis, both from visible and thermal cameras, by the operator is difficult and ineffective especially for small scene contrast and a big system with a lot of cameras installed. In order to help the operator, the intelligent vision surveillance systems for automatic detection have been developed and put into market. WIT Transactions on Information and Communication Technologies, Vol 42, © 2009 WIT Press www.witpress.com, ISSN 1743-3517 (on-line)
Data Mining X
131
Intelligence Video Surveillance (IVS) is a computer software that watches and analyses video streams to determine activities, events and behaviors that might be considered suspicious and provide an appropriate response when such action occurs. The key technology is called computer vision. This is a somewhat obscure branch of mainstream artificial intelligence research involving teaching machines to understand what they see through the camera [4, 5]. Application of IVS technology change the camera into a sensor which employs sophisticated algorithms for detection and tracking of all relevant objects in the camera‘s view. It also contains algorithms for classification of object into specific types and can distinguish human from animals, or track from aircraft. Depending on application, IVS can be equipped with algorithm of remote identification of persons by means of their behavior.
5
Integrated metrics of multisensor
The design of the multisensory system (radar-cameras) requires the specification of the screenplay. System is intended for perimeter protection, the critical infrastructure protection or as the universal system for example to airport surface protection. Compatibility of parameters of the radar and cameras is a basic element of the design of the system with regard to range of detection and the intruder's identification, observation angle and speed of circulation. 80 [V] Input Power
60
[W] Power Consumption 40
80
60
km 2 ,5 [km] Detection Range 2m -Personel
2km
20 40
km 1,4 km m 1 0,8
20
[km] Detection Range 2m -Vehicles
[ o] Resolution 1
0,75
0,5
0,25
0,8m 1km
1,4km
2km
-30 -20
20
- 10
0
40
[o] Temperature
PTZ -50 MS
60
ICX STS1400
80
Figure 4:
[ o] Temperature
The spider chart for the multisensory system.
WIT Transactions on Information and Communication Technologies, Vol 42, © 2009 WIT Press www.witpress.com, ISSN 1743-3517 (on-line)
2,5km
132 Data Mining X To set and take some more parameters of the multisensory system it is possible to adopt the concept included in [6]. To capture the overall performance of a multisensory we use a graphical technique called “the spider chart.” The spider chart picture integrates all of the sensor metrics into one visual chart, which can be utilized to evaluate the overall requirements and performance of a sensor. Each of the previously defined sensor metrics and attributes are assigned to a leg of the spider chart. The tick marks on each leg represent measured or predicted values that are associated with the respective metric and improve in value as they radiate out from the center of the chart. The values depicted on the chart for each metric and attribute are designed to reflect the requirements of the stated mission. On any given leg of the spider chart, we find plotted three values. The center value represents an average acceptable value for that particular metric. The inner and outer values can be thought of as the “error bar” associated with that metric. The innermost value may be considered the minimally acceptable performance, and the outermost value the point at which one reaches diminishing returns. As shown in Figure 4, connecting the metric values provides a “footprint” of the sensor performance with regard to mission requirements. The larger the area encompassed, the better the sensor for the designated mission. This footprint is a valuable tool for comparison of multiple sensors with common mission requirements, as well as comparison of sensors to a well-defined set of metrics for a concept of operations. The spider chart in Figure 4 represents the set of parameters of the system presented in Figure 2. Protection of the small airport was a task of the system from the assumption the width of the area was removing to 1.2 km along the runway.
References [1] GAO –04-728 Aviation Security, “Further Steps Needed to Strengthen the Security of Commercial Airport Perimeter and Access Control”, www.gao.gov./new.items/do4728.pdf [2] Airport Security Transportation, THALES. [3] 35th Annual 2001 ICC on Security Technology, London. [4] T. Riley and Moira Smith, “Image Fusion Technology for Security and Surveillance Application”, Proc. SPIE 6402 (2006). [5] M. Smith. J.P. Heather, “Review of Image Fusion Technology in 2005”, Proc. SPIE 5782 (2005). [6] J. Carrano “Chemical and biological sensor standards study” Defence Advanced Research Projects Agency
WIT Transactions on Information and Communication Technologies, Vol 42, © 2009 WIT Press www.witpress.com, ISSN 1743-3517 (on-line)