terest rates, a bank lending channel allows for small and large firms. ... that operates through the usual interest rate short-term nonbank debt, not merely commer ...
Monetary Policy and Credit Conditions: Evidence from the
Composition of External Finance: Comment
In recent years, considerable research has explored the role played by bank lending in the transmission of monetary shocks. In contrast to the traditional Keynesian transmission mechanism that operates strictly through interest rates, a bank lending channel allows central bank actions to affect the supply of loans from depository institutions ("banks") and, in turn, the real spending of bank borrowers. Empirical work on the existence of a bank lending channel (for example, Stephen King, 1986) generally has focused on the correlations among aggregate output, bank debt, and indicators of monetary policy. This work, however, is plagued by the problem of identifying shifts in loan demand from shifts in loan supply. Evidence that both output and bank loans fall after a monetary tightening does not identify whether the decline in loan volume reflects a constriction of loan supply or a dampening of loan demand through the traditional interest rate mechanism. Anil K. Kashyap, Jeremy C. Stein, and David W. Wilcox (1993), henceforth KSW, cut through this identification problem by examining relative movements in bank loans and commercial paper after monetary shocks. Their intuition is straightforward: a monetary shock that operates through the usual interest rate channel lowers the demand for all types of finance, while a monetary shock that operates through a bank lending channel affects the supply of only bank debt. KSW find that bank loans outstanding decline relative to commercia1 paper after a monetary contraction, which
they take as evidence for a bank lending channel. We reexamine KSW's analysis. In contrast to KSW's use of aggregate data, we analyze the mix of bank and nonbank debt separately for small and large firms. As is well known, financing patterns differ sharply across these two groups. Only the very largest corporations issue significant amounts of commercial paper; conversely, small firms issue essentially no commercial paper, depending instead on banks as their primary source of finance. With heterogeneous firms, a given movement in the aggregate debt mix can reflect any number of developments at the firm level. Moving to disaggregated data forces us to modify KSW's measure of the debt mix. Because small firms issue so little commercial paper, KSW's measure-the ratio of bank debt to the sum of bank debt and commercial paper-is essentially pegged at unity for these firms. Thus, KSW's mix variable cannot possibly capture shifts in the relative importance of bank and nonbank finance for small firms. This is a serious shortcoming because small firms are often presumed to bear the brunt of a bank lending channel. Therefore, the mix variable in this comment includes all forms of short-term nonbank debt, not merely commercial paper. This allows for meaningful substitution between bank and nonbank debt for small firms yet remains consistent with the spirit of KSW. The range of potential substitutes for bank debt is a crucial issue for KSW's analysis and for our own. In Oliner and Rudebusch ( 1995), we show that the results presented here remain valid when we broaden the mix variable even further by including trade credit and long-term debt. Our results cast serious doubt on KSW's story about the transmission of monetary policy. Using data for the U.S. manufacturing sector, we find little evidence that a monetary shock changes the mix of bank and nonbank
* Oliner: Board of Governors of the Federal Reserve System, Washington, DC 20551; Rudebusch: Economic Research Department, Federal Reserve Bank of San Francisco, San Francisco, CA 94105. We thank Tom Brennan for excellent research assistance. The views expressed here are ours alone and do not necessarily represent those of the institutions with which we are affiliated. 300
VOL. 86 NO. I
OLINER AND RUDEBUSCH: MONETARY POLICY, COMMENT
debt for either small firms or large firms. Rather, the main effect of a monetary contraction is to shift financing of all types from small firms to large firms. This shift produces a decline in the aggregate bank-loan share because large firms rely less heavily on bank debt than do small firms. Given the lack of substitution away from bank debt at the disaggregated level, movements in the aggregate debt mix do not signal the existence of a bank lending channel. However, our results do not rule out other forms of the credit channel. In particular, much recent work has posited a propagation mechanism for monetary policy that operates through total credit, with no special role for loans from depository institutions. This broad credit channel emphasizes that information asymmetries between borrowers and lenders may increase the cost of all forms of debt after a monetary shock.' Given the relative severity of information problems for small firms, the increase in the cost of external finance for these firms likely will be particularly sharp. Our main finding-that monetary contractions induce a widespread shift in total lending away from small firms-appears consistent with the operation of a broad credit channel. I. The Mix of Short-Term Debt
We assembled our data set, which spans the period 1973:Q4 to 1991:Q2, from various issues of the Quarterly Financial Report for Manufacturing, Mining, and Trade Corporations ( Q F R ) . The QFR has been published since 1982 by the Census Bureau and previously was published by the Federal Trade Commission and the Securities and Exchange Commission. Based on a sample of more than 7000 U.S. manufacturing companies, the QFR provides a quarterly balance sheet and income statement for the manufacturing sector as a whole and for eight size classes defined by the value of firm assets. We condensed the eight asset size classes into one aggregate of "small7' firms and another of "large" firms
'See Mark Gertler and Simon Gilchrist (1993) and Oliner and Rudebusch (1995, 1996) for comparisons of the bank lending channel and the broad credit channel.
Billions of 1987 dollars: Total short-term debt (D) Bank loans (B) Commercial paper (CP) Other debt ( 0 ) Ratio: Debt mix (MIX = BID)
301
Small firms
Large firms
23.4 19.5 0.1 3.8
57.2 24.7 19.6 12.9
0.83
0.43
Source: Authors' calculations using data from the Quarterly Financial Report for Manufacturing, Mining, and Trade Corporations.
using much the same methods as Gertler and Gilchrist (1994). The small-firm group accounts for about 15 percent of the total stock of fixed capital in manufacturing.' A full description of the underlying QFR data and our procedures for aggregating the size classes can be found in Oliner and Rudebusch ( 1995 ) . Table 1 summarizes the composition of short-tenn debt for our two groups of firms in 1980, a representative year from our sample. We focus on short-tenn debt-that is, debt with an original maturity of one year or lessto be consistent with the scope of KSW's analysis. The top part of the table shows the amount outstanding in billions of 1987 dollars for the three components of short-tenn debt identified in the QFR. As can be seen, the short-term financing patterns of the two groups of firms differ substantially. In particular, small firms depend on bank loans (B ) for a much larger fraction of their total short-tenn credit than do large firms. Furthermore, small firms issue essentially no commercial paper (CP), while large firms have almost as much commercial paper outstanding as they have short-term bank loans. Finally, both types of firms rely on other sources of short-tenn non-
Our small-firm group accounts for relatively little of the manufacturing capital stock because that sector is highly concentrated, with a few hundred large companies holding most of the sector's assets. Indeed, if we boosted the small-firm share of the capital stock from 15 percent to 20 percent, companies with assets as high as $1 billion (in 1990) would be reallocated to that group.
MARCH I996
THE AMERICAN EC :ONOMIC REVIEW
302
bank debt ( 0 ) , such as loans from finance and insurance companies. Using these short-term instruments, we construct a measure of the mix of bank and nonbank debt that is somewhat broader than the one used by KSW. Our measure is the ratio of short-term bank debt to total short-term debt (D = B + CP 0), which we denote by MIX = BID; the final row of Table 1 shows the value of MIX for both large and small firms in 1980. In contrast to MIX, KSW's mix variable used commercial paper as the only form of nonbank debt. KSW (p. 88) recognized that such a narrow measure could potentially distort their analysis. If, for example, firms substitute between commercial paper and another source of nonbank finance, KSW's measure of the debt mix will change even though the actual mix of bank and nonbank debt has not been altered. In addition, as noted above, KSW's mix variable is ill-suited for our analysis because it omits virtually all nonbank debt for small firms. In Oliner and Rudebusch (l995), we considered several additional measures of the financing mix in order to assess the robustness of our results. We obtained similar results to those reported below when the mix variable was broadened in two ways: first, by including trade payables as a form of nonbank debt, and second, by including bank and nonbank debt with an original maturity longer than one year. Importantly, we found no evidence that small firms increase their use of trade credit during periods of tight money, consistent with results in Gertler and Gilchrist ( 1993). Thus, there appears to be no support for the often-made assertion that small firms might use trade credit as a substitute for bank loans after a monetary contraction. For completeness, we also used KSW's very narrow definition of the mix; this measure provided some evidence as well against the bank lending channel.
+
11. Monetary Policy and Mix: A KSW-Style Analysis
In order for the bank lending channel to operate, the supply of bank loans must decline, relative to the supply of other debt, after a monetary contraction. To investigate this proposition, we first analyze the effect of monetary
policy on the debt mix using the same methodology as in KSW. However, their methodology is open to criticism, and the next section reexamines the results using a more conventional VAR analysis. Following KSW, we regressed the change in the debt mix on eight (quarterly) lags of itself, the growth of real GDP, and a monetary policy indicator (denoted MP). We did this first using the debt mix for aggregate manufacturing, MIXA,in order to mimic the aggregate results in KSW, and then for the debt mix of large firms (MIXL) and that of small firms (MIXS). Specifically, we ran the regression
X
+C
yiA(ln GDP),_, + u,,
i= l
for j = A, L, or S.' Following KSW, we employ two indicators of the stance of monetary policy: changes in the federal funds rate and a dummy variable that equals one on the dates of monetary contraction selected by Christina D. Romer and David H. Romer (1989,1994). Our sample period contains four such Romer dates: April 1974, August 1978, October 1979, and December 1988. The first column of Table 2 reports the sum of the p, coefficients from ( 1 ), as well as the t statistic for the test of the significance of this sum.4 Under a bank lending channel, we would expect the various mix variables to decline in response to a monetary contraction. As shown in the upper left corner of the table,
' Equation (1) is exactly KSW's "multivariate" specification. Our results are not materially different when we omit the lags of GDP growth, as in KSW's "bivariate" specification. The results also are robust to changes in the length of the lag distributions. We also tested the joint significance of the P, coefficients. The results of these exclusion tests were similar to the results we report for the sum of the P,'s.
VOL. 86 NO. I
OLINER AND RUDEBUSCH: MONETARY POLICY, COMMENT
303
TABLE2-THE RESPONSE OF THE COMPOSITION OF DEBTTO MONETARY POLICY Bank debt (B)
MIX (BID)
Total debt (D)
FIXED
SHIFT
Aggregate manufacturing: Romer dates
Federal funds rate Large $firms: Romer dates
Federal funds rate Small $firms: Romer dates
Federal funds rate Notes: Results are from ordinary least squares regressions, estimated over 1976:Ql to 1991:Q2, of the following form:
+ x a,Z';-,+ 8
Z'; = c
i= l
8
8
P,MP,-, i= l
+ x y,A(lnGDP),-, + u,, ,=I
where Z equals either AMM, A(ln Bank debt), A(ln Total debt), FIXED, or SHIFT, and j indexes the sample (aggregate manufacturing, large firms, or small firms). The monetary policy indicator, MP, equals either a dummy variable for Romer dates or the change in the federal funds rate. The table reports the sum of the P, coefficients in each regression, with the associated t statistic (in absolute value) in parentheses. * Significantly different from zero at the 5-percent level. Significantly different from zero at the 10-percent level.
MIXAdeclines after a Romer date or a positive innovation in the federal funds rate. These declines in the aggregate debt mix have marginal significance levels ranging from about 0.06 to 0.17 in a two-sided t test. These results are largely consistent with those obtained by KSW, who found-based on data for the nonfinancial business sector-that bank debt as a share of such debt plus commercial paper declined significantly after a tightening of monetary policy.' Yet, when we apply this analysis to small and large firms, the results are far less supportive of a bank lending channel. As shown in the lower part of Table 2, neither MIXL 'Using QFR data, we also constmcted KSW's mix variable (B/(B + CP)) for aggregate manufacturing. With this mix variable in equation (I), the decline in mix after a monetary contraction is significant at the 1-percent level after a Romer date and at the 10-percent level after a rise in the funds rate.
nor MIXS moves significantly after a Romer date or after a change in the federal funds rate. To push the analysis one step further, the next two columns examine the movement in the numerator and denominator of each mix variable. These results are derived by estimating equation (1) with the log difference of bank debt (B j ) or total short-term debt (Dl) replacing the change in the debt mix (for j = A, L, and S ) . As Table 2 shows, movements in these components of mix are generally insignificant. However, important differences can be seen in the behavior of small and large firms. For large manufacturers, total shortterm debt expands after a monetary contraction, while these debt stocks decline for small manufacturers. The difference in total debt growth between the two groups is significant. Thus, we observe a reallocation of shortterm credit from small firms to large firms in response to a tightening of monetary policy,
THE AMERICAN ECONOMIC REVIEW
304
a pattern also highlighted by Gertler and Gilchrist ( 1993, 1994). This difference raises the possibility that the changes in aggregate mix are driven simply by compositional shifts. To determine whether this is the case, we decompose the change in the debt mix for aggregate manufacturing. MIX A can be written as d 'MIXS + OLMIXL, where 0' ( = D S / D A )and d L ( = D L / D A )are the shares of total short-term debt held by large firms and small firms, respectively. Hence,
Now, define the movement in a mix variable with fixed debt shares as (3)
+
FIXED = dSAMIXS 0 LAMIXL,
and define the shift in the debt shares of large and small firms as (4)
SHIFT = AdSMIXS+ AdLMIXL = A0 (MIX" - MIXL).
The second equality in equation (4) results because AdL = -AOS by definition. As can be seen from equations (2) - (4), AMIXA = FIXED SHIFT. FIXED captures movements in MIXA that would result if the distribution of manufacturing sector debt between small and large firms were fixed in the face of monetary shocks. SHIFT captures the pure effect of shifts in the proportion of total debt held by small and large firms, holding constant the mix of debt for both groups. After a monetary contraction, we expect SHIFT to be n e g a t i ~ eTherefore, .~ MIXA can fall significantly even when MIXS and MIXL do not. In this case, the aggregate debt mix declines because a monetary contraction induces a shift of total short-term debt
+
MARCH 1996
toward large firms, which rely much less on bank loans than do small firms. Once we control for the shift in debt shares, does there remain any significant effect of monetary policy on MIX for aggregate manufacturing? To answer this question, we estimate equation ( 1 ) with FIXED and then SHIFT replacing AMIXA. As shown in the last two columns of Table 2, FIXED never declines significantly after a tightening of monetary policy. In contrast, SHIFT does move down significantly. These results are quite damaging to the case for a bank lending channel. Because FIXED does not drop significantly, our earlier results for MIXAcannot be viewed as evidence of a substitution away from bank loans toward nonbank debt. Rather, the decline in MIXAreflects a general redirection of short-term credit toward large firms in which bank loans have no special role. The empirical test above focuses on only one of the two necessary conditions for the bank lending channel to operate. The other condition is that bank loans and other sources of finance cannot be perfect substitutes for all borrowers. This allows a cutback in the supply of bank loans to affect the real spending of borrowers. As evidence for this second condition, KSW showed that the aggregate debt mix helps predict real activity. Because we find that the decline in the aggregate debt mix does not arise from a tightening of bank loan supply, the predictive power of the debt mix cannot reflect the existence of a bank lending channel. However, the reallocation of credit from small to large firms that drives the aggregate mix variable may signal a broad credit channel that has real effects (as Gertler and Gilchrist [I9941 argue). To investigate this possibility, the next section explores the effect on investment spending of movements in the fixed-share mix (FIXED) and the composition of debt (SHIFT). We conduct this investigation with a VAR, rather than with KSW's "structural" investment models, for reasons discussed below. 111. Monetary Policy and Mix: A VAR Analysis
The results in Table 2 for total debt suggest that monetary contractions cause a reallocation of manufacturingsector debt away from small finns (ABS < 0).Given that MZX" > MIXL(Table I), equation (4) implies that SHIFT will be negative after a monetary contraction.
KSW's methodology, which we used in the previous section, can be criticized for failing to distinguish between endogenous and exog-
VOL. 86 NO. I
OLINER AND RUDEBUSCH: MONETARY POLICY, COMMENT
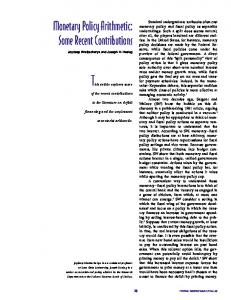
enous monetary policy actions. Endogenous policy actions are those that respond systematically to developments in the economy; exogenous policy consists of all other actions. To discern any independent effect of monetary policy, we must focus on exogenous policy actions. Otherwise, we cannot know whether the movement in (say) the debt mix after a monetary policy action is due to the policy action itself or to the movement in a variable that spurred the policy a ~ t i o n . ~ The conventional solution to this problem is to identify exogenous policy actions as the innovations in a VAR (e.g., Ben S. Bernanke and Alan S. Blinder, 1992; Gertler and Gilchrist, 1993, 1994; and Lawrence J. Christian0 et al., 1994). Thus, to examine the robustness of the results given above, we estimate VARs that include (in this order) the growth rate of both real GDP and the GDP deflator, the change in the funds rate, and the level of a debt mix variable.' We consider six different mix variables. The first is KSW's mix variable (denoted MIXKSW), which is constructed from data for the nonfinancial business sector from the Federal Reserve's Flow of Funds accounts. The set of mix variables also includes MIXA, MIXL, MIXS, FIXED, and SHIFT. The latter twa variables, defined in equations (3) and (4) as first differences, are cumulated to be in levels for comparability with the other mix variables. Figure 1 displays the impulse response of each mix variable to a positive innovation in the funds rate, along with a 95 percent confidence interval for each response (calculated via standard Monte Carlo procedures). As shown in the upper panel, the aggregate mix variables, MIXKSW and MIXA, decline sig-
' KSW allude to this issue in their footnote 16, but they limit their discussion to a bivariate system that includes only the debt mix and an indicator of monetary policy. This is incomplete because even if monetary policy does not respond endogenously to the mix, both policy and the mix may respond to output. Ignoring this type of endogeny could be misleading. Each VAR includes four lags of the variables. Broadly similar results were obtained from VARs that included changes rather than levels of the mix variables and from VARs that included detrended output and detrended mix variables.
305
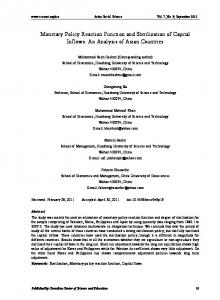
nificantly (at the 5-percent level) after a positive shock to the funds rate. These results are in line with the aggregate evidence of KSW.9 However, the middle panel confirms that the large-firm and small-firm mix variables are little changed after a monetary shock, reinforcing the evidence presented in the first column of Table 2. Not surprisingly then, as shown in the bottom panel of Figure 1, the fixed-share mix (FIXED) shows no significant movement after the shock to the funds rate, while SHIFT reveals a significant reallocation of debt toward large firms. As noted above, KSW also examine the effect of movements in mix on real investment spending. Of the four types of investment studied by KSW-producers' durable equipment (PDE) , nonresidential structures, durable inventories, and nondurable inventoriesMIXKSW had the most predictive power for PDE. Hence, for brevity, we focus on equipment spending. We estimate VARs that include (in this order) the change in the cost of capital for PDE, the growth rates of real GDP and real PDE, and one of the six debt-mix variables. The VARs include four lags sf each variable." As shown in the top panel of Figure 2, a positive innovation in either aggregate mix variable (MIXKSW or MIXA)leads to greater equipment investment-a result consistent with the evidence of KSW. However, as shown in the lower panels, changes in MIXL,MIXS, and FIXED do not presage a movement in investment. Any predictive power of the aggregate financing mix appears to come from the reallocation of debt across small and large firms, as demonstrated by the impulse response of equipment investment to SHIFT.
These responses are also qualitatively the same as those in the lower two panels of Figure 2 of Gertler and Gilchrist (1993), which were based on a somewhat different VAR. ' O Our series for the cost of capital and real PDE are the same as those employed by KSW. In contrast to our VAR analysis, KSW estimated more traditional models of equipment spending. Our VARs include all the variables in KSW's accelerator and neoclassical models, without imposing as many a priori assumptions about the form of the equation. In addition, the five-year distributed lags in KSW's models would be difficult to implement in our short sample.
306
THE AMERICAN ECONOMIC REVIEW
MIXKSW
MIX*
FIXED
SHIFT
MARCH 1996
0.9
FIGURE 1 . IMPULSE RESPONSES OF MIXVARIABLES TO A POSITIVE INNOVAT~ON IN THE FUNDS RATE Note: Solid lines show the impulse response (in percentage points) of each mix variable to a one standard deviation shock in the funds rate. These responses are calculated from VARs, estimated over 1975:Ql to 1991:Q2,that include the growth rates of real GDP and the GDP deflator, the change in the funds rate, and the given mix variable. Approximate 95 percent confidence intervals are given by dashed lines. To be comparable to MIXKSW and the other mix variables, HXED and SHIET are converted to levels before estimation of the VARs. The x-axis in each panel shows the number of quarters after the shock.
VOL. 86 NO. I
OLINER AND RUDEBUSCH: MONETARY POLICY, COMMENT
MIXKSW
MIX*
FIXED
SHIFT
307
FIGURE 2. IMPULSE RESPONSE OF GROWTH IN EQUIPMENT INVESTMENT TO A POSITIVE INNOVATION I N MIXVARIABLES Note: Solid lines show the impulse response (in percentage points) of the growth in real investment in producers' durable equipment (PDE) to a one standard deviation shock in various mix variables. These responses are calculated from VARs, estimated over 1975:Ql to 1991:Q2, that include the change in the cost of capital for PDE, the growth rates of real GDP and real PDE spending, and the given mix variable. Approximate 95 percent confidence intervals are given by dashed lines. To be comparable to MIXKSW and the other mix variables, FIXED and SHIFT are converted to levels before estimation of the VARs. The series for the cost of capital for PDE is from the Federal Reserve Board's quarterly econometric model. The x-axis in each panel shows the number of quarters after the shock.
308
MARCH I996
THE AMERICAN ECONOMIC REVIEW
IV. Conclusion The crucial shortcoming of most previous empirical work on the bank lending channel is the inability to identify whether movements in bank debt reflect shocks to overall credit demand or shocks to bank loan supply. KSW attempt to solve this problem by controlling for demand shocks with changes in commercial paper outstanding. With this identification of demand shocks, KSW interpret movements in bank loans relative to commercial paper after a monetary shock as reflecting changes in bank loan supply. We believe that this strategy for distinguishing supply from demand shocks is sound. Our disagreement with KSW concerns the interpretation of their aggregate results. In an economy with heterogeneous agents, aggregate results must always be treated with caution. We find that, for both small and large firms, bank debt behaves little differently than nonbank debt after a monetary shock. Using similar data, Gertler and Gilchnst (1993 pp. 59-60) also found "... no striking evidence that firms substitute from bank to nonbank credit in periods of tight money ..." Thus, based on disaggregated data, it appears clear that one cannot argue that monetary contractions limit the supply of bank debt relative to other forms of finance. Furthermore, we have shown how the aggregate results of KSW are spuriously generated by the heterogeneous response of small and large firms to monetary policy. What do our results say about the mechanism of monetary transmission? First, during the 1974-1991 period studied in this paper, the bank lending channel does not appear to have been an important part of the monetary transmission mechanism. That is, monetary contractions did not constrict the supply of bank loans relative to the supply of nonbank credit. Accordingly, we conclude that the direct link between a policy-induced drainage of bank reserves and bank lending has been quite weak over the past two decades. This finding supports Romer and Romer's ( 1990) view that banks have acquired the means to insulate their lending from a shock to reserves. However, we have provided no evidence for the period before the mid-1970's. It is entirely possible that the Federal Reserve had greater
control over the supply of bank loans during this earlier period, reflecting in large part the disintermediation caused by Regulation Q and the higher reserve requirements then prevailing for time deposits. Second, as noted in the introduction, our evidence appears consistent with a broad view of the credit channel that emphasizes the information asymmetries faced by all lenders, rather than any unique features of bank debt." In this mechanism. increases in the riskless interest rate induced by the monetary authority magnify the premium for external debt charged to certain borrowers. Small firms reside in this class of borrowers because of the severe credit market imperfections that they face. Our finding that monetary contractions redirect credit away from small firms toward large firms accords with this view of the credit channel.'' REFERENCES Bernanke, Ben S. and Blinder, Alan S. "The
Federal Funds Rate and the Channels of Monetarv Transmission." American Economic ~ e v i e wSeptember , 1992,82(4), pp. 901-21. Christiano, Lawrence J.; Eichenbaum, Martin and Evans, Charles. "Identification and the Ef-
fects of Monetary Policy Shocks." Federal Reserve Bank of Chicago Working Paper No. WP-94-7, 1994, forthcoming in Review of Economics and Statistics. Gertler, Mark and Gilchrist, Simon. "The Role of Credit Market Imperfections in the Monetary Transmission Mechanism: Arguments and Evidence." Scandinavian Journal of Economics, 1993,95( 1), pp. 43-64.
I ' For assessments of the broad credit channel based on the differential behavior of small and large firms, see Gertler and Gilchrist (1993, 1994) and Oliner and Rudebusch (1996). l 2In addition to examining movements in the mix of debt, KSW study the behavior of the spread of the prime lending rate at banks over the commercial paper (CP) rate. After a monetary contraction, they find that this spread generally widens, which they interpret as indicating a constraint on bank loan supply. However, it is also consistent with the operation of a broad credit channel: the spread widens because the risk premium associated with borrowing by bank-dependent firms increases more than the risk premium on CP borrowing by large, top-tier firms.
VOL. 86 NO. I
.
OLINER AND RUDEBUSCH: MONETARY POLICY, COMMENT
"Monetary Policy, Business Cycles and the Behavior of Small Manufacturing Firms." Quarterly Journal of Economics, May 1994,109(2), pp. 309-40.
Kashyap, Anil K.; Stein, Jeremy C. and Wilcox, David W. "Monetary Policy and Credit Con-
ditions: Evidence from the Composition of External Finance." American Economic Review, March 1993, 83(1), pp. 78-98. King, Stephen. "Monetary Transmission: Through Bank Loans or Bank Liabilities?" Journal of Money, Credit, and Banking, August 1986,18, pp. 290-303. Oliner, Stephen D. and Rudebusch, Glenn D. "Is There a Bank Lending Channel for Monetary Policy?" Federal Reserve Bank of Sun Francisco Economic Review, 1995,(2), pp. 3-20.
.
309
"Is There a Broad Credit Channel for Monetary Policy?" Federal Reserve Bank of San Francisco Economic Review, forthcoming 1996, ( 1). Romer, Christina D. and Romer, David H. "Does Monetary Policy Matter? A New Test in the Spirit of Friedman and Schwartz," in Olivier Jean Blanchard and Stanley Fischer, eds., NBER Macroeconomics Annual 1989 Cambridge, MA: MIT Press, 1989, pp. 121-83. "New Evidence on the Monetary Transmission Mechanism." Brookings Papers on Economic Activity, 1990, ( l ), pp. 149-213. "Monetary Policy Matters." Journal of Monetary Economics, August 1994, 34(1), pp. 75-88.
.
.