Monitoring and Debugging Message Passing Applications with MPVisualizer
Ana Paula Cláudio1, João Duarte Cunha2, Maria Beatriz Carmo1 1 Faculdade de Ciências da Universidade de Lisboa Departamento de Informática, Campo Grande, Edifício C5, Piso 1, 1700 LISBOA, Portugal {apc,bc}@di.fc.ul.pt 2 Laboratório Nacional de Engenharia Civil Av. do Brasil, 101, 1799 LISBOA CODEX, Portugal
[email protected] Abstract MPVisualizer (Message Passing Visualizer) is a tool for the monitoring and debugging of message passing parallel applications with three components: the trace/replay mechanism, the graphical user interface and a central component, called visualization engine. The engine, which plays the main role during the replay phase, builds an object-oriented model of the application. Taking full advantage of inheritance and polymorphism the tool can be adapted to different message passing environments and different graphical environments, and easily reprogrammed to detect specific predicates. The engine is also prepared to recognize race conditions.
1. Introduction In parallel applications several processes cooperate with one another to achieve a common goal. To enable this cooperation the processes must communicate and one way of achieving this is the exchange of messages. Applications built using this type of communication are called message passing applications. Having several processes running in parallel and communicating with one another gives rise to the so called race conditions which in turn may cause non-determinism. This is a serious trouble factor when debugging parallel applications, since bugs related to external events associated with inter-process communication may have different consequences in successive executions. The tool described in this paper, MPVisualizer, Message Passing Visualizer, was mainly developed to aid in the detection of this kind of bugs. Bugs concerning internal events, i.e. events involving one process only, can be detected using a sequential debugger. Compatibility with sequential debuggers is fully supported in MPVisualizer, as explained later. The tool provides a graphical interface where the user can visualize the progression of the application’s execution: processes, messages and communication events
are displayed. Causal order [16] between communication events is preserved in the representation. Furthermore, race conditions are automatically signaled and detection of specific predicates is possible. The components of MPVisualizer are the trace/replay mechanism, the previously mentioned graphical interface and the central component, called visualization engine. The engine is the core of the tool and plays the main role during the replay phase: it builds an object oriented model of the application. Taking full advantage of inheritance and polymorphism, two important features have been built into the engine. First, it can be adapted to different message passing environments and different graphical environments. Second, it can be easily re-programmed to detect predicates related to communication events. Furthermore, MPVisualizer automatically detects race conditions.
2. MPVisualizer This section describes the components of MPVisualizer, trace/replay mechanism, visualization engine and graphical interface, and explains the mechanisms used to detect predicates and race conditions. Section 2.1 describes the trace/replay mechanism. The visualization engine and the graphical interface, both closely related to the representation of the execution, are described in section 2.2. 2.1 The trace/replay mechanism Due to race conditions, the internal work of a parallel application may be nondeterministic, that is, two successive executions of the same application with the same input may exhibit different behaviour. A trace/replay mechanism makes a particular execution of the parallel application repeatable, allowing cyclic debugging, a frequently used technique in sequential programs. The trace/replay mechanism for applications based on the shared memory paradigm, described in [17], has been
adapted for message passing applications and is one component of MPVisualizer. The basic idea of this mechanism is that, assuming the individual processes in the parallel application do not contain nondeterministic statements, if each process is supplied with the same input values, in the same order, during successive executions, it will exhibit the same behaviour each time. The mechanism includes two distinct phases: the trace phase and the replay phase. In the trace phase, minimal information is stored in order to minimize the probe effect, that is, intrusion. Although minimal, the stored information is sufficient to ensure that, during the replay phase, each process will consume the same messages, in the same order. For this reason, the observation of any individual process during replay, using a sequential debugger, will not change the behaviour of the whole application. This is why it is possible to integrate a sequential debugger with our tool. The monitoring code is inserted in the standard libraries of the message passing software, which should not be modified by the common user. Application code is kept untouched but linking is different in the trace and replay phases. In the trace phase, the application under study must be linked with one modified library, the trace library; for the replay phase, it must be linked with a second modified library, the replay library. Therefore, during replay phase, the processes of the parallel application, hereafter called processes, will execute the routines of the replay library. These routines force the re-execution to respect the causal order of the communication events recorded during the original execution. They also force the processes to send blocks of data to a special process, named spy. In MPVisualizer, observable events are not only communication events but also the beginning and ending of a process. During replay, each time an observable event occurs in a process, a data block (a structure with a field that identifies the sort of event) is sent to the corresponding process, that is, the spy process running in the same machine. This spy then sends the blocks to the so called main process1, a kind of bridge between the parallel application and the object-oriented model of the application. 2.2. The visualization engine and the graphical interface The visualization engine relies on a central object instance of the GImanager class, explained below- to manage the object-oriented model of the application. The main process creates this object, and each time it receives a data block from a spy process, invokes the appropriate method of the object to notify the model of the occurrence of an event. Method selection depends on the type of the data block. For instance, if a given data block corresponds to a message sending the method “send_message” is 1
In the current implementation, communication between spies and the main process is socket based.
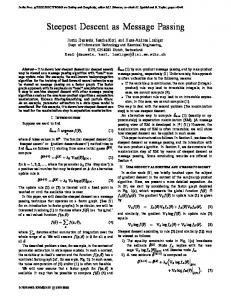
invoked. This method creates a new message object, includes it in the model and takes care of all the necessary updates. Any dependency on the message-passing software is therefore restricted to spy processes. Figure 1 illustrates the classes in the model and their relationships. These classes belong to one of two groups. The first group, the kernel, includes the basic classes that do not depend on the graphical environment: manager, process, message, machine, spy, c_event (communication event) and its subclasses. They encapsulate the data and behaviour that are generic for any message-passing application. Comparing this version of the class diagram with the one described in previous stages of development [3] [4], a new group of classes has been included, namely c_event and its direct subclasses. The addition of these classes brings three sorts of benefits. First, considering that communication events, together with the beginning and the ending of processes, are the observable events, it is important that they correspond to objects in the model. Second, it became possible to distinguish between receive execution and message consumption. This is important for debugging purposes since a process can execute any sort of receive primitive and have no corresponding message to consume. Finally, using inheritance, the model becomes easily extendable to other types of communication primitives like, for instance, a blocking synchronous send [6] derived from the class send. The second group, graphical classes, comprises the remaining classes, dealing with the graphical representation and derived from the ones in the first group. In order to achieve this, inherited methods are redefined, and new attributes and methods are added. The GImanager class has only one instance, the previously mentioned central object in the visualization engine. Polymorphism plays an essential role in this group: GIentity contains a method named “draw”, which is redefined in each of its subclasses. The Display_controller class belongs to this group of classes and, as the name suggests, is in charge of managing the display where the graphical representation of the application is shown. If the graphical environment changes, these classes have to be modified, maintaining the kernel classes unchanged. All the objects created by the GImanager object during the construction of the model, are instances of graphical classes, that is, they all know how to draw themselves and how to react to user requests. More specifically, in what concerns processes and messages, GImanager creates instances of GIprocess and GImessage classes. The distinction between GIprocess_intermediate and GIprocess as well as between GImessage_intermediate and GImessage is related to predicate detection and will be explained later. The graphical interface, figure 2, comprises a main window where a time space diagram [16] represents the progression of the re-execution. There are specific symbols
for processes, messages, and communication events. It must be strengthened that the symbols for communication events are displayed consistently with their causal order [16]. Horizontal and vertical scrollbars are used to access different parts of the time space diagram in the main window. Besides the main window, a popup window is opened every time the left mouse button is pressed when pointing at a symbol in the diagram. This window displays information about the object in the model that corresponds to the pointed symbol.
MPVisualizer supports observation during re-execution as well as post-mortem observation since the objectoriented model of the application remains accessible after the re-execution. In the present stage, post-mortem observation is available. The trace/replay mechanism was implemented and tested on top of PVM [10]. The visualization engine and the graphical interface were implemented and tested using C++ and Motif.
Spy
Machine
1..*
GImachine
1..1
1..*
1..1 0..*
Manager
Process
1..1 1..* 1..1
1..1 GIprocess_intermediate
GImanager 0..*
1..1
1..*
0..* 1..*
Message 0..1
C_event GIprocess
Send
Receive
B_receive
Consume
Nb_receive
GIconsume GIb_receive
GIsend
GInb_receive
GImessage_intermediate
GImessage 1..1 Display_controller
GIEntity 0..*
1..1
Fig.1 Class Diagram
2.3. Detection of race conditions Race conditions are in the origin of potential non determinism in parallel applications. Therefore, when
race conditions are detected, the user is notified and knows exactly which events are involved. This is a major feature in debugging.
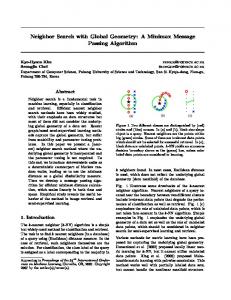
Fig. 2. The bottom windows give information about a process and a message sending. They are opened when the user clicks on top of a process symbol or a message blocking receive symbol, respectively. The graphic symbols used in the top window are: process; message; message sending; message consumption; non-blocking receive; blocking receive; non-blocking receive from any; blocking receive from any When two consecutive receive events that do not specify the sending process, called receive-from-any, occur in the same process, there is a potential race condition. However, as observed by Netzer and Miller [18], there are sequences of events that look like race conditions but are not real ones. Spurious race conditions can be eliminated as long as the causal order of the involved events is analyzed: if the first receive-from-any event “happens before” the send event that corresponds to the second receive-from-any, in the sense introduced by Lamport [16], then there is no real race condition. In MPVisualizer, the code for race condition detection lies inside class Process; consistency of causal order between events is maintained with the help of vector timestamps [9]. Figure 3 shows a popup window which has been automatically opened when a race condition was detected.
2.4. Predicate detection The kind of predicates that can be detected depends on the granularity of the observation performed by the tool. Therefore, in MPVisualizer, detectable predicates are those concerning communication events, beginning and ending of processes [3]. Classes involved in predicate detection are the ones closely related with these events,
that is, GIprocess and GImessage. Predicate detection mode can be turned on or off whenever a re-execution is started. If the user wants detection mode on, he must reprogram the class(es) involved in a specific predicate detection, GIprocess or GImessage or both. Consequently, the code of the tool has to be re-compiled. Otherwise (predicate detection mode off), GIprocess and GImessage are empty classes, just inheriting from their immediate ancestors, GIprocess_intermediate and GImessage_intermediate. If we define a block as a sequence of instructions executed by a process between two consecutive observable events, a predicate concerning observable events remains true or false inside a block, and must be reevaluated whenever an event occurs that may change its boolean value. For instance, if the predicate to be detected is “this process has consumed exactly one message with tag 2”, methods concerning message consumption have to be redefined in class GIprocess: “m_consumed” and “m_consumed_any”. Two attributes are added to the class, a counter for the consumed messages with tag 2 and a boolean for the logical value of the predicate. Basically, each redefined method invokes the method with the same name from its base class and updates the new attributes. A button click on a block representation, causes the predicate popup window to open. This window contains a short predicate description and its corresponding boolean value inside that block (figure 3).
Fig.3. The RACE Condition window was automatically opened as soon as such a condition was detected; the other window concerns predicate detection (a synthetic description of the predicate is provided in the window’s title) and is opened when the user clicks on top of a process block.
3. Distinctive features of MPVisualizer and similar tools Using the terminology introduced by the Parallel Tools Consortium2, program debuggers, together with execution trace visualizers and tools for performance tuning, form a group named Execution Analyzers. Two other groups of tools are Source Code Analyzers, used to analyze and convert serial programs to parallel code, and Parallel Languages and Libraries. The usage of execution analysis tools is mandatory for programmers to obtain correct and tuned parallel programs and takes place after the usage of any tool from the other groups. Among those, debuggers have to be used before execution trace visualizers and tools for performance tuning. The tool described in this paper, MPVisualizer, besides incorporating both a replay mechanism and a graphical representation to show the progression of the execution, includes a basic component, the visualization engine, which builds an object-oriented model of the message passing application. Taking full advantage of inheritance 2
http://www.ptools.org
and polymorphism, the tool becomes adaptable to different message passing environments and/or to different graphical softwares and the object-oriented architecture makes the tool flexible enough to be extended with an important additional skill: predicate detection. Moreover, MPVisualizer automatically detects race conditions and allows observation during replay and in post-mortem mode. In the following paragraphs a brief overview of other debugging tools is presented. These tools have been chosen because they support at least one of the following capabilities supported by MPVisualizer: incorporation of a trace/replay mechanism, fully featured graphical interface, predicate and race conditions detection. p2d2 [13] is a gdb based portable debugger for parallel and distributed programs that has been tested on several hardware platforms for PVM and MPI programs. A large number of processes can be controlled simultaneously without requiring one window for each process. Control directives, such as “set breakpoint”, can be directed to the set of all processes executing the same code. A 2dimensional process grid gives a graphical overview of all the processes in the computation, each process corresponding to a single cell in the grid. The tool allows the user to program how information, including the process grid, should be displayed on the screen. For
instance, the grid might be configured to represent running processes with green squares and stopped processes with red ones. Using the grid, the user can select individual processes or groups of processes for more detailed examination. MAD [15] is intended for the debugging of parallel message passing programs and has been tested for MPI and nCUBE2. The tool generates an event graph representation providing a global view of the program’s execution and traditional techniques such as breakpoints and program inspection can be used based on this graph. The graphical representation of an event is connected to its corresponding lines in the source code. The tool detects race conditions and allows record and replay. The user may change the order of the incoming messages and observe the consequences in the behaviour of the program, during an artificial program run. DDBG [5] is a debugging tool integrated in the parallel software environment centered on the graphical programming language GRAPNEL [8]. It uses the gdb debugger to act as a process-level debugger and contains a central debugging user interface. This tool includes a trace/replay mechanism. TotalView3 is a debugger for single and multi-process programs in C, C++ and Fortran, supporting PVM and MPI. It includes a data visualization interface where data values are displayed using colour ranges. pdbx3 and pedb3 are proprietary debuggers developed by IBM for programs running in its parallel environments and both provide support for MPI programs. pdbx is based on the sequential debugger dbx, but additional features for parallel programs are available. Process groups are permitted with breakpoints affecting all the processes in a given group. In pedb coloured animated executions and values of variables are displayed. Xmdb4 is a debugger for C, C++ and FORTRAN programs in PVM. A parallel program is debugged with respect to a single process and the user may control the messages that are delivered to this process. The tool supports any sequential debugger. A replay mechanism and a race detection mechanism are available. XPVM5 provides animated views to monitor the execution of PVM programs to assist in debugging and performance tuning. It also provides a trace/replay mechanism. In the relatively large set of investigated tools, we have not found any that simultaneously covers all the capabilities of MPVisualizer.
3
http://www.tc.cornell.edu/Parallel.Tools http://w4.lanl.gov:80/Internal/divisions/cic/cic8/para-distteam/mdb 5 http://netlib.uow.edu.au/pvm3/xpvm 4
4. Future Work Planned future work is mainly focused on the level of observation of the tool and on the quality of the graphical interface. MPVisualizer supports observation during re-execution as well as in post-mortem mode, as explained before. In order to make the observation during re-execution more powerful, we intend to introduce a breakpoint mechanism. The modified routines in the message passing library are those related to the observable events; these modifications will be extended to include a breakpoint mechanism, that is, a way to order a process to remain stopped in an observable event until explicitly told to continue. The process being stopped, may cause other processes to stop too. For instance, if a process is stopped when executing a send, the processes waiting for the corresponding message will be stopped when trying to consume it. This may produce a chain of stopped processes, in the limit, all the application processes. Having in mind the granularity of the observation we can conceive a sort of global breakpoint: every process in the application will be stopped the next time it executes a communication routine. If a process does not stop, this means that it no longer depends on the other processes or interferes in their progression. Undoubtedly, the observation of such phenomena helps the understanding of causal relations between a set of events in the application; therefore, the introduction of a breakpointing mechanism will be a major improvement in our tool. Even though we consider the adopted graphical representation adequate, we are concerned with scalability aspects, since the volume of information can become overwhelming and the use of scrollbars may not be enough. Two complementary solutions may be adopted: to dynamically change the scale factor of the whole representation and allow the user to define zoom areas. This will allow the user to get a view of the whole and also a more detailed representation of a selected portion. This type of solution is adopted, for example, in the Information Mural [14]. If we implement those facilities in our tool, they will be available both in re-execution and post-mortem observation mode. Otherwise, the Information Mural can be used in post-mortem mode, provided our tool produces, during re-execution, the necessary trace files. The adoption of the tool proposed by Carmo et al. [2] is also possible in post mortem mode. This tool is a prototype for the visualization of both geometrical and non-geometrical data allowing, among other features, information filtering and zooming. Besides the zoom mechanism, we are mainly interested in using the filtering of information facility since this allows user attention to be focused on specific events or situations, for instance, race conditions.
PVM has gained wide acceptance [19] and Geist et al. even consider it a de facto standard [11]. This, however, does not invalidate our interest in testing MPVisualizer with other message passing systems, such as MPI [7], p4[1] and Parmacs [12].
References 1. Butler, R., Lusk, E.: User’s Guide to the p4 programming system, Tech. Rep. ANL-92/17, Argonne National Laboratory, Mathematics and Computer Science Division, October 1992 2. Carmo, M.B., Cunha, J.D., Cláudio, A.P.: Visualization of Geometrical and Non-geometrical Data. In: Proceedings of the WSCG’99, Plzen, February 1999 3. Cláudio, A.P., Cunha, J. D., Carmo, M. B.: Debugging of Message Passing Parallel Applications: a General Tool. In rd Proceedings of VECPAR ’98 - 3 International Meeting on Vector Parallel Processing, Porto, June 1998 4. Cláudio, A.P., Cunha, J.D., Carmo, M.B.: MPVisualizer: a General Tool to Debug Message Passing Parallel Applications, in Proceedings of the HPCN’99, LNCS 1593, April 1999 5. Cunha, J., Lourenço, J., Antão, T.: An Experiment in Tool Integration: The DDBG Parallel and Distributed Debugger. In: Euromicro Journal of Systems Architecture, 2nd Special Issue on Tools and Environments for Parallel Processing, 1998. Elsevier Science Press 6. Cypher, R., Leu, E.: Message-Passing Semantics and Portable Parallel Programs. In: IBM Research Division - RJ 9654 (84094) January, 1994 7. Dongarra, J., Otto, S., Snir, M., Walker, D.:An Introduction to the MPI Standard. Tech. Rep. CS-95-274, University of Tenesse, 1995 8. Dózsa, G., Fadgyas, T., Kacsuk, P.: GRAPNEL: A Graphical Programming Language for Parallel Programs. In: Proceedings of uP’94: The EighthSymposium on Microcomputer and Microprocessor Applications, Budapest, Hungary, 1994 9. Fidge, C., Partial Orders for Parallel Debugging. In: Proceeedings of the ACM SIGPLAN/SIGOPS Workshop on Parallel and Distributed Debugging ACM SIGPLAN Notices, 24, 1 (Jan 1989), 183-194 10. Geist, A., Beguelin, A., Dongarra, J., Jiang, W., Manchek, R., Sunderam, V.: PVM: Parallel Virtual Machine. MIT Press, 1994 11. Geist, A.,Kohl, J., Papodopoulos, P.: PVM and MPI: a comparison of features. In: Calculateurs Paralleles, Volume 8(2), 1996 12. Hempel, R., Hoppe, H.-C., Supalov, A.: PARMACS-6.0 library interface specification. Tech. Rep., GMD, PostFach 1316, D-5205 Sankt Augustin 1, Germany, December, 1992 13. Hood, R.: The p2d2 Project: Building a Portable Distributed Debugger. In: Proceedings of SPDT’96: SIGMETRICS Symposium on Parallel and Distributed Tools, May 1996 14. Jerding, D., Stasko, J.: The Information Mural: A Technique for Displaying and Navigating Large Information Spaces. In: IEEE Transactions on Visualization and Computer Graphics, Vol. 4, NO. 3, July-Sptember 1998
15. Kranzlmüller, D., Hügl, R., Volkert, J., MAD - A Top Down Approach to Parallel Program Debugging, in Proceedings of the HPCN’99, LNCS 1593, April 1999 16. Lamport, L.: Time, Clocks, and the Ordering of Events in a Distributed System. In: Communications of the ACM, July 1978, Vol. 21, No. 7, 558-565 17. Leblanc, T., Mellor-Crummey, J.: Debugging Parallel Programs with Instant Replay. In: IEEE Transactions on Computers, Vol C-36, No. 4, April 1987 18. Netzer, R., Miller, B.: Optimal Tracing and Replay for Debugging Message-Passing Parallel Programs. In: Proc. of Supercomputing ’92, pp. 502-511, Minnneapolis, November 1992 19. Skillicorn, D., Talia, D.: Models and Languages for Parallel Computation. In: ACM Computing Surveys, Vol. 30, No.2, June 1998