North Carolina State University. MCNC Grid Computing and Network Services ... on large-scale resource sharing, innovative applications and high-performance ...
1
Monitoring and Discovery for EnLIGHTened Computing Savera Tanwir1 , Lina Battestilli2 , Harry Perros1 and Gigi Karmous-Edwards2 1
Department of Computer Science North Carolina State University Raleigh, NC, USA E-mail:{stanwir,hp}@ncsu.edu
2
Advanced Technology Group MCNC Grid Computing and Network Services RTP, NC, USA E-mail:{lina, gigi}@mcnc.org
Abstract— Resource Monitoring and Discovery of large computational data Grids is essential to guarantee high performance and reliability. In this paper, we identify the various resource monitoring and discovery issues and challenges that need to be solved in a large adaptive Grid environment. We survey the existing Grid monitoring solutions and discuss the monitoring and discovery framework that we have developed for the enLIGHTened Computing Project. Index Terms— Grid, Monitoring, Discovery, Optical Network
I. I NTRODUCTION The Grid is widely regarded as the next stage for the Internet after the World Wide Web. Grid computing is distinguished from conventional distributed computing with focus on large-scale resource sharing, innovative applications and high-performance orientation [1]. According to IBM [2], ”Grid computing is an approach to distributed computing that spans not only locations but also organizations, machine architectures and software boundaries to provide unlimited power, collaboration and information access to everyone connected to a Grid”. The Grid allows resource discovery, resource sharing and collaboration in a distributed environment, thus it can allow people from different locations and countries to work together to solve specific problems. One example of a collaborative research and resource sharing scenario in a Grid is the use of the Korea Basic Science Institute (KBSI) High Voltage Electron Microscope (HVEM) [3]. This instrument has the unique capability to analyze the 3-D structure of new materials in an atomic-scale and nano-scale by utilizing its atomic resolution high tilting feature. The three-dimensional disintegration capability of this HVEM is one of the best in the world. Needless to say, it is very expensive to build another one of these microscopes. However, through the use of a Grid, the research of many scientists around the world can benefit from the amazing properties of the KBSI microscope. A scientist may use the regular mail to send a specimen to Korea and then use the Grid capabilities to remotely examine the data from the microscope. The remote scientists will be able to view the visualization data from the microscope and remotely steer the instrument. This experiment requires a large bandwidth end-to-end lightpath from the microscope to the remote scientist machine. Today,
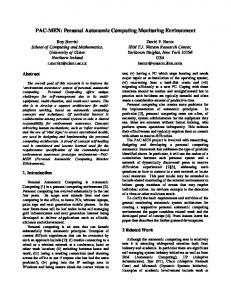
Fig. 1.
EnLIGHTened Computing Testbed
the Korean Institute of Science and Technology Information (KISTI) is using this HVEM in a remote collaboration through the GLORIAD project [4]. In the past few years much progress has been made in Grid technologies but the underlying network technologies that form a very important part of the Grid are still an underdeveloped area. The EnLIGHTened Computing project [5] aims to address this network component and to develop Grid middleware to establish dynamic, adaptive and optimized use of the network as a virtual coordinated resource along with the other Grid resources. This means that the control of the optical network is not isolated from the control of the other Grid resources. Instead, the network is tightly coordinated with the compute resources such as CPU and storage. Therefore, the Grid middleware is responsible for establishing optical connections and allocating bandwidth along with job scheduling and resource management. The enLIGHTened Computing project proposes a framework that discovers and monitors the performance and reliability of the Grid resources for adaptive resource meta-scheduling and coordination. The EnLIGHTened testbed, shown in Figure 1 consists of a variety of devices like ethernet switches, routers, optical
2
switches and clusters. The goal is to monitor all these elements and obtain relevant information from each element to help the Grid Resource Broker (GRB) in various ways. The network performance monitoring is needed for scheduling decisions, monitoring the current progress of jobs on the Grid, fault management and recovery, verifying QoS and lastly capacity planning and optimization. By discovery, we mean the process of finding a suitable resource to perform a task [6]. For example, a user may want to determine the best platform on which to run an application, a system administrator may want to be notified when changes in the system load occur or free disk space is available or a user having problems with the network may want to know the bottlenecks to fix them. This process is quite complicated in Grids because of their dynamic and distributed nature. In order to fulfill the above mentioned monitoring and discovery requirements we have identified the appropriate discovery and monitoring parameters which are needed to determine the availability and performance of the compute and network resources in a Grid. We have come up with an architecture to collect these parameters and integrate it with the Grid middleware. We discuss this in the remainder of this paper. In Section II, we discuss the related work on existing Grid monitoring approaches. Next, we briefly describe the EnLIGHTened Computing architecture in Section III. In Section IV we classify and explain the discovery and monitoring information that is required by the GRB in the EnLIGHTened Computing Grid. II. E XISTING M ONITORING AND D ISCOVERY F RAMEWORKS FOR G RID When Grid computing gained popularity, many groups came up with Grid monitoring systems [7], [8], [9], [10]. An overview of these different monitoring tools and frameworks is given in this section. A. Grid Monitoring Architecture (GMA) As the Grids are highly distributed and large, the Grid monitoring systems need to be scalable and interoperable. A general purpose information management system can not meet these requirements since the required characteristics of performance information are different. The Global Grid Forum (GGF) [11] defined a Grid Monitoring Architecture (GMA) to meet these requirements [12]. This architecture consists of three components: Consumers, Producers and a Registry/Directory Service. Producers collect information from sensors, register themselves with the Registry and describe the type and structure of information they want to make available to the Grid. Consumers can query the Registry to find out what type of information is available and locate Producers that provide such information. Once this information is known the Consumer can contact the Producer directly to obtain the relevant data. Three kinds of interactions are supported for transferring data between producers and consumers: publish/subscribe, query/response, and notification. In the first kind of interaction the initiator specifies interest in some kind of information and subscribes to it which it later
terminates while in case of query/response, all the transfer of information as a result of a query is done in a single response. Notification is a one stage interaction done by the producer to the consumer. Apart from the describing basic architecture the GGF also specified certain guidelines for the implementation like fault tolerance, adaptability, scalability, manageability, non-intrusiveness, distribution, efficiency and security. As a result, many monitoring frameworks were designed to meet the requirements of GMA. These include the R-GMA, Globus MDS, NWS etc. B. MonALISA MonALISA (Monitoring Agents in A Large Integrated Services Architecture) [13] provides a distributed service architecture for collecting and processing monitoring information developed for Grid systems. It was originally developed to support data processing and analysis of global high energy and nuclear physics collaborations but now it is used in variety of Grids. This system consists of autonomous multi-threaded, self-describing agent-based subsystems which are registered as dynamic services, and are able to collaborate and cooperate in performing a wide range of monitoring tasks. MonALISA is designed to easily integrate existing monitoring tools and procedures and to provide this information in a dynamic, self describing way to any other services or clients. These tools and procedures include SNMP, Ganglia, PBS, LSF, Condor, Abing, Iperf etc and modules for monitoring and controlling optical switches. In a Monalisa Service, the received values are stored locally into a relational database. This information can also be used to create WEB repositories components with selected information from specific groups of MonALISA services. The WSDL/SOAP interface is available in both the services and the repositories so that clients can access data from a specific Grid farm or, through a repository, they can access information received from several Grid farms. MonaLISA is currently being used to monitor large facilities for data processing in High Energy Physics and it is deployed on more than 50 HEP sites. It is also used to monitor several major WAN networks: Abilene backbone, GLORIAD, CERN-US links, CERN-IN2P3 link. Hence, MonALISA is a robust and flexible monitoring system which can be used to create higher level services to perform scheduling decisions that adapt themselves dynamically to respond to changing load patterns in large Grids. We plan to customize, integrate and extend the functionality of MonALISA to match the requirements of the EnLIGHTened Computing project. C. Globus MDS Monitoring and Discovery include obtaining, distributing, indexing, archiving and may be processing information about the configuration and state of services and resources. The Globus Alliance [14] has created the Monitoring and Discovery System (MDS) [15], [6], [16] that provides ’aggregator’ services to fulfill these requirements. These services collect latest information from the information sources and store it. It also provides interfaces, command line tools and web service interfaces to query and access the information. MDS4 has
3
three types of aggregator services: Index, Trigger and Archiver. The Index Service supports querying the latest information. The Trigger Service performs specified actions as a result of particular events. Lastly, the Archiver Service stores the monitoring data in a persistent database that can be queried for historical information. In this information-aggregator framework all the information sources have to be registered with an aggregator service. These registration have to be renewed after some period to make sure that the information is fresh. Currently the MDS4 information providers include Hawkeye, Ganglia, WS GRAM, RFT and CAS and can accommodate any other WSRF service that publishes resource properties. The MDS-Index service makes the data collected from these sources available as XML documents. This allows users to write their own applications to collect this information using Web service interfaces. Furthermore, the index services can register to each other in a hierarchy in order to aggregate data at several levels. D. Network Weather Service The NWS (Network Weather Service) [10], [17] is a distributed system that monitors and forecasts the performance of various network and compute resources that form the Grid. The service consists of a set of performance sensors from which it gathers readings of the instantaneous conditions at regular time intervals. It then uses numerical models to predict near-term of performance of the system. It has been developed to be used by dynamic schedulers and to provide QoS in a networked computational environment. The NWS is made up of four components. The first being the sensors, measure bandwidth, latency CPU, memory and disk usage. Next, a ’Memory Host’ is used to store the monitored data temporarily. The sensors and memory host register themselves with the ’Name Server’. Lastly the ’Forecaster’ is used to make predictions on the monitored performance information. Presently, meanbased, median-based and autoregressive methods are used for forecasting. NWS identifies the best forecasting technique for a give resource by applying all of them and choosing the one with the lowest cumulative error, thus providing greater accuracy. E. PerfSONAR perfSONAR (PERFormance Service Oriented Network monitoring ARchitecture) [18], [19] is an infrastructure for network performance monitoring concentrating on the endto-end performance. The perfSonar architecture is developed through a collaboration between ESNet, GEANT2 and Internet2. It contains a set of services delivering performance measurements in a multi-domain environment. The project greatly focuses on standardization of interfaces, usability and security. The design goals for this project include flexibility, extensibility, openness, and decentralization. Hence, perfSONAR is an effort to automate monitoring data exchange between networks by simplifying troubleshooting performance problems occurring between sites connected through several networks.
The services act as an intermediate layer, between the performance measurement tools and the diagnostic or visualization applications. In the perfSonar architecture, there are seven services in all. The Measurement Point Service to create and publish monitoring information, a Measurement Archive Service to stores and publish monitoring information retrieved from the Measurement Point Services, a Lookup Service to registers all services, an Authentication Service for managing domain-level access to services via tokens, a Transformation Service that offers custom data manipulation of existing archived measurements. The Resource Protector Service manages granular details regarding system resource consumption and lastly the Topology Service offers topological information on networks.
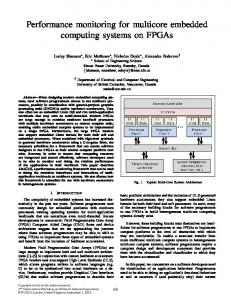
III. E N LIGHT ENED C OMPUTING A RCHITECTURE The overall goal of Enlightened is to establish dynamic, adaptive, coordinated and optimized use of the network as a vital coordinated resource connecting geographically distributed high-end computing and scientific resources for faster realtime problem resolution. The plan is to build a framework that will discover and monitor the performance, reliability and SLA compliance of the Grid resources for coordinated adaptive resource allocation and co-scheduling. The EnLIGHTened computing architecture [5] consists of four vertically integrated layers i.e. the Application Requirements and Abstraction Layer (ARAL), Resource Management Layer, Service Layer and Resource Layer. The Service and Resource layers provide APIs for advance lambda reservation and setting up and tearing down the optical paths. The Resource Management layer coordinates application requirements with optical control plane connection and compute resources scheduling. It is also responsible for performance monitoring and resource discovery. In Figure 2, the Resource Discovery module will keep track of all the registered resources. The information it contains will be regularly updated to have the latest view of the Grid. When a request comes in at the Resource Broker it will contact the discovery module for the resources that match the requirements. Once it has identified which resources are available and match the requirements, the GRB will actually reserve those resources. It will get the continuous feedback from Resource Monitoring module on the resource utilization and performance, after the job is scheduled. The Resource Monitoring module will measure the performance and notify the GRB in case of any failure or problem. This performance information can later be analyzed by the GRB for optimized scheduling and better use of resources. Figure 3 shows the network model and describes the interactions between the GRB and the various Grid resources. The network and compute resources are shown separately and part of several domains. The GRB will control all these resources based on the feedback from monitoring and discovery components. The monitoring and discovery modules will monitor the health of the system separately and report it back to the GRB.
4
Fig. 2. EnLIGHTened Architecture Layers, where shaded regions represent area of new research
Fig. 3.
EnLIGHTened Network Model
IV. E N LIGH TENED C OMPUTING M ONITORING F RAMEWORK In this section we discuss the various performance measures that help the GRB in selecting and allocating Grid resources. We discuss the monitoring characteristics of the network and the compute resources separately. A. Network Performance Measures 1) Optical Path Characteristics: The enLIGHTened testbed consists of four GMPLS-enabled optical switches, see Figure 1. Therefore, we monitor the connections and crossconnects at the optical switches. The presence of light determines the establishment of a connection and thus we monitor the power level at the ports. The link status can be determined by the presence of light between the two ports. The active cross-connects at the optical switches are also monitored in the same way. 2) Bandwidth: Bandwidth is defined as the data transferred in a unit time. Bandwidth can be measured at both path and link level. We measure the incoming and outgoing traffic at the interfaces of the network elements for each link as well as the end-to-end bandwidth to determine the bottleneck bandwidth for the entire path. There are four characteristics [20] that describe the ”bandwidth of a path” i.e capacity, utilization, available bandwidth and achievable bandwidth. Each of these can be used to describe characteristics of an entire path as well as hops.
3) Delay and Jitter: Delay is also a very important parameter especially for real-time applications. It is the time taken by a packet to transfer from one end point to the other. There are many existing tools to measure end-to-end and round trip delays line ping, pingER etc. Jitter is the variance in the delay and it is a critical parameter for the voice and video applications. Jitter is used in sizing playout buffers for applications requiring regular delivery of packets. 4) Packet Loss: Packet loss can impact the quality of service provided by network application programs. The sensitivity to loss of individual packets, as well as to frequency and patterns of loss among longer packet sequences is strongly dependent on the application itself [20]. For streaming media, packet loss results in reduced quality of sound and images. For data transfers, packet loss can cause severe degradation of achievable bandwidth. 5) Network Topology: The Grid middleware needs to have the network topology for scheduling decisions because the resources are located at different sites with different domains and policies. The topology information can also be used for optimization of the network. In the EnLIGHTened computing project we use OSPF-TE for distribution of routing information. We will obtain the topology information from the Link State Advertisements (LSAs) or the SNMP MIBs or a combination of both techniques to assist the middleware in making decisions. 6) Traffic Flows Analysis: A flow is identified as a unidirectional stream of packets between a given source and destination both defined by a network-layer IP address and transport-layer source and destination port numbers. This detailed traffic flow information can be used for application and user monitoring and profiling, network planning, ensuring and verifying QoS. B. Compute Resource Characteristics 1) Cluster Monitoring: The compute resources in a Grid consist mainly of large computer clusters. The clusters have different types of management systems and job schedulers such as LSF, PBS, Torque, Moab, LoadLeveler etc. Using these job management systems, we can get information like number of jobs running, finished, queued etc. We can also monitor the load, cpu usage, memory usage, disk usage of each node that are part of the cluster. Since jobs from several Grids might be running on the same cluster, the monitoring modules need to interact with the Grid middleware to get the information related to only those jobs that are scheduled by the middleware for EnLIGHTened Grid. 2) Application Specific Monitoring and Discovery: The GRB also requires application specific monitoring and discovery information. For example, a visualization Grid application may need information about the visualization servers such as hardware information, graphic cards, resolution etc., and the dynamic information like cpu usage, load and bench marking performance data. V. M ONITORING I SSUES The Monitoring system should collect and deliver monitoring information reliably and on-time. But there are several
5
issues that have to be dealt with to ensure this reliability and robustness. These are explained in detail below:
A. Information Collection The monitoring information encompasses a variety of parameters collected from different Grid components using several tools and techniques discussed before. There are many implementations already available for many of the measurements. We need to compare these and figure out the most accurate and suitable and make modifications and enhancements to existing solutions wherever required and possible. The architecture has to be scalable to accommodate more tools without affecting the entire system.
B. Representation Format There should be a universal way of publishing and delivering the monitoring data to the Grid middleware. To ensure that, there is a need to use universal technologies like WSDL, XML and SOAP. It is important to use standard interfaces, so that in case of collaboration between two different grids, the two GRBs may obtain the monitoring and discovery information without making any changes to the current implementation. For the EnLIGHTened Computing project, we will be writing WSDL interfaces for the time being as it has become a universal description language and being used by the majority of the Grid community.
E. Monitoring Strategies 1) Active and Passive Monitoring: A monitoring tools is considered as active if its measurements are based on traffic it induces into the network, otherwise its passive [21]. Passive monitoring tools can give a very detailed view of the network while active ones return a response that combines several performance figures. Active monitoring is more effective in measuring network sanity and for application specific measurements, while passive monitoring is mainly used for accounting purposes and measurements like throughput, roundtrip time etc. Both techniques are complementary to each other. 2) Emphasis on Standard Protocols: As discussed above, it is not a good idea to use special permissions or administrator privileges for the monitoring applications. Instead, we need to choose monitoring techniques that require minimum of these. We must select standard protocols and methods like SNMP for management of network devices. 3) Link vs Path Monitoring: End-to-end path monitoring gives a view of a system that is filtered through routing. This type of monitoring is very useful for Grid aware applications as they give a summarized view of the network that helps the GRB in resource selection considering the network path characteristics. The single link monitoring gives a view from a single observation point. These measurements give a very detailed view of the network and can be used in failure detection.
F. Distribution of Monitoring Data C. Update Frequency The frequency of update from different monitoring sensors plays a very important role in determining the overall load of monitoring on the Grid. The main challenge is to collect this information accurately at near real-time basis without overloading the network to avoid conflicts and blocking. For example we collect the optical switch information using TL1 currently. A higher frequency of these queries increases the CPU and memory consumptions the switch. Similarly endto-end bandwidth measured by Iperf introduces heavy traffic on the network, so may be its better to conduct a test when required or after longer time periods. We need to analyze the trade offs to determine the right frequency for different types of tools while not affecting the freshness of information. Because if it is collected after long time intervals it is old and will not be very effective.
The monitoring data is stored at some place to be used by the middleware. It is recommended that the repository where it is stored should not be centralized. It is better to have several small repositories with each site to avoid single point of failure. The second problem with centralized data management is that it forms a performance bottleneck. For dynamic data writes often outnumber reads with measurements taken every few seconds or minutes [12].
G. Security Since the monitoring information will include the detailed system information, network configurations and topology, it is important to secure this data from malicious users and attackers. Public key certificates can be used to enforce authentication. There should be an access control list to avoid any intrusions.
D. Non-Intrusiveness
H. Fault Tolerance
Different monitoring techniques require different amount of resources themselves. The load incurred by the monitoring tools should be insignificant part of the Grid usage. Similarly we do not want the monitoring applications to require any root privileges or special permissions etc. on the network elements and compute resources.
In large-scale distributed systems, failures can occur quite often. The monitoring applications can run into errors or the system on which they are installed may go down. For such scenarios, we should have some fault tolerance. The system should be able to recover from these failures and data should be replicated to avoid any losses.
6
Web Service
ALL SITES REPOSITORY
Site 1
Site 2
Web Service Web Service
Ethernet Switch Flow Monitoring
Calient PXC
Ethernet Switch
Calient PXC
Monitoring Data Monitorin g Data
Network Topology Discovery
Fig. 4.
Fig. 6.
Optical Switch Configuration for EnLIGHTened testbed
Deployment Scenario
interfaces to retrieve data collected from these various tools in the same standard format such that it can be used by any consumer. VII. C ONCLUSION AND F UTURE W ORK
Fig. 5. MonALISA client GUI : current monitoring information from the EnLIGHTened testbed can be viewed
VI. D EPLOYMENT S CENARIO A distributed monitoring system is needed to monitor different sites that are part of the Grid. Figure 4 explains the deployment scenario in the enLIGHTEned Computing project. There is a monitoring service at each site which monitors the clusters and all network elements and records the performance data in a local database. Apart from that all the monitoring services report their data to a centralized repository for the entire Grid. This larger repository database maintains history information and can be used for detailed analysis. Web services are used to extract data from the all of the databases. We plan to deploy different tools on our testbed to collect the above mentioned parameters. Currently we have MonALISA services running at four Grid sites in Raleigh, Chicago, Baton Rouge and Los Angeles. These services have their own databases and web services to store and publish the information. We also have a web repository to collect relevant data from all these sites to maintain history and detailed analysis. These services can be seen in the Figures 5 and 6. We plan to deploy other network monitoring tools for endto-end measurements, network topology discovery and traffic flow analysis. In future we will be writing standard WSDL
We have discussed the various tools and techniques and the issues involved in collecting performance monitoring information from various elements of the Grid. Next, we want to determine how to abstract this information for the coscheduling decisions. One way to do this is to use the notion of an abstract link between two edge network elements. This abstract link will aggregate the QoS of the multiple possible paths between the two edge network elements and can be advertised between different domains. The other area that needs of be addressed is the forecasting of future availability of the resources and the performance of the Grid. For example, when choosing a resource we will not only look at the current load on that system but an estimate of the load in the near future when it executes a program. VIII. ACKNOWLEDGEMENTS We would like to thank Iosif Legrand, Ramiro Voicu and Alex for their support with the MonALISA. We acknowledge Matti Hiltunen and Rick Schlichting from AT&T, Yufeng Xin From MCNC, Olivier Jerphagnon from Calient and Wayne Clark from Cisco for their help with the concepts and discussions. R EFERENCES [1] I. Foster, C. Kesselman, and S. Tuecke, “The anatomy of the grid: Enabling scalable virtual organizations,” International J. Supercomputer Applications, vol. 15, no. 3, 2001. [2] L.-J. Zhang, J.-Y. Chung, and Q. Zhou, “Developing grid computing applications, part 1,” March 2005. Available from URL http://www128.ibm.com/developerworks/library/gr-grid1/. [3] “ High Voltage Electron Microscope at Korea Basic Science Institute (KBSI) web page.” http://hvem.kbsi.re.kr. [4] “ GLObal Ring network for Advanced application Development (GLORIAD) Project web page.” http://www.gloriad-kr.org. [5] “Enlightened computing proposal subitted to nsf.” http://www. enlightenedcomputing.org, 2006. [6] I. Foster, “Gt4 primer.” Available from URL http://www.globus.org/toolkit/docs/4.0/key/, May 2005.
7
[7] R. L. Ribler, J. S. Vetter, H. Simitci, and D. A. Reed, “Autopilot: Adaptive control of distributed applications,” in HPDC, pp. 172–179, 1998. Available from URL http://citeseer.ist.psu.edu/ribler98autopilot.html. [8] B. Tierney, B. Crowley, D. Gunter, M. Holding, J. Lee, and M. Thompson, “A monitoring sensor management system for grid environments,” in HPDC, pp. 97–104, 2000. Available from URL http://citeseer.ist.psu.edu/tierney00monitoring.html. [9] A. Waheed, W. Smith, J. George, and J. Yan, “An infrastructure for monitoring and management in computational grids,” in Proceedings of the 2000 Conference on Languages, Compilers, and Runtime Systems, pp. 235–245, 2000. [10] R. Wolski, N. T. Spring, and J. Hayes, “The network weather service: a distributed resource performance forecasting service for metacomputing,” in Future Generation Computer Systems, vol. 15, pp. 757–768, 1999. Available from URL http://citeseer.ist.psu.edu/wolski98network.html. [11] “ The Global Grid Forum web page.” http://www.gridforum. org. [12] B. Tierney, R. Aydt, D. Gunter, W. Smith, M. Swany, V. Taylor, and R. Wolski, “A grid monitoring architecture,” tech. rep., GGF Performance Working Group, January 2002. [13] I. C. Legrand, H. B. Newman, R. Voicu, C. Cirstoiu, C. Grigoras, M. Toarta, and C. Dobre, “Monalisa: An agent based, dynamic service system to monitor, control and optimize grid based applications,” in CHEP 2004, 2004. URL http://monalisa.cacr.caltech.edu/. [14] “ The Globus Alliance web page.” http://www.globus.org. [15] J. M. Schopf, I. Raicu, L. Pearlman, N. Miller, C. Kesselman, I. Foster, and M. DArcy, “Monitoring and discovery in a web services framework: Functionality and performance of globus toolkit mds4,” tech. rep., Technical Report ANL/MCS-P1248, 2004. [16] G. T. M. Team, “Mds4 and project deployments,” tech. rep., GGF, 2005. Available from URL http://wwwunix.mcs.anl.gov/ schopf/Pubs/jmspubs.html. [17] “ NWS Webpage.” http://nws.cs.ucsb.edu. [18] T. Coviello, T. Ferrari, K. Kavoussanakis, L. Kudarimoti, M. Leese, A. Phipps, M. Swany, and A. S. Trew, “Bridging network monitoring and the grid,” in CESNET 2006, 2006. [19] “ perfSonar web page.” http://wiki.perfsonar.net. [20] B. Lowekamp, B. Tierney, L. Cottrell, R. Hughes-Jones, T. Kielmann, and M. Swany, “A hierarchy of network performance characteristics for grid applications and services,” GWD-C, Network Measurements Working Group, Global Grid Forum, June 2003. Available from URL http://www-didc.lbl.gov. [21] S. Andreozzi, D. Antoniades, A. Ciuffoletti, A. Ghiselli, and E. Markatos, “Issues about the integration of passive and active monitoring for grid networks,” 2005. Available from URL http://www.ics.forth.gr/dcs/Activities/papers/2005.coregrid.pasvactive.pdf.