Working Paper 18
Monitoring and Evaluating the Performance of the Labour Market in Scotland
John Sutherland Centre for Public Policy for Regions University of Glasgow Ivy Lodge 63 Gibson Street Glasgow G12 8LR Email:
[email protected]
Monitoring and Evaluating the Performance of the Labour Market in Scotland
ABSTRACT Given the Scottish Government’s decision to benchmark the performance of the labour market as one of the seven targets identified in its ‘Economic Strategy’, this paper examines how the performance of the labour market might best be monitored and evaluated. It recommends that, with some caution with regard to the need for frequent disaggregation, four indicators are used: the activity (or participation) rate; the employment rate; the unemployment rate; and the inactivity rate.
The paper proceeds to apply these four indicators to examine the performance of the labour market in Scotland over two periods: 1995 – 2005; and 2005 (third quarter) – 2007 (fourth quarter). For the latter period, the performance of the labour market in Scotland is compared with that of the labour markets in England, Northern Ireland and Wales.
Finally, the paper employs two of these labour market performance indicators (the activity rate and the unemployment rate) to examine the Scottish Government’s ‘cohesion’ aspiration.
i
Monitoring and Evaluating the Performance of the Labour Market in Scotland 1.
INTRODUCTION An important feature of the Scottish Government’s Economic Strategy
(Scottish Government, 2007) is the identification of a set of seven targets. Described as “challenging” (p. 6), these targets take two forms: aspirational targets, designed to set long term direction and ambition, and shorter term targets, designed so that economic performance may be monitored and evaluated, and government policy appraised. Further, these targets are articulated in relative rather than absolute terms, in that they conform to the conventions of benchmarking, whereby Scottish performance will be compared and contrasted to that of pre-determined other countries, sometimes other countries within the United Kingdom, sometimes independent nation states (Star, 2002).
Of the seven targets identified, one relates specifically to the labour market viz. ‘labour market participation’.1 However, the performance indicator used in this context (participation) is used also in the context of the ‘cohesion’ target, to reduce spatial differences across the local authority areas of Scotland. Further, through successful participation in the labour market i.e. obtaining employment, individuals earn, and earnings constitute the principal, often only, source of income for most. In this way, the labour market – or, more accurately, successful (or otherwise) participation in the labour market - impacts upon yet another target viz. ‘solidarity’, to increase the overall income and the proportion of income earned by the three lowest income deciles taken as a group. In turn, differences in individual earnings reflect differences in individual productivity, the consequence of previous investments in human capital. Enhancing individual human capital, therefore, may increase an individual’s productivity and earnings. It may also enhance labour productivity within
1
It must be said at the outset, that the document’s discussion of the historical, comparative performance of the labour market in Scotland and its identified target is somewhat ambiguous, sometimes referring to ‘participation’ sometimes referring to the ‘employment rate’, as if they were interchangeable terms. They are not. As will become apparent, they constitute two different indicators of labour market performance. The working assumption of this paper is that the Scottish Government’s target is ‘labour market participation’, measured by the ‘participation’ rate (or the ‘activity’ rate, as it will be referred to hereafter in this paper).
1
the economy as a whole, a fourth target. Moreover, increasing labour productivity is seen as a necessary condition for achieving the Scottish Government’s principal target, that of increasing sustainable economic growth.
In essence, the efficient operation of the labour market and the effective actions and behaviours of its three principal actors, businesses, workers and government, are central to any economy which seeks to increase sustainable economic growth, adjusting to meet changing demands occasioned by the advent of new products and processes and facilitating business development and expansion and new business creation.
Given this, the aim of this paper is to examine how the performance of the labour market in Scotland may be best monitored and evaluated. The objectives of the paper are fivefold. The first is to provide a brief description and appraisal of the targets identified by the Scottish Government, to set the context and to re-emphasise the centrality of the role of the labour market. The second is to examine the operation of labour markets in general from a ‘stocks’ perspective, identifying potential performance indicators in so doing. The third objective is to investigate the performance of the labour market in Scotland over the period 1995 – 2005, making use of these performance indicators. Again using these same indicators, the fourth objective is to investigate the performance of the labour market in Scotland from a comparative perspective using more contemporary data (i.e. for the 10 calendar quarters, 2005, quarter 3, to 2007, quarter 4). The fifth and final objective is to make use of two labour market performance indicators (viz. the activity rate and the unemployment rate) to examine the Scottish Government’s ‘cohesion’ target. The paper is structured accordingly.
The argument is that four indicators are required to monitor and evaluate the performance of the labour market viz. the activity rate, the employment rate, the unemployment rate and the inactivity rate because each rate offers different perspectives of performance. Nevertheless, even using four indicators of performance makes for a less than perfect basis for a comprehensive analysis and investigation of the operation of the labour market. Consequently two important qualifications are made. First, different perspectives of performance often emerge when the four rates 2
identified are disaggregated, by age, gender and space, for example. Secondly, these indicators of performance have their origin in counts made of the number of individuals in specific labour market states at given points in time, such as ‘in employment’ or ‘unemployed’. As such, they ignore the important dynamics of the labour market, reflected in the frequency and manner in which, over time, individuals move from one labour market state to another.
2.
THE SCOTTISH GOVERNMENT’S TARGETS The Economic Strategy document (Scottish Government, 2007) identifies
seven targets. These are presented in Table 1, in such a way that long term aspirations may be distinguished from short term policy objectives.
These targets relate to the Scottish Government’s overall purpose, of focussing “the Government and public services on creating a more successful country, with opportunities for all of Scotland to flourish, through increasing sustainable economic growth” (Scottish Government, 2007, p. 1) and its five strategic objectives of seeking to create a ‘wealthier and fairer’, ‘smarter’, ‘healthier’, ‘safer and stronger’ and ‘greener’ Scotland (Scottish Government, 2007, Figure A1, p. 2).
Why these seven targets should be identified (and why ‘seven’?) is not rationalised. Although the preamble introduced targets of two complementary types, short run objectives and long run aspirations, more is said about the latter than the former. As a consequence, the scope to evaluate government performance is much reduced. Although the process is one of benchmarking, the comparator groups frequently change between targets, again without explanation. For example, for ‘growth’ the benchmark is some member states of the European Union; for ‘productivity’, it is OECD countries. Further, the countries in question are not always explicitly identified, despite regular references throughout the document to the ‘successful independent economies’ of Norway, Finland, Iceland, Ireland and Denmark, known collectively as the ‘arc of prosperity countries’. The appropriateness of the targets specified may be questioned. For example, to introduce a theme which will be developed in more detail in the subsequent section, why target the labour force ‘participation’ (or activity) rate (which, by definition, includes those participating in
3
the labour market but not necessarily in employment), rather than the labour force ‘employment’ rate? The seven targets are presented as if they are independent of one another, rather than inter-related within the economic system. For example, improving the rate of growth may result in an increase in the size of the population, through inmigration. Conversely, a stagnant economy may prompt out-migration, thereby decreasing the size of the population. Finally, to achieve policy targets –short run or long run – it is necessary to design and implement appropriate policy instruments. Notwithstanding the fiscal and monetary constraints under which the present ‘devolved’ (and not ‘independent’) administration operates, the discussion of both targets and strategies wholly ignores the concomitant issue of policy instruments.
3.
EXAMINING THE OPERATION OF THE LABOUR MARKET: A ‘STOCKS’ PERSPECTIVE Three actors dominate the labour market: businesses, government and
workers. Businesses and government demand labour, a demand derived from individuals’ demand for private goods (such as ‘bread and circuses’), public goods (classically illustrated by defence and law and order) and social – or merit - goods (such as education and health). Workers supply labour to meet these diverse demands. To the extent that the labour market is like other markets in that it operates less than perfectly, government plays an important additional role, that of implementing policies designed to improve the operation of the labour market.
One measure of the demand for labour is the number of jobs in the economy – where this information would be obtained from Workforce Jobs quarterly surveys – together with the number of vacancies notified by companies and organisations – where this information would be obtained from the Office of National Statistics’ (ONS) monthly vacancy survey of enterprises. A somewhat less than perfect alternative measure of the demand for labour is the number in employment, where this information would come from quarterly Labour Force Surveys (LFS). The number in employment is less than the number of jobs in the economy because some individuals have more than one job. However, one advantage which accrues from using LFS data is that the number in employment may be subdivided into diverse components, such as those working as self employed; those working unpaid within family businesses; those working as
4
employees; and those working on government employment schemes. Those working as employees may be further subdivided, for example to distinguish between those working full time from those working part time; and to distinguish between those working on temporary and/or fixed term contracts from those working on ‘normal’ contracts.
Within the population as a whole, in the UK, those aged 16 years and over are deemed eligible to participate in the labour market.2 This subset of the population measures the potential size of the labour force. Ultimately, therefore, the potential size of the labour force depends upon the size and age composition of the population. In the long run, the size and age composition of the population are determined by demographic factors, such as birth rates and death rates. In the short run, however, the size and age composition of the resident population and, therefore, the size and age composition of the potential workforce, is affected by both the magnitude of in and out migration and the characteristics of the migrants. For example, the out-migration of individuals of prime working age and the in-migration of an equal number of individuals of retirement age will have very different impacts upon potential labour supply.
Not all those eligible to participate in the labour market elect to do so. A person is described as economically active if he/she is either employed or unemployed in a particular period. The activity rate measures the number economically active as a percentage of the number within the population eligible to participate in the labour market. As such, it is an indicator of the actual size of the workforce in that period. Whether or not an individual chooses to participate in the labout market – and if the decision is to do so, the manner of this participation – depends upon several factors, such the potential wage to be got from participation and factors which constrain if not inhibit participation, such as an individual’s caring responsibilities. The ONS considers the activity rate to be the headline measure of labour market performance, and this most probably explains the Scottish Government’s decision to use this particular performance indicator as its labour market target. The activity rate is not independent of the demand for labour. In other words, whether or not an individual chooses to participate in the labour market may depend upon his/her perceptions of 2
16 is the school leaving age. Were the school leaving age to change, therefore, eligibility would change accordingly.
5
the availability of appropriate jobs within the local economy (Beatty and Fothergill, 2002: Beatty et al, 2007: Fothergill and Wilson, 2007). The activity rate, therefore, will vary over time, changing with changes in individual work and non-work preferences, the factors which influence these preferences and the demand for labour.
It is possible to subdivide those who participate in the labour market – the economically active - into two constituent components. The number who participate in the labour market and have jobs as a percentage of those eligible to participate in the labour market measures the employment rate. The number who participate in the labour market and do not have jobs as a percentage of those eligible to participate in the labour market measures the unemployment rate.3
4 5
Both the employment rate
and the unemployment rate vary over time, moving in opposing directions although not with equal magnitude, most especially as a consequence of changes in the demand for labour. The employment rate tends to be pro-cyclical.
The reciprocal of the activity rate is the inactivity rate, measured as the percentage of those eligible to participate in the labour market who choose not to do so. This group consists of those people who are out of work but who do not satisfy all of the previously identified ILO criteria for unemployment, most especially because they are either not seeking work or are unavailable to start work at that point in time. The principal economically inactive groups are: students; people looking after family and 3
It is important to differentiate between this statistic of unemployment, which has its origin in a survey, and the claimant count, which has its origin in administrative data. The LFS/ONS produce estimates of unemployment using the International Labour Organisation (ILO) definition. Under this definition people aged 16 and over are unemployed if they meet the following criteria viz. are: out of work, want a job, have actively sought work in the last four weeks and are available to start work in the next two weeks; or are: out of work, have found a job and are waiting to start it in the next two weeks. This is different from the claimant count, which measures those unemployed people who are claiming unemployment-related benefits (viz. Jobseeker's Allowance and National Insurance Credits). The claimant count is normally the lower measure of the two because some unemployed people are not entitled to claim unemployment-related benefits, or choose not to do so (Machin, 2004). 4 Within the context of the demand and supply model of the labour market, the unemployed are often regarded as potential additional labour supply. It is argued that the unemployed want to supply their labour and are both seeking and are available for work. As such, they are assumed to have a greater attachment to the labour market than those, for example, who do not have a job and are not looking for one at that period in time i.e. the inactive. Little (2007) examines the issue of attachment/detachment from the labour market in detail. Little’s argument is that there is considerable behavioural heterogeneity among those traditionally described as inactive. 5 Unemployment, although its precise definition has changed over time, is the traditional measure of labour market performance used to designate spatial disparities (Armstrong and Taylor, 2000). Indeed, Armstrong and Taylor argue that “Regional policy exists primarily because of the persistence of regional unemployment disparities” (p. 166), whether the origin of the policy in question is either the UK or the EU.
6
home; the long-term sick and disabled; the temporarily sick or injured; retired people; and discouraged workers (defined as those who consider job search to be futile because of the manifest absence of appropriate vacances within the local economy). The characteristics of people who are economically inactive vary, therefore, often depending on the reason for their inactivity. For example, students tend to be young and at the start of their working lives: those looking after family and home tend to be female and of child-rearing age: and retirees tend to be close to retirement age. Again, the inactivity rate changes over time, most especially with changes in the demand for labour. Conventionally, changes in the inacitivity rate and changes in the demand for labour are presented as negatively correlated.
Thus far, these four rates have been described from the perspective of the population as a whole. However, the numerical values of the calculated rates differ when the population is subdivided, for example, by gender and age group. As has been noted, gender – and the caring responsibilities associated mostly with females – part explains the state of economic inactivity for some. So too does age part explain the state of economic inactivity for some, for example when the individual is participating in (e.g. further or higher) education beyond the school leaving age of 16. As a consequence, labour market analysts frequently prefer to refer to the four rates identified above for particular gender and age sub divisions of the population. Additionally, each of these rates varies across space, for example for different geographies within Scotland, such as local authority areas associated with the ‘cohesion’ target.
Measurements of the activity rate, the employment rate, the unemployment rate, and the inactivity rate may be derived from the quarterly LFS. They offer four different, but complementary perspectives of the performance of the labour market. For a given level of labour demand within an economy, the activity rate measures those willing to supply labour; the employment rate measures those willing to supply labour who are in employment; the unemployment rate measures those who are willing to supply labour but who are out of work; and the inactivity rate measures those who are not participating in the labour market, for diverse reasons. The probability that an individual chooses to participate in the labour market (or not) and – conditioning on the decision to participate – the probability that an individual is in employment (or not) is part explained by the (frequently inter-related) characteristics of the individual, 7
most especially his/her age, health status, and qualifications/skills levels. Hence the importance of active labour market policies, designed to improve health and enhance human capital and, thereby, increase the two probabilities that an individual participates in the labour market and obtains employment (Adams and Thomas, 2007). As has been noted above, however, the important role of the demand for labour, most especially in local economies, as opposed to the national economy, cannot be ignored as another determinant of these labour market decisions and outcomes.
The measurement bases of these four performance indicators are labour market ‘stocks’ at a given point in time i.e. the period of the survey.6 Effectively, counts are taken of the number in different labour market states (also known as ‘stocks’), such as ‘in employment’; ‘unemployed’ etc.. Over time, however, for example from the time of one survey to the next, not only does the count of the number in each of these states change, so too does its composition, as some individuals move from one labour market state to another. For example, some individuals join the unemployment stock from alternative labour market states; and, during the same period, some individuals leave the unemployment stock, again for alternative labour market states. (And, of course, the number counted as ‘unemployed’ will increase/decrease depending upon the relative magnitudes of these on-flows and off-flows.) The size and direction of these transitions – such as the probability of becoming unemployed; the probability of quitting the unemployed stock for employment – and the determinants of individual transition probabilities are also of consequence to policy makers. Although in principle this important information may also be derived from the LFS, in practice it is more difficult to extract and analyse.7 As a consequence, it is rarely done, if to the detriment of monitoring and evaluating the performance of the labour market (and, of
6
As such, they provide only a ‘quantity’ perspective, whereas some ‘quality’ perspective may warrant consideration, especially given some of the recommendations of the Leitch Report (2006), for example that more than 90 percent of adults in the UK in terms of skills levels should be qualified to at least level two and at least 40 percent should be qualified to at least level 4, by 2020. 7 Ideally, what is required to undertake this type of analysis is a panel data set, rather than the cross section data set that is the LFS. The British Household Panel Survey (BHPS), for example, would be the most appropriate. (For examples of the use of BHPS data sets to analyse some aspects of the Scottish economy, see Ermisch and Wright, 2005).
8
course, to examining workers’ experiences of participating/not participating in the labour market).8
4.
AN HISTORICAL PERSPECTIVE: THE LABOUR MARKET IN SCOTLAND, 1995-2005 This section of the paper examines the labour market in Scotland over the
period 1995 -2005, making use of the supply and demand framework outlined in the previous section and reporting outcomes for the performance indicators identified and discussed there. The emphasis is more on describing the trends observed rather than seeking to explain them, given the identified aims and objectives of this paper.
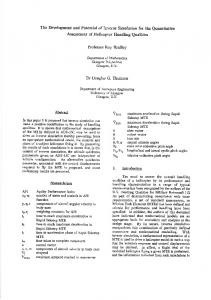
The demand for labour, as measured by the total number in employment, increased throughout the period, with the rate of increase being marginally greater in the latter part (Figure 1). There was a secular increase – if not significant increase - in the numbers employed on a part time basis, part of a longer run trend. Traditionally, part time employment has been associated most with female employment. What is noticeable is that the percentage of females employed becomes greater than the percentage of people working part time from 2000-2001, indicating that proportionately more women were working on a full time basis from the beginning of the 21st century.
In terms of the supply of labour, there was a marginal increase in the number aged 16+, reflecting net in migration during this time. Again this is especially apparent from 2000/2001 onwards (Figure 2). However, there was a similarly small decrease in the percentage of the population of working age, reflecting the increasing proportion of those who are retired among the Scottish population, a trend which is an EU-wide phenomenon (McQuaid et al, 2008).
Not unexpectedly, given the increase in labour demand throughout the period, there was an increase in the activity rate. However, this increase is wholly attributable to the increase in the female activity rate (Figure 3). To the extent that the ONS sees this 8
For example, the transition (of how many and whom) from unemployment to insecure, low wage employment (Stewart, 2007).
9
as the ‘headline’ performance indicator – and likewise the Scottish Government which uses this same indicator as its labour market target – there is some evidence of an improvement in the performance of the labour market over this period, therefore, although this outcome must be qualified given the nature of the gender differences noted.
The increase in the activity rate was accompanied by an increase in the employment rate, again more noticeably post 2000 and for females more than males (Figure 4). There was a corresponding decrease in the unemployment rate, almost equally for males and females. Importantly, however, these decreases are more apparent before than after 2000 (Figure 5), demonstrating that although changes in the employment rate and unemployment rate tend to move in opposite directions the magnitudes of the respective changes are not necessarily equal.
Over the period, the inactivity rate for all decreased, very much in accordance with expectations given the outcomes for some of the other performance indicators discussed above. The decrease, however, was not great and was wholly attributable to the decrease in the female inactivity rate. There was little change in the male inactivity rate, despite the long run increase in the aggregate demand for labour. Indeed, for some years during the period, the male inactivity rate actually increased. This phenomenon of an unvarying if not increasing inactivity rate for males despite increases in labour demand is not unique to Scotland (McVicar, 2006). In the UK, much of the debate surrounding male inactivity rates is discussed in the context of the nature of the invalidity benefit system and the manner in which this system is administered (Fothergill and Wilson, 2008).
The decade 1995-2005, therefore, in Scotland, was a period associated with an increase in the demand for labour. This was accompanied by increases in the activity rate and the employment rate and decreases in the unemployment rate and, if to a lesser extent, the inactivity rate. Gender differences have been observed – probably equally important age differences have not been investigated. Female rates have tended to have been more responsive to the changing conditions of labour demand. Part of this may be attributable to changing preferences on the part of women vis-àvis their labour market participation decisions: part may be explained by employers’ 10
recruitment and selection preferences. Most significantly, however, the male inactivity rate has been less than responsive to increases in labour demand.
5.
A CONTEMPORARY, COMPARATIVE PERSPECTIVE: THE LABOUR MARKET IN SCOTLAND, 2005q3 – 2007q4 The principal aim of this section of the paper is to examine the performance of
the labour market in Scotland from a comparative perspective. It uses the same demand and supply framework applied in the previous section, and examines performance using the same set of performance indicators. It employs Annual Population Survey data sets for 10 quarters, for the period September 2005 to December 2007.9 Accordingly, the comparison is restricted to the other countries within the UK viz. England, Northern Ireland and Wales, and, again, the focus is more on description rather than explanation.
To provide some context for this examination, Figures 7 and 8, respectively, replicate Figures 1 and 2, and present preliminary information on ‘labour demand’ and ‘labour supply’ for the period in question. A further, if marginal increase in the demand for labour may be observed between the quarters 2005q4 and 2007q1 (with negligible changes to the percentage of females/part timers in employment): and the supply of labour continues to exhibit the previously observed trends of (marginal) increases in the number of the resident population aged 16+ and (again marginal) decreases in the percentage of whom who are of working age.
Activity rates for the 4 constituent countries of the UK are presented in Figures 9, 10 and 11. For the aggregate activity rate (viz. ‘people’ in Figure 9), there is a clear hierarchy in terms of a ranking which never changes throughout the period: Scotland, England, Wales and Northern Ireland. However, as may be seen from Figures 10 and
9
The Annual Population Survey is derived from the Labour Force Surveys, and supersedes the Local Authority Labour Force Survey from 2004. Available data relate to all Labour Force Surveys conducted over the year ending on the date in question. For example, December 2007 covers the four quarterly (calendar based) surveys conducted from January/February/March 2007 through to October/November/December 2007. This data set is used because one of the geographies available is that of the Local Authority Area, the geographical focus of the ‘cohesion’ theme to be examined in the subsequent section.
11
11, Scotland’s position in this hierarchy is attributable to the relatively superior performance of the ‘females’ indicator.
A similarly clear hierarchy with the same order of ranking may be observed for aggregate employment rates (Figure 12). Once again, Scotland’s position in this ranking is principally attributable to the performance of the ‘females’ indicator (Figure 13), although a marginal improvement in the ‘males’ indicator is evident for the latter quarters of the period, an improvement sufficiently great to out-perform England by the final quarter (Figure 14).
Measured in terms of the aggregate unemployment rate (viz. ‘people’ in Figure 15), the performance of the labour market in Scotland improved from 2006q3 (in contrast to that of England and Wales where it deteriorated over approximately the same period). On this occasion, the improvement in Scotland’s absolute and relative performance is more attributable to a discernible decrease in the male unemployment rate (Figure 16) during a period in which the female unemployment rate remained relatively unchanged.
The three inactivity rates are mirror images of the activity rates (Figures 18, 19 and 20). Although an equivalent hierarchy may be observed, what is most notable for all countries is the relative constancy in the rates over time, irrespective of gender or changing conditions of labour demand.
Two conclusions may be made from this examination of the performance of the labour market in Scotland from a comparative perspective and for a more contemporary period. The first relates, specifically, to the Scottish Government’s labour market target; and the second relates, more generally, to the use of the four indicators to monitor and evaluate performance.
The Scottish Government’s short term objective is to ‘maintain our position on labour market participation as the top performing country in the UK’. Figure 9 illustrates the historical position, and the premier position of Scotland in the inter country ranking which the Scottish Government seeks to sustain in the future. Nonetheless, Figures 10 and 11 illustrate that this superior aggregate position does not hold when the data set 12
is disaggregated by gender. The comparative performance of the labour market in Scotland is equally good when examined using the employment rate, although again subject to the same caveat with respect to disaggregation by gender. However, a different perspective of comparative performance across countries emerges when the unemployment rate is used. This demonstrates that the use of a diverse set of indicators is to be preferred rather than only one indicator when the purpose is to monitor and evaluate labour market performance. Different indicators offer different perspectives. That said, care must be made to note possible differences in performance, irrespective of the rate used, when the aggregate rates are subdivided, for example by gender (or by other personal characteristics, such as age).
6.
EXAMINING ‘COHESION’, USING LABOUR MARKET PERFORMANCE INDICATORS The process of economic development varies across space. However, how
economic development – or performance - should be measured; how Scotland should be subdivided geographically to examine spatial differences in performance; and how intra-area differences in performance should be measured are three very problematical issues. The Scottish Government’s ‘cohesion’ aspiration is to ‘narrow the gap in participation between Scotland’s best and worst performing regions (i.e. Local Authority Areas) by 2017’, thereby electing to examine performance by means of one indicator of labour market performance (viz. participation); to define geography by means local authority area boundaries; and to define inter-area differences by means of the ‘range’, one of several possible statistical measures of dispersion or variability.
The aim of this section of the paper is to examine cohesion across the 32 local authority areas of Scotland using two indicators of labour market performance and three measures of dispersion. The (aggregate for the population of working age) activity rate (the Scottish Government’s chosen indicator) and the (aggregate for the population of working age) unemployment rate (the indicator associated most with measuring spatial disparities) are the selected indicators of labour market performance, their selection being rationalised by the sometimes different perspectives of performance they offer, as has been demonstrated in the previous section. The range is the first of the three measures of dispersion used. This is the
13
simplest measure of variability, calculated as the difference between the largest data value (e.g. of the activity rate/unemployment rate) and the smallest data value. The standard deviation is the second measure of variability used. This measures the average amount scores (e.g. activity rates/unemployment rates for each local authority area) in a distribution of scores deviate from the mean. In this way, it takes into consideration all the local authority areas, not merely the best/worse performing ones. The greater the spread of these scores, the larger is the magnitude of the standard deviation. However, the magnitude of the standard deviation depends upon the units used to measure the variables in question. When there is some difference between these – as there is, for example, in the context of the activity rate, producing relatively high mean scores, and the unemployment rate, producing relatively low mean scores – it is often necessary to examine the standard deviation relative to the mean. Accordingly, the third measure of spread used in this examination is the coefficient of variation.
Values of the range, the standard deviation and the coefficient of variation for the 32 local authority areas for each of the 10 quarters for the period 2005q3 – 2007q4 for activity rates and unemployment rates are presented in Tables 2 and 3 respectively. Although the identity of the ‘best’ performing local authority area tends to vary geographically, the identity of the ‘worse’ performing local authority area is always within the West of Scotland/Strathclyde.10
Figures 21 through to 23 complement these tables, illustrating the extent to which magnitudes of the three measures of dispersion for the two indicators of labour market performance vary over time, as the demand for labour changes during the period, especially the marginal increases in demand observed for the sub period 2005q4 – 2007q1.
During this short period of expansion in the labour market, there is some evidence that the range between the best and worse performing local authority areas in terms of activity rates widened, but there was little change of consequence in the context of the 10
This identification of the west of Scotland/Strathclyde as Scotland’s ‘problem’ region confirms earlier analyses of a more comprehensive range of objective and subjective data sets reported by Bell and Blanchflower (2007).
14
unemployment rate. Similarly, there was little change of consequence – either for activity rates or unemployment rates – in the magnitude of the standard deviation or the coefficient of variation, the two more sophisticated measures of spread (or ‘cohesion’). One possible interpretation of these results is that although the summary measures of dispersion have changed little there has been a tendency for the increase in labour demand to be concentrated in those local authority areas where labour demand is already relatively high, thereby prompting yet further increases in potential labour supply in these areas.
The twin processes of job creation and job destruction have different impacts over space. Hence, within any given territory at any one point in time, differences in, for example, activity rates and unemployment rates are inevitable. As has been noted in footnote five, for long, this type of outcome was a legitimate concern to Scottish (and English, Irish and Welsh) interests within the UK (Armstrong and Taylor, 2000: Brown, 1972: McCrone, 1969). It will continue to be a legitimate concern for, for example, local authorities within Scotland, irrespective of whether a devolved system of government operates or an independent nation state exists. However, to examine perceived spatial inequalities – or cohesion – requires that cognisance is made of a diverse range of social and economic indicators, not merely the labour market participation rate being used currently by the Scottish Government. Furthermore, there is need for some acknowledgement that often some intra-local authority area differences may be greater than many inter-local authority area differences.11
7.
CONCLUSIONS This paper has examined how the performance of the labour market might best
be monitored and evaluated. Using a ‘stocks’ perspective, four possible performance indicators have been identified viz. the activity rate; the employment rate; the unemployment rate; and the inactivity rate. To the extent that each of these indicators may offer a different perspective of performance, it is recommended that all be used for purposes of monitoring and evaluating.
11
That multiple indices for manifold geographies are required to examine spatial differences comprehensively is acknowledged by the Scottish Government in its attempt to construct Scottish Neighbourhood Statistics.
15
The paper then proceeded to apply these indicators to examine the performance of the labour market in Scotland, first over the period 1995 – 2005 and then, on a comparative inter-country (i.e. intra-UK) basis, for the 10 quarters 2005q3 – 2007q4. That there were often important gender differences when these four rates were disaggregated was one important feature of the examinations undertaken. Finally, use was made of two of these performance indicators (the activity rate and the unemployment rate) to examine the extent of economic disparities within Scotland and how this changed for the period 2005q3 – 2007q4.
These ‘stock’ based labour market performance indicators, however, even when suitably disaggregated, provide an incomplete picture of the operation of the labour market and its impact upon individuals who participate/do not participate within it. Hence, it is sometimes important to undertake further investigations of labour market transitions, for example of the rates at which individuals move from one labour market state to another and the individual probabilities of doing so.
However, the process of monitoring and evaluating the performance of the labour market is somewhat different from identifying a ‘target’ for the labour market, as the Scottish Government has chosen to do. Indeed, to the extent that what happens within the labour market is largely dependent upon what is happening in the economy as a whole, specifying a benchmark with which to appraise labour market performance is less than appropriate. A preferred approach would be to recognise the central importance of the labour market and its potential contribution to meeting the Scottish Government’s first target – indeed its over arching principal economic objective – of accelerating sustainable growth in GDP in Scotland, and to put in place a comprehensive system to monitor and evaluate the labour market to ensure that its full potential is realised.
16
REFERENCES Adams, J. and Thomas, R. (2007) Active Labour Market Policies in Scotland: Does it make a difference? International Journal of Manpower, Vol. 28, No. 1, pp 30 – 41. Armstrong, H. and Taylor, J. (2000) Regional Economics and Policy. Oxford: Blackwell Publishers. Beatty, C. and Fothergill, S. (2002) Hidden Unemployment Among Men: a case study. Regional Studies, Vol. 31, Issue No. 8, pp 811 -823. Beatty, C., Fothergill, S., Gore, T. and Powell, R. (2007) The Real Level of Unemployment 2007. Sheffield: Centre for Regional Economic and Social Research, Sheffield Hallam University. Bell, D. and Blanchflower, D.G. (2007) The Scots May Be Brave But They Are Neither Healthy Nor Happy. Scottish Journal of Political Economy, Vol. 54, No. 2, pp 166 -194. Brown, A.J. (1972) The Framework of Regional Economics in the United Kingdom. Cambridge: Cambridge University Press. Ermisch, J.F. and Wright, R.E (eds.) (2005) Changing Scotland: evidence from the British Household Panel Survey. Bristol: The Policy Press. Fothergill, S. and Wilson, I. (2007) A Million Off Incapacity Benefits: How achievable is Labour’s target? Cambridge Journal of Economics, Vol. 31, No. 6, pp 1007 -1023. Leitch Review of Skills (2006) Prosperity for All in the Global Economy: World Class Skills. Final Report. London: HM Treasury. Little, A. (2007) Inactivity and Labour Market Attachment in Britain. Scottish Journal of Political Economy, Vol. 54. No. 1, pp 19 -54. McCrone, G. (1969) Regional Policy in Britain. London: George Allen and Unwin. McQuaid, R., Brown, R. and Newlands (2008) Demographic Change and Economic Challenge: What future for Scotland and other small countries? Scottish Affairs, No. 64 (summer), pp 3 -17. McVicar, D. (2006) Why Do Disability Benefit Rolls Vary Between Regions? A review of the evidence from the USA and the UK. Regional Studies, Vol. 40, No. 3, pp 519–533.
17
Machin, A. (2004) A Comparison Between Unemployment and the Claimant Count. Labour Market Trends (February), pp 59 – 62. Scottish Government (2007) The Government Economic Strategy. Edinburgh: The Scottish Government. Star, J. (2002) Scotland’s Economy and Benchmarks. In Hood, N., Peat, J., Peters, E. and Young, S. (eds.) Scotland in a Global Economy. Basingstoke: Palgrave Macmillan. Stewart, M. The Inter-related Dynamics of Unemployment and Low-wage Employment. Journal of Applied Econometrics, Vol. 22, No. 2, pp 511 -531.
18
Table 1. Targets and Benchmarks of the Scottish Government Target
Short Term Objective
Long Term Aspiration
Growth
To raise Scotland’s GDP growth rate to the UK level by 2011
To match the GDP growth rate of the small independent EU countries by 2017
Productivity
To rank in the top quartile for productivity amongst our key trading partners in the OECD by 2017 To maintain Scotland’s position as the To close the gap with the top 5 OECD economies by 2017 top performing country in the UK To match average European (EU-15) population growth over the period from 2007 to 2017, supported by increased healthy life expectancy in Scotland over this period To increase overall income and the proportion of income earned by the three lowest income deciles as a group by 2017 To narrow the gap in participation between Scotland’s best and worst performing regions (i.e. Local Authority Areas) by 2017 To reduce (harmful) emissions over To reduce (harmful) emissions by 80 percent by 2050 the period to 2011
Labour Market Participation Population
Solidarity Cohesion Sustainability
Source: ‘The Government Economic Strategy’, section b, (Scottish Government, 2007).
19
30 26 Percentage
28
2400000 2350000
22
24
2300000 2250000
Total Number in Employment
2450000
Figure 1. The ‘Demand’ for Labour: Total Employment, 1995 -2005
1995 1996 1997 1998 1999 2000 2001 2002 2003 2004 2005 Year Total Number in Employment Percentage Part Time
Percentage Females
Source for figures 1 through to 6: Labour Force Survey, accessed via NOMIS
77.5 Percentage
4030000 4020000
77
4010000 4000000
Size of Population
4040000
78
4050000
Figure 2. The ‘Supply’ of Labour: Population Aged 16+, 1995 -2005
1995 1996 1997 1998 1999 2000 2001 2002 2003 2004 2005 Year Size of Population
Percentage of Working Age
20
70
Percentage 75 80
85
Figure 3. Activity Rates, 1995 -2005
1995
1996
1997
1998
1999
2000 Year
2001
People Females
2002
2003
2004
2005
Males
NB: The ‘rates’ referred to in Figures 3 through to 6 are for the population of working age.
65
Percentage 70 75
80
Figure 4. Employment Rates, 1995 -2005
1995
1996
1997
1998
1999
2000 Year
People Females
21
2001
2002 Males
2003
2004
2005
4
6
Percentage 8
10
12
Figure 5. Unemployment Rates, 1995 -2005
1995
1996
1997
1998
1999
2000 Year
2001
People Females
2002
2003
2004
2005
2003
2004
2005
Males
15
Percentage 20 25
30
Figure 6. Inactivity Rates, 1995 -2005
1995
1996
1997
1998
1999
2000 Year
People Females
22
2001
2002 Males
2005q3
35 Percentage 25
2550000
30
2600000
Number
40
45
2650000
Figure 7. The ‘Demand’ for Labour: Total Employment, 2005q3 – 2007q4
2006q1
2006q3 2007q1 Year and Quarter
Total Employment Percentage Part Time
2007q3
Percentage Female
Source for figures 7 through to 20: Annual Population Survey, accessed via NOMIS
2005q3
77.2 77.15
2006q1
2006q3 2007q1 Year and Quarter
Population aged 16+
2007q3
Percentage of Working Age
23
Percentage
77.1 77.05 77
Number
4060000 4080000 4100000 4120000 4140000 4160000
Figure 8. The ‘Supply’ of Labour: Population Aged 16+, 2005q3 – 2007q4
68
70
Percent 72
74
76
Figure 9. Activity Rates, People, 2005q3 – 2007q4
2005q3
2006q1
2006q3 2007q1 Year and Quarter
England Scotland
2007q3
Northern Ireland Wales
NB: the rates referred to in Figures 9 through to 20 are for the population of working age.
78
80
Percent
82
84
Figure 10. Activity Rates, Males, 2005q3 – 2007q4
2005q3
2006q1
2006q3 2007q1 Year and Quarter
England Scotland
Northern Ireland Wales
24
2007q3
66
68
Percent 70 72
74
76
Figure 11. Activity Rates, Females, 2005q3 – 2007q4
2005q3
2006q1
2006q3 2007q1 Year and Quarter
England Scotland
2007q3
Northern Ireland Wales
68
70
Percentage 72
74
76
Figure 12. Employment Rates, People, 2005q3 – 2007q4
2005q3
2006q1
2006q3 2007q1 Year and Quarter England Scotland
Northern Ireland Wales
25
2007q3
74
Percentage 76 78
80
Figure 13. Employment Rates, Males, 2005q3 – 2007q4
2005q3
2006q1
2006q3 2007q1 Year and Quarter England Scotland
2007q3
Northern Ireland Wales
60
Percentage 65 70
75
Figure 14. Employment Rates, Females, 2005q3 – 2007q4
2005q3
2006q1
2006q3 2007q1 Year and Quarter England Scotland
Northern Ireland Wales
26
2007q3
4
4.5
Percentage 5
5.5
6
Figure 15. Unemployment Rates, People, 2005q3 – 2007q4
2005q3
2006q1
2006q3 2007q1 Year and Quarter England Scotland
2007q3
Northern Ireland Wales
4.5
5
Percentage 5.5
6
6.5
Figure 16. Unemployment Rates, Males, 2005q3 – 2007q4
2005q3
2006q1
2006q3 2007q1 Year and Quarter England Scotland
Northern Ireland Wales
27
2007q3
3.5
4
Percentage 4.5
5
5.5
Figure 17. Unemployment Rates, Females, 2005q3 – 2007q4
2005q3
2006q1
2006q3 2007q1 Year and Quarter England Scotland
2007q3
Northern Ireland Wales
20
22
Percentage 24
26
28
Figure 18. Inactivity Rates, People, 2005q3 – 2007q4
2005q3
2006q1
2006q3 2007q1 Year and Quarter England Scotland
Northern Ireland Wales
28
2007q3
16
Percentage 18 20
22
Figure 19. Inactivity Rates, Males, 2005q3 – 2007q4
2005q3
2006q1
2006q3 2007q1 Year and Quarter England Scotland
2007q3
Northern Ireland Wales
24
26
Percentage 28 30
32
34
Figure 20. Inactivity Rates, Females, 2005q3 – 2007q4
2005q3
2006q1
2006q3 2007q1 Year and Quarter England Scotland
Northern Ireland Wales
29
2007q3
Table 2. Measuring Cohesion: Activity Rates, Working Age Population, 2005q3 – 2007q4
Maximum (Local Authority Area) Minimum (Local Authority Area) Range Median Mean Standard Deviation Coefficient of Variation
2005q3
2005q4
2006q1
2006q2
2006q3
2006q4
2007q1
2007q2
2007q3
2007q4
87.5 Shetland Islands 71.5 Glasgow City 16.0 80.6 80.2 3.4
88.2 Shetland Islands 72.1 Glasgow City 16.1 80.0 80.2 3.3
87.8 Shetland Islands 70.9 Glasgow City 16.9 80.8 80.6 3.5
88.6 Shetland Islands 69.6 Glasgow City 19.0 82.1 80.9 3.8
88.8 Shetland Islands 69.7 Glasgow City 19.1 81.6 81.9 3.6
89.5 Shetland Islands 70.1 Glasgow City 19.4 81.8 81.3 3.5
90.8 Shetland Islands 70.6 Glasgow City 20.2 81.3 81.2 3.5
89.2 Shetland Islands 71.2 Glasgow City 18.0 81.3 81.1 3.4
91.3 Shetland Islands 71.9 Glasgow City 19.4 81.7 81.1 3.4
89.6 Shetland Islands 71.7 Glasgow City 17.9 81.2 81.1 3.6
0.043
0.042
0.044
0.047
0.045
0.044
0.043
0.042
0.042
0.044
30
Table 3. Measuring Cohesion: Unemployment Rates, Working Age Population, 2005q3 – 2007q4 2005q3
2005q4
2006q1
2006q2
2006q3
2006q4
2007q1
2007q2
Maximum (Local Authority Area) Minimum (Local Authority Area)
8.6 Glasgow City 2.2 Orkney Islands
8.5 Glasgow City 2.1 Orkney Islands
9.1 Glasgow City 1.5 Orkney Islands
9.0 Glasgow City 1.3 Orkney Islands
8.8 North Ayrshire 3.0 Aberdeenshire
8.5 Glasgow City 2.2 Highlands
9.2 9.5 8.9 Inverclyde Inverclyde Inverclyde 2.0 Highlands
1.9 Scottish Borders
1.7 Scottish Borders
Range Median Mean Standard Deviation Coefficient of Variation
6.4 4.9 5.1 1.5
6.4 4.9 5.0 1.4
7.6 4.9 5.2 1.7
7.7 5.0 5.2 1.7
5.8 4.8 5.2 1.6
8.6 North Ayrshire 2.9 Argyll and Bute 5.7 5.1 5.1 1.5
6.3 4.7 5.0 1.5
7.2 4.6 4.9 1.7
7.7 4.5 4.8 1.8
7.2 4.5 4.7 1.7
0.304
0.279
0.337
0.331
0.299
0.285
0.305
0.345
0.377
0.368
NB: Statistics are not available for the Orkney Islands for the period 2006q3 – 2007q1.
31
2007q3
2007q4
2005q3
5
2550
10
Range
15
20
Total Employment (Nos in '000s) 2600 2650
Figure 21. Measures of Spread (1): The Range: Activity Rates and Unemployment Rates for Local Authority Areas Within Scotland, 2005q3 – 2007q4
2006q1
2006q3 2007q1 Year and Quarter
Total Employment Range: Unemployment Rates
2007q3
Range: Activity Rates
2550
1.5
2 2.5 3 3.5 Standard Deviation (SD)
4
Total Employment (Nos in '000s) 2600 2650
Figure 22. Measures of Spread (2): The Standard Deviation: Activity Rates and Unemployment Rates for Local Authority Areas Within Scotland, 2005q3 – 2007q4
2005q3
2006q1
2006q3 2007q1 Year and Quarter
Total Employment SD: Unemployment Rates
32
2007q3 SD: Activity Rates
2005q3
0
2550
.1 .2 .3 Coefficient of Variation (CV)
.4
Total Employment (Nos in '000s) 2600 2650
Figure 23. Measures of Spread (3): The Coefficient of Variation: Activity Rates and Unemployment Rates for Local Authority Areas Within Scotland, 2005q3 – 2007q4
2006q1
2006q3 2007q1 Year and Quarter
Total Employment CV: Unemployment Rates
33
2007q3 CV: Activity Rates