1992b) (loggers from Driesen & Kern GmbH, Am. Hasselt 25, D-24576 Bad Bramstedt, .... Penguins at Kmg George Island, Antarctica. Ecology 68. 351-361.
Vol. 106: 199-202.1994
MARINE ECOLOGY PROGRESS SERIES Mar. Ecol. Prog. Ser.
l
Published March 17
NOTE
Monitoring Antarctic environmental variables using penguins Rory P. W i l s o n ' , Boris M.
culikl,
Rudolph ~ a n n a s c hJochim ~, age^
'lnstitut Mr Meereskunde, Diisternbrooker Weg 20, D-24105 Kiel, Germany 'Technische Universitat Berlin. FG Bionik und Evolutionstechnik, Ackerstr. 71-76, D-13355 Berlin. Germany 3Cenlre d'Ecologie et Physiologie Energbtiques, Centre National de la Recherche Scientifique, 23, rue Becquerel. F-67087 Strasbourg, France
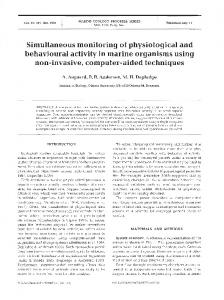
ABSTRACT: Water temperature and krill abundance in Maxwell Bay, Antarctica, were examined using Pygoscelid penguins carrying appropriate sensors linked to positiondetermining devices. Fifty-three forag~ngtrips from 49 penguins indicated that during December 1991 and January 1992 the temperature in the top 100 m of the water column was highest in the western section of the Bay which concurred with higher krill abundance as determined by a catch per unit effort index. This work demonstrates that abiotic and biotic features of the environment can be studied using animals to transport probes to the study site, provided information is given on the position of the animals when measurements are made.
KEY WORDS: Penguins . Environmental monitoring . Antarctica. Catch per unit effort. Krill . Water temperature
Assessment of marine biotic and abiotic features is often problematic for a variety of logistic, technological and financial reasons (Kerry & Hempel 1990). Because animals respond to environmental variability it has been suggested that they be used to monitor environmental change, particularly where conventional measuring techniques are difficult to implement (Furness & Nettleship 1991, Ancel et al. 1992). For example, breeding success of Antarctic penguins may be used to monitor krill abundance (Trivelpiece et al. 1990), something that has long been intractable to assess (Everson et al. 1990). This has, however, proved equivocal because other environmental factors are also important in determining breeding success (Trivelpiece et al. 1990, Furness & Nettleship 1991). In order to eliminate the need to interpret among multiple, complex interacting factors, animals should be used to monitor environmental variables directly. Q Inter-Research 1994
We used data loggers on breeding Pygoscelid penguins to measure water temperature as a function of locality and depth in Antarctica. In addition, we attempted to create a catch per unit effort index from foraging birds so as to derive estimates of krill abundance within that area. Materials and methods. Field work was carried out during December 1991 and January 1992 on 18 Adelie penguins Pygoscelis adeliae, 17 Chinstrap penguins l? antarctica and 14 Gentoo penguins l? papua breeding at Ardley Island (62" 13' S, 58" 55' W ) , Maxwell Bay, Antarctica. Birds were fitted with dorsally mounted loggers (Wilson & Wilson 1989) which recorded swim speed, swim heading, dive depth and water temperature every 10 or 15 S (Wilson et al. 1992b) (loggers from Driesen & Kern GmbH, Am Hasselt 25, D-24576 Bad Bramstedt, Germany). Devices were recovered after usually l , but sometimes 2, foraging trips. Foraging routes taken by the birds were determined by vectors using distance travelled and directional information (Wilson et al. 1991, 1992b): the point where each bird initially went into the water was taken as the start position. During subsequent swimming activity the speed and swim direction were ascertained over a defined time interval so as to calculate the displacement of the birds with respect to the start position, this displacement being further modified by changes in dive depth. The series of displacements taking place over the whole of the foraging period were then linked together to give the overall foraging track. The 3-dimensional positions of all water temperature measurements were derived from these foraging routes. These temperature measurements were characterized by north, east and depth co-ordinates and combined into 1 file. This file
Mar. Ecol. Prog. Ser. 106: 199-202, 1994
was used to produce a matrix for the water temperature as a function of depth within the foraging area used by the penguins. Area utilization by the birds was determined by summing the total time spent by all birds in each km2 of the foraging area. Prey capture rates were determined by using ingestible stomach temperature loggers (Wilson et al. 1992a) which were fed to the birds before the trip and recovered after the trip when they were regurgitated by the penguins as 'pellets' (cf. Duffy & Laurenson 1983) or via stomach pumping (Wilson 1984). The exact time of prey ingestion was recorded by marked drops in stomach temperature. The locations at which prey were captured was ascertained by reference to the temporal sequencing of the foraging routes. The amount of prey ingested at each locality was calculated by consideration of the degree of temperature drop and the time for which the stomach temperature remained below normal body temperatures (Wilson et al. 1992a, Gremillet & Plos in press). The total amount of prey caught in each km2 of the foraging area was summed and a catch per unit effort (CPUE) index determined by dividing the total catch km-' by the total time spent in that quadrant by the birds.
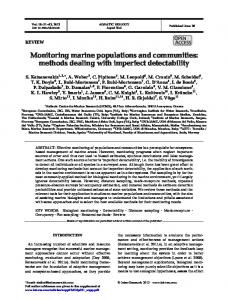
Results and discussion. Over 25 d we recorded a total of 53 foraging trips from all birds and ca 1300 h of stomach temperature. Penguins from all 3 species routinely dived to 100 m with trajectories slanted at a mean angle of 21" (SD = 13, for a subsample of 2659 dives analyzed) to the surface. The heading during each dive was maintained approximately constant at mean swim speeds of between 1.7 (SD = 0.6; Gentoos) and 2.4 m S-' (SD = 0.7; Chinstraps). Water temperature data were thus logged at positions determined by birds with both vertical and horizontal displacement over time. Reconstruction of the foraging routes by vectors demonstrated that birds foraged up to a maximum distance of 40 km from the island. The penguins visited all areas of Maxwell Bay u p to a radius of ca 9 km in a southeasterly direction from the island although most time was spent within a radius of 5 km (Fig. l a ) . Sea surface temperature within this area as monitored by the penguins was ca -0.5"C (Fig. 2), which concurred with satellite-derived data (NOAA satellite imagery from 19 Jan 1992), with lower temperatures occurring at greater depths (Fig. 2). In the east to southeast sector of the foraging area the change in temperature with depth was greater than in the
Fig. 1. (a) Percentage time spent in different areas of MaxweU Bay by foraging Pygoscelid penguins. Stippled area indicates percentage times in excess of 0.05 % km-'; contour lines indicate 1% increments. Crosses show breeding locations of Pygoscelid penguins. Rectangle shows the area represented in Fig. 2; arrows show the land masses indicated in black in Fig. 2 . (b) Catch (total mass of food ingested per sector) per unit effort (total time spent per sector) for Pygoscelid penguins foraging in the Maxwell Bay. Outer contour Lines show the 0.5 g h - ' km-' level and subsequent h e s indicate 10 g h - ' km-2 increments. Areas where catch per unit effort was > 50 g h - ' kmp2are stippled
Wilson: Monitoring uslng penguins
Ardley I. l
Fig. 2. (a) Bottom topography of the surveyed area of Maxwell Bay in relation to the position of the (b) -l.O°C and (c) -O.SoC isotherms a s determined by loggers attached to foraging Pygoscelid penguins. Note that the depth scale in (a) is half that in (b) and (c). Black areas indicate land masses (see Fig. l a ) . T h e perspective displayed is a view looking northwest toward Ardley Island u p the length of MaxweU Bay
201
western sector with the 1 "C isotherm occurring at ca 20 and 60 m respectively (Fig. 2). Pygoscelid penguins in this area consume almost exclusively knll Euphausia superba (Trivelpiece et al. 1987). This was also confirmed during our study by stomach pumping birds. The catch per unit effort index indicated that krill aggregation or overall abundance was highest in 3 major regions of the foraging area at distances of 0 to 3, 5 and 19 km from the breeding island in the more westerly sections of Maxwell Bay (Fig. l b ) where water temperature in the top 100 m of the water column was relatively high (Fig. 2). This area may be more desirable for knll because the higher temperature may enhance productivity in that region. High prey abundance around Ardley Island could explain why penguin colonies occur at this locality despite many other apparently suitable nesting habitats in this area (Fig. 1). The limited success of environmental monitoring programs to date is d u e to poorly resolved links between the variables studied and those intended to be monitored (Furness & Nettleship 1991). Examination of environmental abiotic parameters with vertebrates can be carried out effectively when the vertebrates transport appropriate sensors to the site to be measured and where the position of the measuring stations is known. This can be achieved either by telemetry (e.g. Jouventin & Weimerskirch 1990) or dead reckoning (Wilson et al. 1992b) as done here. Thus, as a consequence of recent advances in technology, it is now possible to use animals to monitor both biotic and abiotic parameters in environments where conventional monitoring technology is problematic. Such monitoring need not be limited to penguins. Other birds, as well as seals, could also be used in this regard. Here, the at-sea distribution, both horizontally and vertically, of the animal in question will play a central role in determining the animal's utility.
Acknowledyernents. This work was supported by the Deutsche Forschungsgemeinschaft, the Centre National d e la Recherche Scientifique and the European Economic Community. We a r e grateful to the Alfred Wegener Institute for help with satellite imagery a n d to U. Lentz and G . Dorn for technical advice as well a s to Verena S . a n d Mandy K for many days spent poring over vast amounts of data so a s to build appropriate matrices.
Mar. Ecol. Prog. Ser. 106: 199-202, 1994
LITERATURE CITED Ancel, A., Kooyman, G . L., Ponganis, P J , Gendner. J.-P., Llgnon, J., Mestre, X., Huin, N., Thorson, P. H . , Robisson, P,, Le Maho, Y (1992). Foraging behavlour of Emperor Penguins a s a resource detector in winter and summer. Nature 360: 336-338 Duffy, D. C., Laurenson, L. J B. (1983).Pellets of Cape Cormorants as indicators of diet. Condor 85: 305-307 Everson, I., Watkins, J. L., Bone, D. G., Foote, K. G. (1990). Implications of a new acoustic target strength for abundance estimates of Antarctic krill. Nature 345: 338-340 Furness, R. W., Nettleship, D. N. (conveners) (1991). Seabirds as monitors of changing marine environments. Acta XX Congressus Internationalis. New Zealand Ornithological Trust Board. Wellington. p. 2237-2280 Grermllet, D, Plos, A. (1994). On the use of stomach temperature recordings for the calculation of the daily food intake In cormorants. J . exp. Biol. In press Jouventin, P,, Welmerslurch, H. (1990) Satellite tracking of Wandering Albatrosses. Nature 343: 746-748 Kerry, K. R., Hempel, G. (eds) (1990) Antarctic ecosystems: ecological change and conservation. Springer-Verlag, Berlin Trivelpiece, W. Z., Trivelpiece, S. G., Volkrnan, N. J. (1987). Ecological segregation of Adelie, Gentoo, and Chinstrap This note was submitted to the editor
Penguins at Kmg George Island, Antarctica. Ecology 68 351-361 Trivelpiece, W. Z. Trivelpiece, S. G., Geupel. G. R., Kjelrnyr, J., Volkman, N. J . (1990).Adelie and Chinstrap Penguins: their potential as monitors of the southern ocean marine ecosystem. In: Kerry, K. R., Hempel, G. (eds.) Antarchc ecosystems: ecological change and conservation. Springer-Verlag, Berlin, p. 191-202 Wilson, R. P. (1984).An improved stomach pump for penguins and other seablrds. J . Field Ornithol. 55: 109-112 Wilson, R. P., Cooper, J., Plotz, J. (1992a). Can we determine when marine endotherms feed? A case study with seabirds. J. exp. Biol. 167: 267-275 Wilson, R. P., Culik, B. M., Bannasch, R.. Driesen, H. H. (1992b). Monitoring penguins at sea using data loggers. In: Paolo, M., Sando, F., Christina, G., Remo, B. (eds.)Proc. XI1 Int. Sym. Biotelemetry. Editrice Universitaria Lltografia Felici, Pisa, p. 205-214 Wilson, R. P., Wilson, M.-P. (1989). Tape: a package attachment technique for penguins. Wildl. Soc. Bull. 17: 77-79 Wilson, R. P., Wilson, M.-P., Link. R., Mempel, H., Adams, N. J. (1991). Determinatior. of movements of African Penguins Spheniscus demersus using a compass system: dead reckoning may be an alternative to telemetry. J. exp. Biol. 157: 557-564 Manuscript first received: October 12, 1993 Revised version accepted: January 12, 1994