Vol. 4: 223–237, 2013 doi: 10.3354/aei00084
AQUACULTURE ENVIRONMENT INTERACTIONS Aquacult Environ Interact
Published online October 31
OPEN ACCESS
Using physical environmental parameters and cage engineering design within GIS-based site suitability models for marine aquaculture Lynne Falconer, Donna-Claire Hunter, Philip C. Scott, Trevor C. Telfer, Lindsay G. Ross* Institute of Aquaculture, University of Stirling, Stirling FK9 4LA, UK
ABSTRACT: Defining the physical suitability of an area for marine cage fish farming is of great importance, as each cage type has its own engineering tolerance levels and is designed to cope with a certain range of environmental conditions. Currently, there are no definitive, objective methods used to evaluate the suitability of coastal and offshore sites with respect to the physical limits of the location and the engineering design of a specific cage type. This study developed models which incorporate physical environmental parameters and cage engineering design within a GIS (graphical information system) environment, providing a valuable decision support tool for farmers, regulators and policy makers. The Western Isles of Scotland, UK, were selected as a study area due to the wide range of coastal and offshore environments. In addition, we selected 4 cage types designed for different wave exposure conditions (sheltered, moderately exposed, exposed and offshore). The models have been developed for worst-case scenarios, such as maximum significant wave height, conditions which are often difficult to predict. As shown in this study, the models can be used to assess the risk of using the selected cage type in a certain area and to highlight specific locations for development. The results indicate there is scope for further expansion of the aquaculture industry in the Western Isles using cages designed for exposed and offshore conditions, whereas there is limited potential for new developments using cages designed for moderately exposed environments. This allows stakeholders to make a robust decision about what cage type to use and where to locate it. KEY WORDS: GIS modelling · Spatial planning · Site suitability · Marine cages · Aquaculture
INTRODUCTION The considerable recent expansion of fish farming, worldwide, will continue to develop in forthcoming decades to meet the increasing world demand for seafood (FAO 2012). Floating cages are a major production system which will make a significant contribution to satisfying this demand; however, this expansion has already attracted attention in terms of its potential impacts on the environment ranging from aesthetic impacts to direct impacts such as environmental pollution and effects on biodiversity. Opti*Corresponding author. Email:
[email protected]
mised location of cage farms requires consideration of a number of factors including environmental and infrastructural components (Ross et al. 2011, 2013) and visual impacts (Falconer et al. 2013). Defining the suitability of an area for cage-based fish farming in terms of the physical environment is of great importance, as each cage type has its own engineering tolerances which have been designed to cope with varying levels of weather and a particular range of hydrographic conditions, water depth, and anchorage stability. Ensuring that cages are sited appropriately based on these engineering tolerances © The authors 2013. Open Access under Creative Commons by Attribution Licence. Use, distribution and reproduction are unrestricted. Authors and original publication must be credited. Publisher: Inter-Research · www.int-res.com
224
Aquacult Environ Interact 4: 223–237, 2013
is fundamental for the sustainability of an operation, whilst also maintaining a high level of safety for operators and the environment. Failure of cages with subsequent loss of fish and equipment is a financial burden for the operator and has considerable environmental implications due to the potential interactions between escaped and wild fish. Jensen et al. (2010) assessed escapes of fish from Norwegian sea cage aquaculture and found that in the case of Atlantic salmon Salmo salar the main cause of escape was structural failure of the cage, with the highest incidents of large-scale escapes (defined as >10 000 fish) occurring during the autumnal months, when there are more frequent and intense coastal storms. Tools to assess the risk of cage failure and escapes within the context of coastal management for aquaculture are rare, and locations tend to be assessed on a relatively restricted spatial scale. The Environmental Impact Assessment (EIA) process is largely based on assessing localized areas for fish farm suitability or expansion (Telfer et al. 2009). Furthermore, regulatory instruments frequently concentrate on the assessment of nutrient carrying capacity within management areas and embayments (Gillibrand et al. 2002). Such carrying capacity is based largely on hydrodynamic characteristics and subsequent nutrient retention in defined areas, with little consideration given to the actual suitability of a given cage structure and its ability to withstand the physical environment. Currently, the European Union is encouraging changes to coastal marine management (Directive 2008/56/EC), and the Food and Aquaculture Organisation of the UN (FAO) are promoting the Ecosystem Approach to Aquaculture (Soto et al. 2008). Both initiatives advocate the establishment of a more integrated framework to protect the marine environment using spatial management tools and models at regional rather than local scale. Geographic information systems (GIS) provide a basis for such spatial modelling, which allows inclusion of a wide range of different locational data, including environmental, infrastructural and socio-economic, into a single decision support system (Nath et al. 2000). Through a logical combination of primary data and submodels, GIS allows integration of sophisticated analytical tools for multi-site aquaculture planning and management into an integrated coastal zone management plan aimed at developing organised and considered planning for sustainable development in coastal zones (Vallega 2001, Pérez et al. 2005, Ross et al. 2009).
Site selection and carrying capacity are crucial issues for aquaculture development (Ross et al. 2013). GIS has been used previously as a method of site selection for cage culture in a variety of locations including salmonid culture in a small coastal bay in Scotland (Ross et al. 1993), offshore cage culture in Tenerife (Pérez et al. 2005) and freshwater cage culture in a large reservoir in Mexico (Ross et al. 2011). Most studies focus on the environmental parameters and use general dimensions for hypothetical cage structures with only a few examples, such as Pérez et al. (2003a), including both environmental parameters and actual cage engineering tolerances in model development. This paper describes the development and use of a GIS-based model for marine cage site suitability incorporating data on currents, bathymetry and wave climate, while taking into account the technical specifications and engineering capabilities of 4 cage types designed for different environmental conditions: sheltered, moderately exposed, exposed and offshore. The model uses a multi-stage process where both Boolean and fuzzy classification techniques are used to produce an informative decision-making tool (Falconer et al. 2013). This allows large study areas to be evaluated from which smaller areas can be selected for more site-specific analysis. The Western Isles of Scotland are used as an example study site. This area is already a major salmonid production zone, and there is significant scope for industrial expansion here to deal with increasing consumer demand, thus creating a good climate for employment and ensuring long-term business opportunities (Scottish Government 2009). Whitmarsh & Palmieri (2009) evaluated public and stakeholder attitudes throughout Scotland and revealed a marked preference in favour of aquaculture expansion in the Western Isles. The model has been developed for worst-case conditions, such as maximum potential significant wave height, and can be used to assess the suitability of any study area for each type of cage.
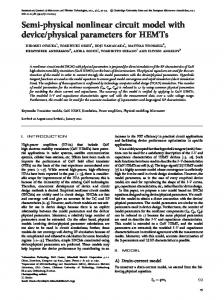
STUDY AREA The Western Isles, off the North West coast of Scotland, comprises 5 main islands, Lewis & Harris, North Uist, Benbecula, South Uist and Barra, and has a combined coastline length of 2103 km (Fig. 1). The archipelago has convoluted coastlines, ranging from open coasts exposed to the Atlantic Ocean in the West to sheltered shores in the East, presenting a wide range of different coastal environments within
Falconer et al.: GIS-based site suitability models for marine aquaculture
¬
w
is
bri
de
s
Le
225
r th
Ou
ter
He
No
Ha
r ris
South Harris
eL
Skye
South
Th
Uist
Benbecula
it t
le
Mi
nc
h
North Uist
Barra Se
a
of
th
e
H
r eb
id
es
20000 m
Fig. 1. The Western Isles off the North West coast of Scotland, UK. Latitude 57.60° N, longitude 7.10° W
a relatively small area. Within the isles there is a complex system of inlets ranging from deep narrow sealochs (fjords) to wide shallow bays, providing a large number of sites for sea-cage aquaculture.
MODEL COMPONENTS AND DEVELOPMENT Data preparation, processing and model development was conducted within IDRISI Selva GIS software (Clarks Labs), and prior to analysis all model components were converted to the UTM-29n georeference system at 30 m resolution. There are 4 stages in this model, each of which, in addition to the final output, can be used as an independent decision support tool (Fig. 2). The first stage was the development of 5 submodels: distance from the coast, maximum current velocity, depth, significant wave height, and substrate type. The second stage reclassified 4 of these submodels (distance from coast, maximum current velocity, depth and significant wave height) using a Boolean classification scheme in which suitable areas were classed as 1 and unsuitable areas were classed as 0. The reclassified layers were then multiplied together to produce a Boolean submodel which provided a ‘constraints’ layer indicating areas where no aquaculture activity would be possible.
Four of the submodels (maximum current velocity, depth, significant wave height and substrate type) were then reclassified using fuzzy set membership and combined by addition to produce a fuzzy suitability submodel. Data reclassification is a commonly used GIS technique which allows different parameters that were originally measured in different units to be compared on a similar scale and subsequently in a logical numerical model. Fuzzy sets are classes without hard boundaries where there is a gradual transition between membership and non-membership (Zadeh 1965, Eastman 2012). The fuzzy method of classification allows greater detail than the Boolean classification whilst accounting for the uncertainty that is associated with crisp, hard boundaries and environmental parameters (Eastman 2012). For the depth, wave height and current velocity parameters used in this study the sigmoidal (‘s-shaped’) fuzzy function was employed, as this was the most appropriate. Membership function type, membership function shape and control points were selected using the sea cage parameters, literature reviews and the opinion of aquaculture experts. In the fourth and final stage of the modelling process the constraints and fuzzy suitability submodels were multiplied together to produce the overall suitability model. This model approach was applied to each of the 4 cage types using rules based on their individual design parameters and technological specifications.
Aquacult Environ Interact 4: 223–237, 2013
226
(semi-exposed) and current flows. The C250 cages are currently used in Scotland for coastal trout, salmon and halibut ongrowing. The Kames Fish Farming Ltd Circular 315 fish cages (C315) are used for ongrowing in offshore environments and conditions highly exposed to significant wave action and current flows. The OceanSpar SeaStation is a semi-rigid fish cage which operates either floating or fully submerged and is used for offshore and open ocean aquaculture. Technical specifications and further information for each of the cage types are published by the manufacturers (Kames Fish Farming 2001, OceanSpar LLC 2013), and Table 1 shows their dimensions and maximum environmental threshold limits. As SeaStation design Fig. 2. Conceptual structure of the cage site suitability model for the can vary depending upon the operators Western Isles requirements, for this study information Sea-cage design parameters was used from an offshore SeaStation sea farm case study published by Loverich (2010). Different types of sea-cages are designed to withstand different levels of physical environmental stress, so operators choose a design appropriate to Distance from coast submodel the particular environment in which it will be sited. Four cage types were selected for this study based Accessibility is an important factor for any successupon their appropriateness for different environmenful aquaculture operation. The Western Isles already tal conditions (sheltered, moderately exposed, exposed have an extensive aquaculture and fishing industry and offshore). The Large Modular Square (LMS) with an associated infrastructure and logistics netcages manufactured by Kames Fish Farming Ltd are work, so this would be a suitable location for further designed for areas sheltered from wave action and aquaculture development. The ‘distance from coast’ with relatively slow current flow. These cages are submodel was only included within the Boolean currently used for salmon broodstock and ongrowing overlay, as company-specific economic and logistical in Scotland and the production of sea bream and sea analysis would be required to decide on cost effecbass in Greece. The Kames Fish Farming Ltd Circutive access points from the land (viz: where a comlar C250 (C250) fish cages are designed for ongrowpany already has facilities that could be used). To ing in conditions moderately exposed to wave action ensure that the model has general applicability for Table 1. Maximum threshold values for the 4 cage types evaluated Cage type
Environment designed for
Standard net depth (m)
Wave height (m)
LMS
Current Cubic speed (kn) capacity (m3)
Locations used
Source
Sheltered
10
1.5
1.4
144−625
Greece, Scotland
Kames Fish Farming (2001)
C250
Semi-exposed
10
3.5
1.6
800−700
Greece, Scotland
Kames Fish Farming (2001)
C315
Exposed
20
6
1.8
3000−17000
Chile
Kames Fish Farming (2001)
SeaStation
Offshore
Variable
9
1.3
600−6000
Hawaii, USA, Loverich (2010), Spain OceanSpar LLC (2013)
Falconer et al.: GIS-based site suitability models for marine aquaculture
any new sea cage development, a buffer was used from the coast to a maximum limit which could be achieved from almost any point on the mainland. Offshore aquaculture can be defined generally as farming systems located in exposed environments rather than sheltered coastal areas (Troell et al. 2009). While there is no universally adopted definition, distances in excess of 3 km were used in the present model to account for offshore conditions, and areas within 3 km were considered coastal. A maximum distance of 20 km from the mainland of the Western Isles was considered reasonable for siting offshore culture with most modern service vessels able to reach the furthest points within 40 to 60 min. The data were reclassified so that areas between 0 and 20 km from the coast were suitable for development, and areas beyond this limit were classified as unsuitable.
Maximum current velocity submodel High current velocity not only affects the physical structure of the cages through torsional forces on the netting, fatigue and fracture on couplings and welding points but also affects fish production and behaviour through deformation of nets, reduced oxygen supply or waste clearance, and even causes excessive forced swimming. Data availability on maximum current velocity was sparse, and therefore point data from the British Oceanographic Data Centre were collated and combined in a point vector file and interpolated to create a raster surface layer. This relatively simple hydrodynamic simulation approach, which has been used elsewhere (Wilkin et al. 2002), could be improved upon by incorporating complex hydrographic modelling tools such as Delft3D (Deltares
227
Systems). The resulting maximum current velocity layer was reclassified using the values shown in Table 2.
Depth submodel When siting sea-cages, sufficient depth must be allowed below the maximum net depth to allow for sufficient water flow and wide dispersion of waste over the seabed. Insufficient depth below the cages may also lead to detrimental feedback to fish from the waste material built up under the cage (Pérez et al. 2003b), and Beveridge (2004) recommends cages are at least 4 to 5 m above the sediment. On the other hand, water depth should not be such that mooring of the cage pontoon is too expensive, as cost increases with depth (Beveridge 2004). Deep waters may also lead to complications when trying to carry out maintenance of the cages (Gifford et al. 2002). Digital depth vector were sourced from the British Geographical Survey DigiBath250. A full bathymetric surface was interpolated from these data and then reclassified in terms of suitability for each cage type based on the criteria shown in Table 3.
Wave climate model The principal elements of a wave climate are wave height, wave period, and wave direction, all of which may contribute to cage damage, cause stress on structures and provide an unsafe environment for operators. Dawson et al. (2001) reported that the Western Isles coastline is relatively insensitive to changes in sea level and that the frequent occurrence of strong winds and large waves have more
Table 2. Current velocity (m s−1) reclassified in terms of suitability ranking for each cage design Cage type
Boolean Suitable Not suitable
Fuzzy Membership function Control points Type Shape a b c d
Source adapted from
LMS
0.025 −0.7
> 0.7
Sigmoidal Symmetric
0.025
0.1
0.7
0.7
Kames Fish Farming (2001), Beveridge (2004)
C250
0.025 −0.8
> 0.8
Sigmoidal Symmetric
0.025
0.1
0.8
0.8
Kames Fish Farming (2001), Beveridge (2004)
C315
0.025−0.9
> 0.9
Sigmoidal Symmetric
0.025
0.1
0.8
0.9
Kames Fish Farming (2001), Beveridge (2004), Benetti et al. (2010)
SeaStation
0.025−1.2
>1.2
Sigmoidal Symmetric
0.025
0.1
0.8
1.2
Beveridge (2004), Benetti et al. (2010), OceanSpar LLC (2013)
Aquacult Environ Interact 4: 223–237, 2013
228
Table 3. Water depth (m) reclassified in terms of suitability ranking for each cage design Cage type
Boolean Suitable Not suitable
Fuzzy Membership function Type Shape a
Control points b c d
Source adapted from
LMS
15−50
50
Sigmoidal
Symmetric
15
20
40
50
Kames Fish Farming (2001)
C250
15−50
50
Sigmoidal
Symmetric
15
20
40
50
Kames Fish Farming (2001)
C315
25−90
< 25 and > 90
Sigmoidal
Symmetric
25
40
60
90
Kames Fish Farming (2001), Benetti et al. (2010)
SeaStation
25−90
< 25 and > 90
Sigmoidal
Symmetric
25
40
89
90
OceanSpar LLC (2013), Benetti et al. (2010)
environmental significance. The sea state of both the exposed western (Atlantic coast) and more sheltered eastern (Sea of the Hebrides) coasts of the Western Isles is also sensitive to the North Atlantic Oscillation. The wave climate model in this study focuses on the maximum potential significant wave height. Although these conditions may occur infrequently, they can have a significant impact on cage culture, and a single event could result in damage to a cage system. This is important information which enables cage operators, regulators and insurers to evaluate the risk of placing a cage in a certain area. Although equations are available for calculation of significant wave periods, these were not used in this study, as there is insufficient information on the impact of wave period on cage structures. This is an area which requires further work in the field to test cage tolerance before it can be included in the model. The height of wind-generated waves is a function of wind speed and direction, fetch and water depth. Water depth affects wave generation, so that wave heights will be smaller and wave periods shorter in transitional or shallower water. The height of windgenerated waves may also be fetch-limited or duration-limited. Scott (2003) successfully used equations developed by the US Army Corps of Engineers (1984) within a GIS framework to predict the maximum height of waves for aquaculture developments in Sepetiba Bay, Brazil. In the present study, the updated equations provided by the US Army Corps of Engineers (2002) were used to develop a wave model. Two sets of equations are available, one for depths between 15 and 90 m and another for depths over 90 m. As most of the study area was within 15 to 90 m depth, this set of equations was used. However, if the model were to be applied to offshore culture in areas with greater depths, then the equations for
over 90 m should be used. Models of significant wave height (Hs, the average of the highest one-third of all waves in a time series), which can contribute to coastal zone management and site suitability assessment for aquaculture projects, were developed within the GIS.
Wind Wind data from 7 weather stations based throughout the Western Isles was supplied by the UK Meteorological Office. The data need to be expressed in terms of wind stress factor (UA) when used within the equations for wave height, and this was calculated for 8 directional sectors, each based in an arc centred on 45, 90, 135, 180, 225, 275, 315 and 360 degrees (true north). This adjusted wind speed accounts for the non-linear relationship between wind stress and wind speed (U ) and is used to reduce bias whilst providing a more reasonable method of using data where adequate measurements are not available (US Army Corps of Engineers 1984). The UA factor is given by the following equation: UA = 0.71 U 1.23
(1)
Fetch A fetch layer was created in IDRISI using the method developed by UNITAR (1995) and further refined by Scott (2003). Fetch is defined as ‘the extent of open water across which the wind blows’ (Bascom 1964, p. 44); a larger fetch therefore has a greater wave generating potential, as there is more opportunity to absorb energy from the wind (US Army Corps of Engineers 1984). The study area has a very ex-
Falconer et al.: GIS-based site suitability models for marine aquaculture
229
Table 4. Significant wave height (m) reclassified in terms of suitability ranking for each cage design Cage type
LMS C250 C315 SeaStation
Boolean Suitable Not suitable 0−1.5 0−3.5 0−6 0−9
>1.5 > 3.5 >6 >9
Fuzzy Membership function Type Shape Sigmoidal Sigmoidal Sigmoidal Sigmoidal
Monotonically decreasing Monotonically decreasing Monotonically decreasing Monotonically decreasing
posed west coast facing the North Atlantic, while the east coast is more sheltered with the middle of the archipelago being approximately 40 km (fetch) from the Isle of Skye. A macro model was implemented within IDRISI which first generated directional layers for 45, 90, 135, 180, 225, 270, 315 and 360 degrees. Fetch length was then calculated, producing a layer with incremental values in each subsequent pixel along the wind fetch path from the coastline which, unless there was intervening land, extended up to 1600 km, the limit of fetch impact across open water (Chanson 2004). Although it is unlikely that the wind would blow constantly over such a large distance, the model in this case study was developed for a worst-case scenario; therefore, the maximum potential fetch was used. This stage was computationally intensive and produced large files due to the calculations and extent of the area involved.
Significant wave height submodel (Hs) As with the fetch layer, a macro model was developed to implement the significant wave height equation (Eq. 2) used by US Army Corps of Engineers (1984, 2002) and Scott (2003). Once implemented, the wave layer outputs for each directional sector could be generated, requiring only updates of wind speed, depth and fetch input data layers and the final output layer name for each run.
Hs =
⎡ ⎛ 9.8D ⎞ UA2 ⋅ 0.283 tanh ⎢0.530 ⎜ 2 ⎟ ⎝ UA ⎠ ⎣
( ) ( )
⎧ 0.00565 9.82F 0.5 ⎫ ⎤ ⎪ ⎪ UA tanh ⋅ ⎨ ⎥ 0.75 ⎬ ⎤⎪ ⎦ ⎪⎩ tanh ⎡0.530 9.82D UA ⎣ ⎦⎭ 9.8
0.75
Source Control points a b c d 0 0 0 0
0 0 0 0
0 0 0 0
1.5 3.5 6 9
Kames Fish Farming (2001) Kames Fish Farming (2001) Kames Fish Farming (2001) Loverich (2010)
This layer, representing the average of the highest third of all waves in a time series (US Army Corps of Engineers 1984), was then reclassified for each cage type using the manufacturer’s recommendations (Table 4).
Substrate type submodel There is a ‘trade off’ between cost and risk when considering locating sea-cage farms. Cost of moorings at sites with rocky substrates may be problematic and expensive, although this can also be a sign of good current scour, thereby ensuring oxygen supply and reducing the risks of waste accumulation (Beveridge 2004). Substrate data were collected from the British Geological Survey (BGS), United Kingdom Digital Marine Atlas and EIA studies (Institute of Aquaculture, University of Stirling, unpubl.) and were digitized and reclassified using a 5 category sediment type profile based on those designed by BGS and focusing on European Nature Information System habitat classifications. It was assumed that cages could be located over all of the substrate types (with varying degrees of suitability), and therefore this submodel was only included in the fuzzy submodel and not the Boolean submodel. Since the substrate data are categorical rather than continuous, it was reclassified on a scale of 0 to 1 without using fuzzy set memberships as shown in Table 5.
Table 5. Substrate type, reclassified in terms of suitability ranking for all cages (adapted from Beveridge 2004)
(2)
where U A2 = (wind stress factor)2, tanh = hyperbolic tangent, UA = wind stress factor (m s−1), D = water depth (m) and F = fetch (m). The resulting 8 wave climate layers were combined using a maximum overlay function to produce a significant wave height model for the Western Isles.
Substrate type Mixed sediment Rock Mud and sandy mud Coarse sediment Sand and muddy sediment
Suitability 0.25 0.25 0.5 0.75 1
Aquacult Environ Interact 4: 223–237, 2013
230
RESULTS Boolean submodel The overall Boolean submodel is a multiplication of the individual distance, current, depth and significant wave height Boolean submodels (Figs. 3A–D) to create a submodel representing the constraints to cage development (Fig. 3E). The advantage of using a Boolean submodel is that areas where cages could not be located (constraints) are not included in further analysis, and therefore the overall result is representative of all factors. The individual submodels and the overall constraints submodel indicate that there are more opportunities for aquaculture development using the cages designed for exposed (C315) and offshore (SeaStation) environments than the moderately exposed (C250) and sheltered (LMS) cages. The main limiting factors for all cages are depth and Hs. The LMS cages are designed for sheltered areas, and the overall constraints submodel indicates that there are no suitable areas for safe deployment of these cages. There could be some potential for culture using these cages in inland lakes, although the present study focused only on coastal and offshore culture. Furthermore, due to the risk of Hs above the tolerance level, there are only limited areas that can be identified as suitable for use of the C250 cages, and these are in sheltered coastal fjords. There are areas along the west coast of the islands that are suitable for the C250 cages with respect to the distance from coast, maximum current velocity and depth; however, as this coast is exposed to the Atlantic Ocean, there is the risk of higher Hs. There are some areas closer to the coast where the Hs is within a suitable range for the C250 cages, but the water is not sufficiently deep to accommodate these cages. The individual submodels (Fig. 3A–D) for C315 cages indicate that there are potential areas that would be suitable to locate cages based on each of the parameters. However, the overall constraints submodel (Fig. 3E) shows significantly reduced areas indicating that there are only a few locations, generally along the east coast, for which use of the C315 cages could be considered. As with the other cage types, the Hs is the main limiting factor, and areas near the coast where there are smaller waves are too shallow for the cages. Additionally, there are stronger currents in the Minch, the expanse of water between the Western Isles and the Isle of Skye, which means that there are fewer areas suitable for C315 cages.
The cage with the greatest potential for use within the Western Isles coastal and offshore environment is the SeaStation, which is able to tolerate the maximum current conditions of the area (Fig. 3B) and can also withstand higher Hs (Fig. 3D) than the other 3 cage types. There are offshore areas along the west coast of the islands where the SeaStation could be deployed, particularly near the islands of Harris, the Uists, Benbecula and Barra. Furthermore, there is opportunity for use of the SeaStation cage along the northern coast of Lewis and some areas in the Minch. The main limiting factor in the Minch is depth, as it is deeper than 90 m and mooring systems will be more expensive. The SeaStation can operate as a submerged cage and therefore would be able to tolerate even higher Hs. However, surface operations still require access to the cage system, and consequently further fieldwork would be required to estimate the frequency and duration of maximum wave height.
Fuzzy submodel The fuzzy submodel (Fig. 4) is a result of adding the current, substrate type, depth and Hs fuzzy submodels together and has the advantage that it can show differential suitability within the range of tolerance. This is particularly useful for the SeaStation cages, which can tolerate a wider range of offshore conditions than the other 3 cage types, although some areas may be less suitable than others as shown in the maximum current velocity submodel (Fig. 4A). The fuzzy submodel for substrate type (Fig. 4B) indicates that the most suitable substrate types are found to the northwest coast of Lewis, where the dominant substrates are coarse sediment and sand and muddy sand. Most of the sediment around the southern section of the Western Isles (North and South Uist, Benbecula and Barra) is less suitable as it is rock, which would require more expensive mooring systems. As was shown in Fig. 3, the results of the fuzzy overlay indicate that the most limiting factors for all cage types are the depth (Fig. 4C) and Hs (Fig. 4D). The overall fuzzy submodel can be used to identify areas which are most or least suitable for development using each cage type. However, they should not be used to make a definitive decision unless combined with the constraints submodel to produce the final cage suitability model, as the overall fuzzy submodel is an intermediate outcome rather than a final result. Once combined with the overall constraints submodel, the model automatically disregards any
Falconer et al.: GIS-based site suitability models for marine aquaculture
231
Fig. 3. Individual Boolean submodels and overall Boolean constraints layer. (A) Distance to coast, (B) maximum current velocity, (C) depth, (D) significant wave height, (E) overall constraints model. Cage types: LMS, C250, C315, SeaStation
232
Aquacult Environ Interact 4: 223–237, 2013
Fig. 4. Individual fuzzy classification submodels and overall fuzzy submodel. Suitability for marine cage fish farming is assessed on a continuous scale: NS, not suitable; LS, low suitability; HS, high suitability. (A) Maximum current velocity, (B) substrate type, (C) depth, (D) significant wave height, (E) overall fuzzy model. Cage types: LMS, C250, C315, SeaStation
Falconer et al.: GIS-based site suitability models for marine aquaculture
area where one or more submodels indicate there should be no development and then uses the fuzzy submodel to assess the remaining areas as to their level of suitability.
Final cage site suitability models The final cage site suitability models indicate potential areas for the use of 3 out of the 4 cage types (Fig. 5). There are no suitable areas for LMS cages, which require sheltered environments; therefore, these cages would not be recommended for use in the coastal and offshore areas of the Western Isles. The C250 cages are suitable for semi-exposed areas, and the model indicates that Loch Roag in Western Lewis would be a highly suitable area for this cage (Fig. 5A). There are already cages of this type in use in this area. The Eastern coast of the Western Isles has some potential for the C315 cages, particularly in South Uist (Fig. 5B) and on the fragmented coastline of Lewis (Fig. 5C). There is significant potential for use of SeaStation cages throughout the Western Isles. As with the C315 cage, the most suitable areas are along the eastern coast of South Uist (Fig. 5D) and the east coast of Lewis (Fig. 5E). There is also an additional large area within the Minch between Lewis and Skye that has moderate suitability for SeaStation cages (Fig. 5E).
DISCUSSION Based on consideration of 4 cage types designed for varying environmental conditions, this work has shown how GIS-based models can be used to investigate the optimal location of floating cages in the marine environment, using the Western Isles of Scotland as a case study. Baxter et al. (2008) reviewed the status of Scottish seas and established a spatial baseline against which future marine and coastal policy can be measured and modelled. GESAMP (2001) noted that this type of spatial modelling approach was appropriate for locating aquaculture operations and was highly suited to maximizing sustainable economic return without environmental detriment, confirming the notion that the initial selection of the most appropriate sites will help prevent negative downstream effects on a farm’s success and ensure long-term sustainability and environmental resilience. Longdill et al. (2008) also highlighted that the most suitable and sustainable locations for aquacul-
233
ture development can be identified through targeted data collection programmes and the subsequent implementation of GIS based models. Aguilar-Manjarrez & Ross (1995) identified the positive benefits of spatial analysis, within a GIS framework, as an analytical and predictive tool for aquaculture, while Frankic (1998) highlighted the importance of developing an analytical framework that can incorporate spatial and temporal dimensions. The UK Crown Estate have also identified the need to approach the governance of the sensitive marine environment proactively and have introduced Marine Resource System (MaRS), a GIS decision support tool for identification of potential areas for sectoral development, which has been successfully applied to offshore wind farm development (Tudor & Norman 2011). The present study extends this further by showing how frameworks and polices can be applied to the process, through the development of a site suitability model for marine cage aquaculture, within a GIS framework, based on physical environmental data and engineering criteria for cages. The site suitability model efficiently assesses an area for the deployment of cages, avoiding the need for expensive and timeconsuming field evaluation. This allows detailed site scoping in areas which are already known to be suitable for cage aquaculture. Subsequent more detailed assessment would include location- and case-specific variables such as temperature, salinity, the use of materials and moorings and the potential impact on other stakeholders such as fishermen and ferry operators. GIS could also be used for this process, for example, to calculate the slope of the sea floor in order to assess the implications for mooring type (Bekkby et al. 2008a). The model developed uses available data within its calculations. This can be limiting, e.g. wave climate profiling may lack datasets for a given study area. However, with increased use of spatial tools and models for marine planning (Kapetsky & Aguilar-Manjarrez 2007) these limitations are likely to diminish as digital data sources improve. The overall model developed for this study has a number of components and submodels which, in themselves, are highly complex and can be used as independent assessment tools. Wave climate assessment is one example, as the relationships between wave exposure and species distribution or wave climate and coastal erosion have been acknowledged (Koukoulas et al. 2005, Bekkby et al. 2008b). Determining the likely wave climate risk of an area is a critical factor in coastal zone management and for development of any activity. A pilot study for aqua-
Fig. 5. Final site suitability models for each of the 4 cage types (LMS, C250, C315, SeaStation)
234 Aquacult Environ Interact 4: 223–237, 2013
Falconer et al.: GIS-based site suitability models for marine aquaculture
culture site optimization in Loch Roag, Scotland, highlighted that ‘adequate specification and siting of salmon farm installations in respect of hydrography in particular of wave climate’ should be taken into account (Tyrer & Bass 2005, p. 40). Whilst there is a well-established understanding of how wave height will impact aquaculture structures (Panchang et al. 2008), other wave climate factors such as wave period require further investigation in this respect. Pérez et al. (2003a) interpolated minimal available data obtained from fixed WANA points to develop a wave climate layer. The GIS-based wave climate model implemented within the GIS in this work is a significant step forward, bringing the present important factor into consideration for such regulatory risk processes as environmental impact assessment. Development of the current velocity submodel was problematic, as little specific data were available for the study area. Consequently, only maximum current flows were used for a limited number of locations within the study area, affecting the robustness of the results. However, as this factor affects a number of production and technological parameters (Beveridge 2004), its incorporation into the models, albeit in a limited form, was justified. In future, additional use of average current flow and relative length of time that areas were subject to quiescent waters (< 0.03 m s−1) would be a beneficial development as it provides information on oxygen delivery and waste clearance, though acquisition of these data would entail considerable field work. This study has clearly shown that, in this environment and based upon the physical characteristics of the areas available, there is greater scope for aquaculture development using cages designed for exposed and offshore locations such as the C315 and SeaStation cage types. Cages designed for more sheltered and moderately exposed environments have very little scope for further deployment in coastal and offshore environments, as suitable locations are limited and are in most cases already used for aquaculture production or other purposes. The study focussed on a worst-case scenario basis, i.e. modelling the maximum and extreme conditions such as significant wave height, which may not occur frequently but can have serious consequences if, or when, they do occur. The models developed here also provide quantitative suitability scores for each of the different cage technologies throughout the Western Isles. This enables fish farmers and environmental regulators to make decisions about the siting of cage culture at particular locations or alternatively to identify other locations with suitable characteris-
235
tics, and thus acceptable environmental risk, within the wider locality. This process is in marked contrast to the current EIA process of site selection, as it allows a proactive approach to ranking areas and developing options for sites instead of a simple ‘yes or no’ response to single site queries. Such a decision support tool is not only intended as a fixed engine for aquaculture regulation but is ideally suited for use at the exploratory, pre-developmental stages. Although this study has focused on cage farming for finfish aquaculture, the model could be easily adapted and applied to other types of aquaculture such as the culture of seaweeds and shellfish. Submerged longline technology was developed in Japan for use in deep water scallop culture and has since been used in the South Pacific to culture pearl oysters and even in New Zealand for mussel production in open ocean conditions with significant wave heights over 10 m (Cheney et al. 2010). The modelling approach used in the present study could be used to investigate further suitable areas for production. There are currently a range of GIS-based and nonGIS-based means for making decisions in relation to aquaculture sustainability, all of which consider different aspects important for the successful operation of aquaculture, including individually those for selecting suitable sites (Halide et al. 2009), optimization of production (Ferreira et al. 2009), determining waste impacts (Corner et al. 2006, Giles et al. 2009), disease monitoring (Li et al. 2009) and visual impact assessment (Falconer et al. 2013). The underlying strength of a GIS-based system is that it can be expanded to incorporate numerous submodels embracing the physical environment, ecology, economics and support facilities (Radiarta et al. 2008). A sufficiently realistic model, once implemented, calibrated and validated, can thus play a strong role in formulating or adapting a regulatory framework. (Rennie et al. 2009). This study has shown that, with suitable information which is structured in a spatial manner, GIS modeling can be used to select sites and appropriate technology for effective aquaculture production based on the physical environment which is suitable for use by both industry and environmental regulators for effective aquaculture management.
Acknowledgements. This work was part funded by a grant to T.C.T. and L.G.R. from the Scottish Aquaculture Research Forum. D.C.H. thanks Robert Smith for assistance with testing of wave climate macros.
Aquacult Environ Interact 4: 223–237, 2013
236
LITERATURE CITED
➤ Aguilar-Manjarrez J, Ross LG (1995) Geographical informa-
➤ ➤
➤
➤
➤
➤
➤
tion system (GIS) environmental models for aquaculture development in Sinaloa state, Mexico. Aquacult Int 3: 103−115 Bascom W (1964) Waves and beaches: the dynamics of the ocean surface. Doubleday, New York, NY Baxter JM, Boyd IL, Cox M, Cunningham L, Holmes P, Moffat CF (2008) Scotland’s seas: towards understanding their state. Fisheries Research Services, Aberdeen Bekkby T, Isachsen PE, Isæus M, Bekkestuen V (2008a) GIS modeling of wave exposure at the seabed: a depthattenuated wave exposure model. Mar Geod 31:117−127 Bekkby T, Nilsson HC, Olsgard F, Rygg B, Isachsen PE, Isæus M (2008b) Identifying soft sediments at sea using GIS-modelled predictor variables and sediment profile image (SPI) measured response variables. Estuar Coast Shelf Sci 79:631−636 Benetti DD, Benetti GI, Rivera JA, Sardenberg B, O’Hanlon B (2010) Site selection criteria for open ocean aquaculture. Mar Technol Soc J 44:22−35 Beveridge MCM (2004) Cage aquaculture, 3rd edn. Blackwell Press, Oxford Chanson H (2004) Environmental hydraulics of open channel flows. Elsevier Butterworth-Heinemann, Oxford Cheney D, Langan R, Heasman K, Friedman B, Davis J (2010) Shellfish culture in the open ocean: lessons learned for offshore expansion. Mar Technol Soc J 44: 55−67 Corner RA, Brooker A, Telfer TC, Ross LG (2006) A fully integrated GIS-based model of particulate waste distribution from marine fish-cage sites. Aquaculture 258: 299−311 Dawson AG, Smith DE, Dawson S (2001) Potential impacts of climate change on sea levels around Scotland. RSM No. 178. Scottish Natural Heritage, Perth, UK Directive 2008/56/EC (2008) Directive 2008/56/EC of the European Parliament and of the Council of 17 June 2008 establishing a framework for community action in the field of marine environmental policy. OJ L 164:19−40. Available at http://eur-lex.europa.eu/LexUriServ/LexUriServ.do?uri=OJ:L:2008:164:0019:0040:EN:PDF Eastman JR (2012) IDRISI Selva manual. Clarks Labs, Worcester, MA Falconer L, Hunter DC, Telfer TC, Ross LG (2013) Visual seascape and landscape analysis to support coastal aquaculture site selection. Land Use Policy 34:1−10 FAO (Food and Agriculture Organization of the United Nations) (2012) The state of world fisheries and aquaculture. FAO Fisheries and Aquaculture Department, FAO, Rome Ferreira JG, Sequeira A, Hawkins AJS, Newton A and others (2009) Analysis of coastal and offshore aquaculture: application of the FARM model to multiple systems and shellfish species. Aquaculture 289:32−41 Frankic A (1998) A framework for planning sustainable development in coastal regions: an island pilot project in Croatia. PhD Dissertation, Virginia Institute of Marine Science, College of William & Mary, Williamsburg, VA. Available at www.umb.edu/editor_uploads/images/ centers_institutes/center_governance_sustain/Frankic98. pdf GESAMP (IMO/FAO/UNESCO-IOC/WMO/IAEA/UN/UNEP Joint Group of Experts on the Scientific Aspects of
➤
➤
➤
➤
➤ ➤ ➤
➤ ➤
➤
➤
Marine Environmental Protection) (2001) Planning and management for sustainable coastal aquaculture development. GESAMP No. 68. GESAMP, Rome Gifford JA, Benetti DD, Rivera JA (2002) National marine aquaculture initiative: using GIS for offshore aquaculture siting in the U.S. Caribbean and Florida. Available at www.lib.noaa.gov/docaqua/reports_noaaresearch/ nmaifinalreportgis.pdf Giles H, Broekhuizen N, Bryan KR, Pilditch CA (2009) Modelling the dispersal of biodeposits from mussel farms: the importance of simulating biodeposit erosion and decay. Aquaculture 291:168−178 Gillibrand PA, Gubbins MJ, Greathead C, Davies IM (2002) Scottish executive locational guidelines for fish farming: predicted levels of nutrient enhancement and benthic impact. Scottish Fisheries Research Support No. 63/2002. Fisheries Research Services, Marine Laboratory, Aberdeen Halide H, Stigebrandt A, Rehbein M, McKinnon AD (2009) Developing a decision support system for sustainable cage aquaculture. Environ Model Softw 24:694−702 Jensen Ø, Dempster T, Thorstad EB, Uglem I, Fredheim A (2010) Escapes of fishes from Norwegian sea-cage aquaculture: causes, consequences and prevention. Aquacult Environ Interact 1:71−83 Kames Fish Farming (2001) Kames Fish Farming Equipment Ltd, fish and shellfish aquaculture systems, fish cages and work rafts. www.kames.co.uk (accessed 18 Feb 2013) Kapetsky JM, Aguilar-Manjarrez J (2007) Geographic information systems, remote sensing and mapping for the development and management of marine aquaculture. FAO Fisheries Tech Pap No. 458. FAO, Rome Koukoulas S, Nicholls RJ, Dickson ME, Walkden MJ and others (2005) A GIS tool for analysis and interpretation of coastal erosion model outputs (SCAPEGIS). In: Coastal dynamics 2005. Proc 5th Int Conf Coastal Dynamics American Society of Civil Engineers, Reston, VA Li N, Wang R, Zhang J, Fu Z, Zhang XS (2009) Developing a knowledge-based early warning system for fish disease/health via water quality management. Expert Syst Appl 36:6500−6511 Longdill PC, Healy TR, Black KP (2008) An integrated GIS approach for sustainable aquaculture management area site selection. Ocean Coast Manag 51:612−624 Loverich GF (2010) A case study of an offshore SeaStation sea farm. Mar Technol Soc J 44:36−46 Nath SS, Bolte JP, Ross LG, Aguilar-Manjarrez J (2000) Applications of geographical information systems (GIS) for spatial decision support in aquaculture. Aquacult Eng 23:233−278 OceanSpar LLC (2013) OceanSpar − offshore aquaculture, ocean engineering, fish pens and mooring solutions. www.oceanspar.com (accessed 18 Feb 2013) Panchang VG, Jeong C, Li D (2008) Wave climatology in coastal Maine for aquaculture and other applications. Estuaries Coasts 31:289−299 Pérez OM, Telfer TC, Ross LG (2003a) On the calculation of wave climate for offshore cage culture site selection: a case study in Tenerife (Canary Islands). Aquacult Eng 29:1−21 Pérez OM, Telfer TC, Ross LG (2003b) Use of GIS-based models for integrating and developing marine fish cages within the tourism industry in Tenerife (Canary Islands). Coast Manag 31:355−366 Pérez OM, Telfer TC, Ross LG (2005) Geographical informa-
Falconer et al.: GIS-based site suitability models for marine aquaculture
➤
➤ ➤
➤
tion systems-based models for offshore floating marine fish cage aquaculture site selection in Tenerife, Canary Islands. Aquacult Res 36:946−961 Radiarta IN, Saitoh SI, Miyazono A (2008) GIS-based multicriteria evaluation models for identifying suitable sites for Japanese scallop (Mizuhopecten yessoensis) aquaculture in Funka Bay, southwestern Hokkaido, Japan. Aquaculture 284:127−135 Rennie HG, White R, Brabyn L (2009) Developing a conceptual model of marine farming in New Zealand. Mar Policy 33:106−117 Ross LG, Mendoza QM, Beveridge MCM (1993) The application of geographic information systems to site selection for coastal aquaculture: an example based on salmonids cage culture. Aquaculture 112:165−178 Ross LG, Handisyde N, Nimmo DC (2009) Spatial decision support in aquaculture: the role of geographical information systems and remote sensing. In: Burnell G, Allan G (eds) New technologies in aquaculture. Woodhead Publishing, Cambridge, p 707−749 Ross LG, Falconer L, Campos Mendoza A, Martínez Palacios CA (2011) Spatial modelling for freshwater cage location in the Presa Adolfo Mateos Lopez (El Infiernillo), Michoacán, México. Aquacult Res 42:797−807 Ross LG, Telfer TC, Falconer L, Soto D, Aguilar-Manjarrez JA (2013) Site selection and carrying capacities for inland and coastal aquaculture. FAO Fish Aquacult Proc No. 21. FAO, Rome. Scott PC (2003) GIS and remote sensing-based models for development of aquaculture and fisheries in the coastal zone: a case study in Baia de Sepetiba, Brazil. PhD thesis, University of Stirling, Stirling Scottish Government (2009) A fresh start: the renewed strategic framework for Scottish aquaculture. Scottish Government, Edinburgh Soto D, Aguilar-Manjarrez J, Hishamunda N (2008) Building an ecosystem approach to aquaculture. FAO/Universitat de les Illes Balears Expert Workshop. 7−11 May 2007, Palma de Mallorca, Spain. FAO Fish Aquacult Proc No. 14. FAO, Rome Telfer TC, Atkin H, Corner RA (2009) Review of environEditorial responsibility: Pablo Sánchez Jerez, Alicante, Spain
➤
➤
237
mental impact assessment and monitoring in aquaculture in Europe and North America. In: FAO (ed) Environmental impact assessment and monitoring in aquaculture. FAO Fish Aquacult Tech Pap No. 527. FAO, Rome, p 285−394 Troell M, Joyce A, Chopin T, Neori A, Buschmann AH, Fang JG (2009) Ecological engineering in aquaculture − potential for integrated multi-trophic aquaculture (IMTA) in marine offshore systems. Aquaculture 297:1−9 Tudor D, Norman T (2011) Moving towards integrated marine policy and planning: the Crown Estate Marine Resource System (MaRS), Box 5.8. In: Kidd S, Plater A, Frid C (eds) The ecosystem approach to marine planning and management. Earthscan, Abingdon, p 183−185 Tyrer A, Bass N (2005) A proposed rationale for the ratification of the site optimisation plan for salmon farming in Loch Roag, Lewis, Western Isles. Fish Vet Group, Inverness. Available at http://scotland.gov.uk/Resource/ Doc/295194/0120318.pdf UNITAR (United Nations Institute for Training and Research) (1995) Applications in coastal zone research and management. In: St. Martin K (ed) Explorations in geographic information systems technology, Vol 3. UNITAR ILL, Geneva US Army Corps of Engineers (1984) Shore protection manual, Vol 1, 2, 3, 4th edn. US Army Engineer Waterways Experiment Station Coastal Engineering Research Center, Vicksburg, MI US Army Corps of Engineers (2002) Coastal engineering manual. Engineer manual 110-2-1100. US Army Corps of Engineers, Washington, DC Vallega A (2001) Focus on integrated coastal management — comparing perspectives. Ocean Coast Manag 44:119−134 Whitmarsh D, Palmieri MG (2009) Social acceptability of marine aquaculture: the use of survey-based methods for eliciting public and stakeholder preferences. Mar Pol 3: 452-457 Wilkin JL, Bowen MM, Emery WJ (2002) Mapping mesoscale currents by optimal interpolation of satellite radiometer and altimeter data. Ocean Dyn 52:95−103 Zadeh, LA (1965) Fuzzy sets. Inform control 8:338−353 Submitted: June 5, 2013; Accepted: September 17, 2013 Proofs received from author(s): October 23, 2013