AQUATIC BIOLOGY Aquat Biol
Vol. 16: 265–276, 2012 doi: 10.3354/ab00448
Published September 5
Monitoring attitude and dynamic acceleration of free-moving aquatic animals using a gyroscope Takuji Noda1,*, Junichi Okuyama1, Takuya Koizumi1, Nobuaki Arai1, Masato Kobayashi2 1
Graduate School of Informatics, Kyoto University, 606-8501 Kyoto, Japan Ishigaki Tropical Station, Seikai National Fisheries Research Institute, Fisheries Research Agency, 907-0451 Okinawa, Japan
2
ABSTRACT: A novel method (the ‘gyro method’) was developed to monitor the attitude and dynamic acceleration of free-moving aquatic animals with high precision and temporal resolution (100 Hz) using a new type of animal-attached data logger with a 3-axis gyroscope, a 3-axis accelerometer, and a 3-axis magnetometer. The gyro method was applied to green sea turtles Chelonia mydas in both tank and open-sea experiments, and the data for 2 types of activity (steady swimming and breathing) were compared to those obtained by a conventional method with only an accelerometer and a magnetometer, using low-pass filtering or running mean smoothing to determine gravity-based acceleration. Significant differences (mean ± SD: 0.034 ± 0.012 g and 1.964 ± 1.090° for steady swimming) were found in the reconstructed gravity-based acceleration and attitude between the gyro method and the conventional method. The gyro method reconstructed the fluctuation in attitude associated with the power stroke of the sea turtles, which was not documented by the conventional method. Additionally, the dynamic acceleration determined by the conventional method differed from the true dynamic acceleration, whereas the gyro method was able to reconstruct any attitude change (and therefore dynamic acceleration) without using the vague criteria involved with low-pass filtering or running mean smoothing in the conventional method. Hence, our new method will be useful for accurately measuring kinematics and movement performance involving complicated changes in motion, such as foraging for prey and escaping from predators, or the interactions of endangered species with fishing gear. KEY WORDS: Data logger · Gyroscope · Attitude · Dynamic acceleration · Kalman filter Resale or republication not permitted without written consent of the publisher
Animal-attached data loggers have been used for some time along with other telemetry methods to monitor the movements of aquatic animals in their natural environment (e.g. Cooke et al. 2004, Naito 2004, Ropert-Coudert & Wilson 2005). In particular, data loggers including a 3-axis accelerometer and occasionally a 3-axis magnetometer have been used to monitor the attitude and dynamic acceleration of aquatic animals (see Fig. 3) (e.g. Oliver 1995, Davis et al. 1999, Johnson & Tyack 2003, Mitani et al. 2003, Wilson et al. 2008). Such information can, in turn, be used to assess behavior (e.g. Yoda et al. 2001,
Kawabe et al. 2003, Shepard et al. 2008b, Whitney et al. 2010) and 3-dimensional trajectories (Mitani et al. 2003, Elkaim et al. 2006, Wilson et al. 2007, Shiomi et al. 2008). Using combined absolute dynamic acceleration values in the 3 axis directions, overall dynamic body acceleration (ODBA) has been calculated as a proxy for the energy expenditure of a large variety of animals in the field (e.g. Wilson et al. 2006, Halsey et al. 2009, Gleiss et al. 2010) based on the observation that ODBA is strongly correlated with the rate of oxygen consumption. Because the motion of a rigid body in 3-dimensional space can be described by 6 degrees of freedom (DoF) forces, composed of 3 components of attitude
*Email:
[email protected]
© Inter-Research 2012 · www.int-res.com
INTRODUCTION
266
Aquat Biol 16: 265–276, 2012
change (pitch, roll, and yaw) and 3 components of dynamic change (surge, sway, and heave), monitoring the attitude and dynamic acceleration means monitoring all 6 DoF forces acting on an animalattached data logger (see Fig. 2). However, it is impossible to precisely estimate attitude and dynamic acceleration using only an accelerometer and magnetometer because gravity-based acceleration and dynamic acceleration, which are both measured by an accelerometer, cannot be separated using only these sensors. Previous studies have determined the gravitybased acceleration component of accelerometer measurements by the frequency-based filtering method (e.g. Tanaka et al. 2001, Sato et al. 2003) or the running mean smoothing method (e.g. Wilson et al. 2006, Shepard et al. 2008a). The frequency-based filtering method assumes that lower frequency components of the power spectral density (PSD) correspond to changes in gravity-based acceleration, whereas higher frequency components correspond to changes in dynamic acceleration, and low-pass filtering is applied to extract gravity-based acceleration (Tanaka et al. 2001, Sato et al. 2003). Mean power stroke frequency has been adopted as a cut-off value for low-pass filtering to extract frequency components lower than the mean power stroke frequency (Tanaka et al. 2001, Sato et al. 2003). In the smoothing method, it is assumed that running mean acceleration, calculated by averaging the data on either side of a mid-point using equal weighting, corresponds to gravity-based acceleration, and that the remaining signals after smoothing acceleration can be subtracted from the raw acceleration to obtain the dynamic acceleration (Wilson et al. 2006, Shepard et al. 2008a). However, the arbitrary cut-off value for frequency-based filtering and the arbitrary running mean period for smoothing may result in some animal movements being overlooked. Shepard et al. (2008a) examined ODBA variability by smoothing with different running mean periods for a variety of species and modes of locomotion (flying, walking, and swimming), and established a robust method for determining the running mean period for the calculation of ODBA. However, that study was not based on true attitude and dynamic acceleration information for animals. Accurate attitude and dynamic acceleration data are important for assessing locomotor performance in aquatic animals. In particular, estimating the turning radius to evaluate maneuverability in a dead-reckoning system requires attitude information in addition to speed information. However,
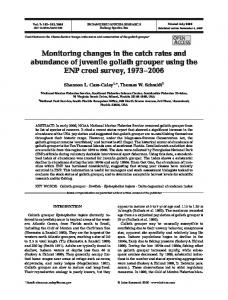
when attitude changes quickly, for example in a predator–prey context, a 3-dimensional trajectory estimation based on the conventional method might not be correct. This is because animals might display large attitude change and dynamic acceleration, but it is difficult to determine accurate gravitybased acceleration. Furthermore, misdeterminations of pitch and roll affect the yaw value in the conventional method (see Fig. 3) (Caruso 2000). Evaluating maximum dynamic acceleration also requires attitude information to remove the gravity-based acceleration from the accelerometer measurements. Therefore, a method that can precisely reconstruct the attitude and dynamic acceleration of aquatic animals would be useful. In other scientific domains, such as aerospace and medical engineering, 3-axis gyroscopes have been used to estimate the attitude and gravity-based acceleration of accelerometer measurements (e.g. Roumeliotis et al. 1999, Trawny & Roumeliotis 2005, Sabatini 2006, Fourati et al. 2009, Lee & Park 2009). A gyroscope is a sensor that measures angular velocity at high temporal resolution (e.g. 100 Hz to 1 kHz). The time-integration of the angular velocity measured by a gyroscope indicates attitude change. Therefore, if the initial attitude is known, any new attitude can be estimated using initial attitude and the estimated attitude change calculated from the gyroscope measurements. However, when the angular velocity of gyroscope measurements is time-integrated, errors arising from noise and drift of the gyroscope are also time-integrated, producing an error in attitude estimation of a few seconds (e.g. when assuming angular velocity, the estimation error is 0.1° for each measurement and sampling frequency is 100 Hz; thus, attitude estimation error can reach up to 100° in 10 s). Conversely, gravity-based acceleration and magnetic vectors change depending on change in attitude. Therefore, accelerometer and magnetometer measurements, which do not accumulate noise over time, can be used to compensate for attitude estimation errors associated with a gyroscope. Although angular velocity can be estimated using the temporal change in vector directions, determining attitude and angular velocity requires > 2 unit vectors because 1 unit vector has only 2 DoF, compared to attitude with 3 DoF (e.g. reviewed by Markley 1999). Thus, an accelerometer and a magnetometer have been used in addition to a gyroscope to determine initial attitude and to correct the error when estimating attitude associated with the accumulation of noise from a gyroscope (e.g. Roumeliotis et al. 1999, Trawny & Roumeliotis 2005, Sabatini
Noda et al.: Gyroscope for monitoring free-moving aquatic animals
2006, Fourati et al. 2009, Lee & Park 2009). Accordingly, it would be possible to monitor the attitude and dynamic acceleration of aquatic animals with higher precision and temporal resolution if all of these sensors are used. In terrestrial animals, Fourati et al. (2011) attached these sensors to a dog and were able to monitor attitude and dynamic acceleration changes that were not detected by the conventional method. However, because the physical environment of the ocean is different from that of the terrestrial environment, it is important to evaluate the effectiveness of a gyroscope for determining attitude and dynamic acceleration in aquatic animals. In the present study, we adopted a 3-axis gyroscope in addition to a 3-axis accelerometer and 3axis magnetometer to investigate the difference in attitude and dynamic acceleration estimates from those determined by the conventional method using only an accelerometer and magnetometer in freemoving green sea turtles Chelonia mydas. First, we developed a method for fusing the multiple sensor information to accurately estimate attitude and dynamic acceleration using an extended Kalman filter (EKF). Then, a data logger with a gyroscope, accelerometer, and magnetometer was attached to green sea turtles in captive and field experiments. Attitude and dynamic acceleration of green sea turtles were compared between the 2 methods. Both low-pass filtering and the running mean smoothing methods were examined in the conventional method.
267
and pressure-proof case (to 60 m depth, size: approx. 50 × 30 × 65 mm; weight in air: 115 g, including case and data logger).
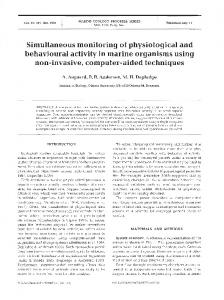
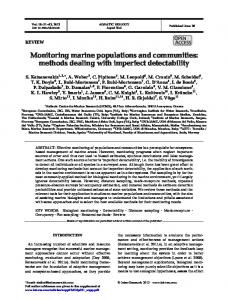
Method for reconstructing attitude and dynamic acceleration We applied the indirect-state Kalman filter according to Trawny & Roumeliotis (2005) and created a special program in MATLAB (Mathworks) to reconstruct the attitude and dynamic acceleration from the data obtained by the data logger. We named this system the ‘gyro method’ (Fig. 1). A stochastic modeling approach using an EKF was adopted to integrate the data from the 3 sensors. Attitude was represented in a quaternion form, instead of the Euler angle form, to avoid singularities (Titterton & Weston 2004). The state was represented as 3 vector components of the quaternion estimation error and 3 components of the gyroscope bias estimation error, and an updated error estimate was fed back to the EKF to correct its starting state for the next step calculation (for details see Trawny & Roumeliotis 2005). The estimated quaternion was then converted to Euler angles (for the equation, see Titterton & Weston 2004). Three coordinate systems were assumed: the Earth, the animal, and the data logger frame (Fig. 2). First, the attitude of the data logger in the Earth frame (pitch αD, roll βD, and yaw γD) was estimated
MATERIALS AND METHODS Data logger description Acceleration, magnetism, and angular velocity were recorded by a data logger (Logical Product) with a 3-axis gyroscope, a 3-axis accelerometer, and a 3-axis magnetometer to monitor the motions of free-moving green sea turtles. This data logger was rectangular in shape (40 × 20 × 55 mm) with a weight in air of 35 g including an AAA battery. The measurement range was ± 50 g for acceleration, ±1500° s−1 for angular velocity, and ±1 Gauss for magnetism, with a resolution of 12 bits (accuracy is 0.024 g for acceleration, 0.73° s−1 for angular velocity, and 0.49 mGauss for magnetism). This data logger can record all sensor outputs to an internal memory (32 MB) for about 3 h consecutively at 100 Hz. Because the data logger was not waterproof, it was covered with a custom-made rectangular waterproof
Fig. 1. Gyro method, using a 3-axis gyroscope, a conventional 3-axis accelerometer, and a 3-axis magnetometer, to reconstruct attitude (pitch, roll, and yaw) and dynamic acceleration (surge, sway, and heave). The algorithm was based on the indirect-state Kalman filter of Trawny & Roumeliotis (2005)
268
Aquat Biol 16: 265–276, 2012
using the gyro method. Then the attitude of the animal body (pitch αA, roll βA, and yaw γA) was estimated based on the estimated data logger attitude and the known attachment angle (pitch αB, roll βB, and yaw γB) of the data logger to the animal using the following equations: αA = αD – αB, βA = βD – βB, γA = γD – γB. The initial attitude of the data logger in the Earth frame was estimated using the conventional method (Fig. 3) (as described by Caruso 2000, Johnson & Tyack 2003, Shiomi et al. 2008) based on accelerometer and magnetometer measurements when the data logger was stationary. In the conventional method, magnetometer and acceleration measurements were also low-pass filtered or running mean smoothed to avoid a mismatched treatment of the acceleration and magnetism data, following Shiomi et al. (2010).
Accuracy of data logger for estimating attitude and dynamic acceleration
Fig. 2. Three frames (Earth frame, animal frame, and data logger frame) were assumed here. For the Earth frame, the north-east-down system (Titterton & Weston 2004) was adopted, and the coordinate origin was assumed to be fixed on the Earth’s surface. Attitude (pitch, αD; roll, βD; and yaw, γD) of the data logger in the Earth frame was determined using the gyro or conventional methods; the attitude (pitch, αA; roll, βA; and yaw, γA) of the animal body was then determined using the data logger attitude and the known attachment angle (pitch, αB; roll, βB; and yaw, γB) of the data logger
The data logger was attached to the spindle of a motor to test the accuracy of the data logger for attitude and dynamic acceleration estimation. The attitude estimate by the data logger was compared with known attitude changes caused by the motor, rotating at an equal speed (60° s−1) to complete 360° of rotation. Because the motor spindle rotates in only one direction, the attachment angle of the data logger to the motor spindle was changed during each trial so that changes in pitch, roll, and yaw were achieved. The accuracy of the attitude estimate was assessed by calculating the root mean square (RMS) (Triola 2005) of the difference between
the estimated attitude by the data logger and the known attitude by the motor. The RMSs of the difference for pitch, roll, and yaw were 0.658, 0.795, and 0.669°, respectively, indicating high accuracy of the attitude estimation. The accuracy of the dynamic acceleration was not tested because it was calculated using gravity-based acceleration, which was based on the attitude estimate. If the attitude was estimated accurately, then the dynamic acceleration estimate should also be accurate.
Fig. 3. Conventional method, using a 3-axis accelerometer and a 3-axis magnetometer, to reconstruct attitude (pitch, roll, and yaw) and dynamic acceleration (surge, sway, and heave). Frequency-based filtering or running mean smoothing methods were used to determine gravity-based acceleration, thereby isolating dynamic acceleration
Noda et al.: Gyroscope for monitoring free-moving aquatic animals
Deployment on aquatic animals The data logger was deployed on 3 juvenile green sea turtles (Turtles A, B, and C) from August 2 to September 14, 2010. Straight carapace lengths and body weights of the experimental turtles were 61.3 cm and 26.6 kg for Turtle A, 69.6 cm and 46.9 kg for Turtle B, and 63.0 cm and 43.2 kg for Turtle C, respectively. The data logger was attached to the center of the carapace of each turtle with epoxy bond to record the motion of the turtles in the longitudinal, transverse, and vertical directions (Fig. 2). Turtle A was allowed to swim freely in a tank (10 × 10 × 3 m) at the Ishigaki Tropical Station, Seikai National Fisheries Research Institute, Fisheries Research Agency of Japan. This deployment was replicated 4 times to obtain motion data for about 40 to 180 min; only 1 turtle was used because this species is endangered and thus the number of experimental turtles was limited. Each trial was conducted on different days. At the start of each trial, the data logger was attached to the turtle carapace and was recovered from the turtle after the experiment. Turtles B and C were released off the Aragusuku Islands of the Yaeyama Archipelago, Okinawa, Japan (24° 21’ N, 123° 95’ E). We succeeded in recovering the data logger from only 1 turtle (Turtle B) using a time-release system (Watanabe et al. 2004); the data logger was recovered 77 min after Turtle B was released into the ocean. In this system, the data logger automatically detaches from the turtle and floats to the sea surface at a predefined time. The data logger is then recovered using VHF transmitters and a Yagi antenna.
Data analysis Data obtained by the data loggers from Turtles A and B consisted of periods of steady swimming, resting, and breathing (defined as raising the head at the sea surface to breathe and then diving toward the sea bottom). We analyzed data obtained during steady swimming and breathing in both sea turtles. The resting period was omitted from the analysis because the gyro method had advantages over the conventional method when the turtles were moving. Data were analyzed using MATLAB and Igor Pro 6.22A (WaveMetrics). A consecutive 10 s period of steady swimming and a consecutive 10 s period of breathing were selected from the data of Turtle A, and 5 different periods for these behaviors on each experiment day were analyzed. A consecutive 10 s period was used for the steady swimming of Turtle A because
269
this turtle was not always swimming continuously for long periods in the captive environment. A consecutive 30 s period of steady swimming and a consecutive 10 s period of breathing were selected from the data of Turtle B, and 5 different periods for each behavior were analyzed. Attitude (°) and dynamic acceleration (g) of the sea turtles were determined both by the gyro and conventional methods. For the conventional method, both the frequency-based filtering method and the running mean smoothing method were used to determine the gravity-based acceleration. In the frequency-based filtering method, lowpass filtering was applied using mean power stroke frequency (Hz) as the cut-off frequency (Tanaka et al. 2001, Sato et al. 2003). Mean power stroke frequency was assumed to be the peak frequency in the PSD (g2 Hz–1)(see Fig. 6a,e). In the running mean smoothing method, a running mean period of 3 s was used following Shepard et al. (2008a). Although the dominant stroke period was > 3 s for Turtle A (mean ± SD: 0.26 ± 0.02 Hz mean power stroke frequency) and < 3 s for Turtle B (0.51 Hz mean power stroke frequency), the same running mean period (3 s) was used for both turtles for simplicity. Gravity-based acceleration and attitude were compared using the RMS of the difference between the gyro and conventional methods. A 1-sided 95% confidence interval (lower side value) of the RMS for the difference between the gyro and conventional methods was calculated, and the difference was significant if 0 was not included in the confidence interval. PSD was also calculated from the gravity-based acceleration determined by the gyro and conventional methods, and the raw acceleration in the longitudinal direction. Variation of the ODBA (g) depending on the period of the running mean (0 to 4 s) was compared with the ODBA obtained by the gyro method.
RESULTS Total deployment durations of the data loggers on the experimental turtles were 95, 38, 150, and 180 min for Turtle A, and 77 min for Turtle B (as noted in ‘Materials and methods’, we failed to recover the data logger from Turtle C). The calculated RMS showed significant differences (mean ± SD: 0.034 ± 0.012 g) in the gravity-based acceleration of steady swimming between the conventional and gyro methods in all directions (longitudinal, transverse, and vertical) in both the tank and open-sea experiments (Table 1, Fig. 4a,c). Significant differences (1.964 ± 1.090°) in the RMS of attitude (pitch,
Turtle B (field)
1
Turtle A (tank)
1
4
3
2
Trial type
Turtle ID
Breathing
Steady swimming
Breathing
Steady swimming
Breathing
Steady swimming
Breathing
Steady swimming
Breathing
Steady swimming
Behavior
4.446 (3.977) 4.010 (3.777) 10.905 (9.254)0 8.841 (6.845)
2.223 (1.717) 1.839 (1.297) 3.567 (2.764) 2.969 (1.881) 2.002 (1.500) 1.449 (0.955) 3.799 (2.933) 2.675 (1.934) 2.681 (2.106) 2.227 (1.799) 2.399 (1.617) 1.978 (1.531) 2.090 (1.357) 1.616 (0.825) 2.560 (2.355) 2.051 (1.751)
Pitch
1.892 (1.231) 1.801 (1.301) 3.503 (3.020) 2.637 (2.270)
1.512 (0.788) 1.329 (0.793) 3.870 (3.706) 3.001 (2.176) 1.070 (0.659) 0.930 (0.638) 2.700 (1.395) 2.337 (1.188) 1.588 (0.383) 1.315 (0.421) 2.171 (0.858) 2.117 (1.434) 1.372 (1.177) 1.082 (0.829) 2.113 (1.938) 1.713 (1.463)
Attitude (°) Roll
4.738 (3.430) 4.153 (2.920) 4.948 (2.344) 4.463 (1.963)
2.843 (2.004) 2.390 (1.934) 1.394 (0.616) 0.888 (0.461) 0.762 (0.359) 0.613 (0.360) 1.707 (0.919) 1.220 (0.765) 1.304 (1.016) 1.135 (0.450) 1.219 (0.580) 0.836 (0.394) 1.338 (0.511) 1.167 (0.445) 2.283 (1.711) 1.712 (0.996)
Yaw
0.076 (0.068) 0.068 (0.065) 0.115 (0.109) 0.084 (0.076)
0.039 (0.030) 0.032 (0.023) 0.059 (0.050) 0.049 (0.046) 0.035 (0.027) 0.025 (0.017) 0.064 (0.053) 0.046 (0.033) 0.041 (0.036) 0.038 (0.032) 0.049 (0.040) 0.045 (0.034) 0.036 (0.023) 0.028 (0.015) 0.049 (0.046) 0.036 (0.030) 0.038 (0.030) 0.037 (0.029) 0.043 (0.035) 0.038 (0.033)
0.027 (0.019) 0.028 (0.020) 0.047 (0.036) 0.037 (0.024) 0.023 (0.015) 0.020 (0.014) 0.034 (0.026) 0.031 (0.026) 0.028 (0.019) 0.025 (0.014) 0.038 (0.035) 0.041 (0.036) 0.028 (0.025) 0.023 (0.018) 0.035 (0.030) 0.031 (0.026)
0.045 (0.039) 0.041 (0.036) 0.063 (0.058) 0.053 (0.050)
0.029 (0.026) 0.030 (0.028) 0.045 (0.040) 0.042 (0.040) 0.031 (0.028) 0.033 (0.031) 0.052 (0.041) 0.040 (0.029) 0.036 (0.031) 0.035 (0.032) 0.043 (0.037) 0.041 (0.036) 0.031 (0.029) 0.023 (0.021) 0.043 (0.040) 0.033 (0.031)
Gravity-based acceleration (g) Longitudinal Transversal Vertical
Table 1. Chelonia mydas. Root mean square and 1-sided 95% confidence interval (lower side value; in parentheses) of the differences in the determined attitude (pitch, roll, and yaw) and gravity-based acceleration (longitudinal, transversal, and vertical directions) between the conventional and gyro methods for different behavior types (steady swimming and breathing). Upper values: gyro vs. smoothing method; lower values: gyro vs. low-pass method
270 Aquat Biol 16: 265–276, 2012
roll, yaw) were observed in steady swimming between the conventional and gyro methods (Table 1, Fig. 4b,d). Careful examination of the measurements obtained by the gyro method in both experiments revealed a small fluctuation concurrent in the gravity-based accelerations and attitude with the turtle’s power stroke (Fig. 4). Attitude fluctuations concurrent with the power stroke were also reflected in the raw angular velocity measured by the gyroscope (Fig. 5). Conversely, the conventional method (both low-pass filtering and running mean smoothing methods) removed these fluctuations in the gravity-based acceleration (Fig. 4). This was also apparent in the differences in the calculated PSD based on the gravity-based accelerations estimated by the gyro and conventional methods, and the raw acceleration in the longitudinal direction. The peak of the mean power stroke frequency, found in the PSD based on the gyro method and raw acceleration, was not apparent in the PSD based on low-pass filtering and smoothing (Fig. 6). The ratios of the intensity of mean power stroke frequency in the PSD of the gravity-based accelerations by the gyro method, low-pass filtering, and smoothing to the intensity of mean power stroke frequency in the PSD of the raw accelerations were 1.06 ± 0.100, 0.31 ± 0.24, and 0.10 ± 0.05 for Turtle A, and 1.01, 0.01, and 0.04 for Turtle B, respectively. The calculated RMS for the gravity-based acceleration and attitude between the conventional and gyro methods was larger during breathing (0.048 ± 0.017 g and 2.951 ± 2.146°, respectively) than during steady swimming (Table 1), although the difference was smaller in the low-pass filtering than in the smoothing (0.043 ± 0.013 g and 2.63 ± 1.950° for low-pass filtering, and 0.052 ± 0.020 g and 3.274 ± 2.350° for smoothing) (Table 1). A significant difference in the ODBA was observed between the gyro and conventional methods (p < 0.01, paired, 2-tailed t-test) for steady swimming and breathing (Turtles A and B) (Table 2). The running mean period at which the ODBA value was similar to that of the gyro method was < 0.1 s (Fig. 7).
DISCUSSION
We developed the gyro method to estimate attitude and dynamic acceleration of aquatic animals with high precision and temporal
Noda et al.: Gyroscope for monitoring free-moving aquatic animals
(b)
0.1
Turtle A
–5 –10
0.0 –0.1
Pitch ( °)
Transversal (g)
(a)
271
–0.2 –0.3
–15 –20
–0.4
Dynamic acceleration
Power stroke
–140
–0.1
–145
–0.2
Roll ( °)
Longitudinal (g)
–25 0.0
–0.3 –0.4
–150 –155
–0.5 –0.6
–160 295 290
1.1 1.0
Yaw ( °)
Vertical (g)
1.2
0.9 0.8
285 280
0.7 275 14:18:36
14:18:40
14:18:36
14:18:44
(d)
0.8
14:18:44
Turtle B
10 5
Pitch ( °)
0.7 0.6 0.5
0 –5 –10 –15
0.4
0.0
–20
Dynamic acceleration
–135
Power stroke
–140
Roll ( °)
Longitudinal (g)
Transversal (g)
(c)
14:18:40
Time of day (hh:mm:ss)
Time of day (hh:mm:ss)
–0.1 –0.2
–145 –150 –155
–0.3
–160 –0.4
–165 255 250
0.9
Yaw ( °)
Vertical (g)
1.0
0.8 0.7
245 240 235 230
0.6
225 0:12:50
0:12:55
0:13:00
Time of day (hh:mm:ss)
0:13:05
0:12:50
0:12:55
0:13:00
0:13:05
Time of day (hh:mm:ss)
Fig. 4. Chelonia mydas. A typical profile of (a,c) raw acceleration (dots) and gravity-based acceleration in the transverse, longitudinal, and vertical directions and the gyro method (black solid line); and (b,d) pitch, roll, and yaw, determined by the conventional method (low-pass filter: gray solid line, running mean smoothing: black broken line) and the gyro method (black solid line) during the period of steady swimming from data of (a,b) Turtle A and (c,d) Turtle B. Fluctuations were found in the gravitybased acceleration and attitude determined by the gyro method that were not found in the gravity-based acceleration and attitude determined by the conventional method. Subtraction of gravity-based acceleration from raw acceleration corresponded to dynamic acceleration
272
Aquat Biol 16: 265–276, 2012
Fig. 5. Chelonia mydas. Typical profiles of raw acceleration (Acc), magnetism (M), and angular velocity (ω), in the transverse, longitudinal, and vertical directions from the steady swimming data of Turtle B. Angular velocities and acceleration and magnetism fluctuated concurrently with the sea turtle’s power stroke
resolution using a gyroscope, a conventional accelerometer, and a magnetometer. We applied the system to free-moving green sea turtles (both in captivity and in the wild) to demonstrate its utility as well as the limitations of the conventional method. To the best of our knowledge, this is the first study to apply a gyroscope to aquatic animals. Attitude and dynamic acceleration of free-moving green sea turtles were determined both by conven-
Fig. 6. Chelonia mydas. A typical profile of the power spectral density calculated for (a,e) raw acceleration, (b,f) gravity-based acceleration determined by the gyro method, and gravity-based acceleration determined by the conventional method (c,g) with low-pass filtering and (d,h) running mean smoothing, in the longitudinal direction, from the data of (a−d) Turtle A and (e−f) Turtle B
tional and gyro methods. Assuming that accurate attitude changes would be obtained by the gyro method, the significant differences in the RMS of gravity-based acceleration and attitude between the gyro and conventional methods (0.034 ± 0.012 g and 1.964 ± 1.090° for steady swimming, and 0.048 ± 0.017 g and 2.951 ± 2.146° for breathing) indicate that the conventional method did not reconstruct the true attitude changes of the sea turtles. This, in turn, indicates that dynamic acceleration calculated by the conventional method was inaccurate because the calculation was based on the calculated attitude. Although these differences were not very large in the
Noda et al.: Gyroscope for monitoring free-moving aquatic animals
Table 2. Chelonia mydas. Overall dynamic body acceleration (ODBA) (mean ± SD) determined by the gyro and conventional methods (running mean smoothing and low-pass filter methods) for steady swimming (st. swimming) and breathing
273
pending on the types of animal movement and animal size, although this is not the focus of the present study. The advantage of using gyroscopes lies in their ability to clearly reconstruct Turtle Trial Behavior ODBA any attitude change (and therefore dyID type Gyro method Smoothing Low-pass namic acceleration), without using the Turtle A 1 St. swimming 0.086 ± 0.003 0.123 ± 0.004 0.120 ± 0.003 vague criteria involved with low-pass (tank) Breathing 0.089 ± 0.003 0.131 ± 0.002 0.123 ± 0.004 filtering and running mean smoothing. 2 St. swimming 0.079 ± 0.001 0.120 ± 0.004 0.118 ± 0.003 Gravity-based acceleration changed conBreathing 0.091 ± 0.003 0.136 ± 0.010 0.124 ± 0.007 currently with the power stroke of the 3 St. swimming 0.081 ± 0.004 0.127 ± 0.005 0.121 ± 0.004 turtles, as shown in the reconstructed Breathing 0.087 ± 0.002 0.131 ± 0.004 0.128 ± 0.003 attitude by the gyro method (Fig. 4) 4 St. swimming 0.078 ± 0.005 0.119 ± 0.005 0.114 ± 0.004 and the raw gyroscope measurements Breathing 0.088 ± 0.001 0.125 ± 0.004 0.118 ± 0.004 (Fig. 5) during steady swimming. Based Turtle B 1 St. swimming 0.086 ± 0.001 0.150 ± 0.009 0.141 ± 0.006 on our personal observations of sea tur(field) Breathing 0.105 ± 0.005 0.199 ± 0.004 0.169 ± 0.005 tle swimming, the attitude of sea turtles without data loggers also fluctuates concurrently with their power stroke. Therefore, the fluctuation in attitude was not caused by attaching the data logger. Applying low-pass filtering or running mean smoothing to accelerometer measurements has been commonly used to determine attitude changes in aquatic animals (e.g. Tanaka et al. 2001, Sato et al. 2003, Wilson et al. 2006, Shepard et al. 2008a). However, in the present study, both frequency-based filtering and running mean smoothing methods removed the fluctuations of Fig. 7. Chelonia mydas. A typical profile of overall dynamic body acceleration (ODBA) variability based on different running mean periods (0 to 4 s), calcugravity-based acceleration (and attilated from the acceleration of steady swimming (black broken line) and tude) concurrent with the power stroke breathing (black solid line) from the data of (a) Turtle A and (b) Turtle B (Fig. 4). The cut-off frequency for low-pass filtering was set at the mean experimental green sea turtles, the error of estimatpower stroke frequency, and thus changes in attitude ing true dynamic acceleration and attitude depends at frequencies higher than the mean power stroke freon the types of animal movement (i.e. steady or unquency were overlooked. For the running mean steady locomotion) and the size of animal (i.e. large smoothing method, a running mean period of 3 s was or small organisms). For example, during unsteady probably still too large to sample the attitude change locomotion such as fast-start movement in fish (e.g. concurrent with the power stroke of the experimental Domenici & Blake 1997), the error of estimating true sea turtles, which showed a power stroke frequency dynamic acceleration and attitude by the convenrange of 0.3 to 0.5 Hz. The larger difference in the tional method will become larger because the attiRMS of attitude and gravity-based acceleration betude change is much faster than during steady locotween the gyro method and the conventional method motion. Larger animals such as whales generally for breathing than for steady swimming may have exhibit relatively small rates of attitude change combeen due to the larger change in attitude during pared to smaller animals such as penguins (e.g. Fish breathing. Although low-pass filtering using a mean 1999), thus showing smaller errors when estimating power stroke frequency as the cut-off frequency was dynamic acceleration and attitude with the convenbetter than smoothing using a 3 s running mean tional method. Note that sampling frequency of period for following the change in attitude during measuring movements should also be an important breathing, the result depends on the cut-off frequency parameter for estimating accurate movement deand running mean period chosen (see Fig. 7 for the
274
Aquat Biol 16: 265–276, 2012
variability in ODBA values with different running mean periods). Although it would be possible to estimate most attitude changes if the cut-off frequency of the low-pass filter and the running mean period are tuned correctly, the criteria for selecting these values are vague, and it is very difficult to set the correct value without true attitude change information. Additionally, filtering and smoothing are usually applied to all acceleration data with a fixed cut-off value or a running mean period, and thus attitude changes can be underestimated or overestimated depending on animal movement. ODBA was significantly different between the conventional and gyro methods. This may be because it was impossible to determine accurate gravity-based acceleration by the conventional method, whereas the gyro method more accurately estimated gravitybased acceleration. In the present study, the running mean period at which the ODBA value was similar to that of the gyro method was < 0.1 s; this differs from previously used values (1 to 3 s) (e.g. Wilson et al. 2006, Shepard et al. 2008b). Although ODBA is a very powerful and easy method to estimate energy expenditure in the field, this result suggests that the dynamic acceleration defined in previous studies in a power stroke context does not reflect the true moving acceleration in a physical sense because the gravitybased acceleration change concurrent with the power stroke was overlooked in the experimental sea turtles in this study. However, because ODBA is a relative proxy for oxygen consumption (e.g. Wilson et al. 2006, Halsey et al. 2009, Gleiss et al. 2010), misdetermining dynamic acceleration by neglecting gravity-based acceleration concurrent with the power stoke probably has little effect on the relationship, as long as the movement is steady and the same criteria for filtering or smoothing are used. However, if the movement is not steady, the error in the dynamic acceleration estimate will be larger, and the relationship between muscle biochemistry and ODBA might be also different (Gleiss et al. 2011). Behaviors such as foraging and escape often require rapid changes in motion (e.g. Harper 1991, Domenici & Blake 1997, Domenici et al. 2004, Maresh et al. 2004, Cheneval et al. 2007), which should involve rapid changes in attitude and dynamic acceleration. Although the kinematics of foraging and escape in fish and mammals have been widely studied (e.g. Harper 1991, Domenici & Blake 1997, Domenici et al. 2004, Maresh et al. 2004, Cheneval et al. 2007), evaluations of such behaviors have been mostly limited to laboratory studies using high-speed cameras. Studies measuring escaping and foraging
performances in the field are scarce, particularly on a 3-dimensional scale. This scarcity is partly attributable to the difficulty of implementing high-speed camera systems in the field. Measuring movement in the field will reveal how the performance capacity of animals is utilized in nature, providing important insight into how performance is related to fitness (e.g. Irschick 2003, Domenici et al. 2007). In a laboratorybased setting, maximum acceleration, turning radius, and movement direction during foraging and escape have been important parameters for evaluating the performance of movement (e.g. Harper 1991, Domenici & Blake 1997, Domenici et al. 2004, Maresh et al. 2004, Cheneval et al. 2007). Measuring such parameters during foraging and escape using animalattached data logging systems requires dynamic acceleration and attitude information in addition to speed information; however, the conventional method using only an accelerometer and magnetometer cannot determine accurate gravity-based acceleration. Because the accuracy of the gravity-based acceleration (hence pitch and roll) estimate affects the accuracy of the yaw estimate in the conventional method (our Fig. 3; Caruso 2000), attitude and dynamic acceleration measurements by the conventional method might be underestimated or overestimated depending on the values used for low-pass filtering or running mean smoothing. If the error of estimating attitude and acceleration is a consistent underestimate or overestimate in the unsteady movements, the trend of error will be the same. However, the error trend might be different depending on the types of movement, and the true value is needed to establish a link between the error trend and the true value in different types of movement, while some behavior will be difficult to measure in the laboratory. Thus, applying the gyro method will be most effective for monitoring the kinematics of such behavior (e.g. maximum acceleration, turning radius, and movement direction) in the field because the gyro method estimates more precise attitude and dynamic acceleration at high temporal resolution in 3-dimensional space. Angular velocity measured by the gyroscope itself is also an important parameter to evaluate the performance of movements. Furthermore, other complicated motions in the aquatic environment, such as interactions of endangered species with fishing gear, can be monitored using the gyro method. Although the gyro method determines attitude and dynamic acceleration more accurately than the conventional method, it has limitations in terms of battery, data storage (memory), and size of the data logger compared to a data logger with only an
Noda et al.: Gyroscope for monitoring free-moving aquatic animals
accelerometer and magnetometer. Incorporating more sensors requires more battery consumption and space. If the battery is larger, the recording duration increases as long as there is enough memory, but the larger size of the data logger limits the animals to which it can be applied to relatively large animals. Small-sized memory cards with large data storage (e.g. 16, 32, 64, or 128 GB micro-SDHC or microSDXC card) are readily available and can generally accommodate the number of data points obtained by sensors (e.g. with 9 channel sensor outputs, each channel represents numerical values using 4 bytes after digital conversion; if data are recorded with 100 Hz sampling frequency for 1 d, at least 0.29 GB is required in the case of binary). Thus, the bottleneck is more likely to be energy efficiency and battery and sensor size than storage capacity. Therefore, although future technology may allow the use of lower power and smaller-sized sensors as well as more energy-efficient batteries, the current use of a gyroscope in animal-attached data logging system studies will be mostly limited to biomechanics studies that require a relatively short recording duration. Multi-schedule systems (e.g. 2 h of recording per day for multiple days) will increase the total recording days despite the short recording period each time; hence, they could be used for sampling long-term kinematics and behavior in aquatic animals.
approach to ecology. Trends Ecol Evol 19:334−343
➤ Davis RW, Fuiman LA, Williams TM, Collier SO and others ➤
➤ ➤
➤
➤
➤ Acknowledgements. We thank 3 anonymous referees, whose comments greatly improved this manuscript. We thank H. Kamihata (Graduate School of Informatics, Kyoto University) and K. Watajima (Department of Fisheries, Kinki University) for the experiment help. We also thank all the staff of the Ishigaki Tropical Station, Seikai National Fisheries Research Institute for the research help. This research was supported by the Research Fellow of the Japan Society for the Promotion of Science, Grant-in-Aid for Young Scientists B (to J.O., no. 22710236), and the GCOE program ‘Informatics Education and Research Center for Knowledge-Circulating Society’. All experiments were conducted in accordance with Kyoto University animal care guidelines for the experimental use of animals (www.anim.med.kyoto-u.ac.jp/ARCKU/ forms/text.pdf) (Informatics, no. 22-4). Green sea turtles were captured under the special permission of catching sea turtles of Okinawa Prefecture (no. 22-3). LITERATURE CITED
➤
➤ ➤ ➤
➤
➤ Caruso MJ (2000) Applications of magnetic sensors for low ➤ ➤
cost compass systems. Position Location Navig Symp IEEE 2000:177−184 Cheneval O, Blake RW, Trites AW, Chan KHS (2007) Turning maneuvers in Steller sea lions (Eumatopias jubatus). Mar Mamm Sci 23:94−109 Cooke SJ, Hinch SG, Wikelski M, Andrews RD, Kuchel LJ, Wolcott TG, Butler PJ (2004) Biotelemetry: a mechanistic
275
➤
(1999) Hunting behavior of a marine mammal beneath the Antarctic fast ice. Science 283:993−996 Domenici P, Blake R (1997) The kinematics and performance of fish fast-start swimming. J Exp Biol 200:1165−1178 Domenici P, Claireaux G, McKenzie DJ (2007) Environmental constraints upon locomotion and predator−prey interactions in aquatic organisms: an introduction. Philos Trans R Soc B 362:1929−1936 Domenici P, Standen EM, Levine RP (2004) Escape manoeuvres in the spiny dogfish (Squalus acanthias). J Exp Biol 207:2339−2349 Elkaim G, Decker E, Oliver G, Wright B (2006) Marine mammal marker (MAMMARK) dead reckoning sensor for in-situ environmental monitoring. Position Location Navig Symp IEEE/ION 2006:976−987 Fish FE (1999) Performance constraints on the maneuverability of flexible biological systems. Proc 11th Int Symp Unmanned Untethered Submersible Technol Autonomous Undersea Systems Institute, Durham, NH, p 394−406 Fourati H, Manamanni N, Afilal L, Handrich Y (2009) Sensor-based data fusion solution design for 3D motion estimation with application in bio-logging. Int J Sci Tech Automatic Control Comput Eng 3:1012−1031 Fourati H, Manamanni N, Afilal L, Handrich Y (2011) Posture and body acceleration tracking by inertial and magnetic sensing: application in behavioral analysis of free-ranging animals. Biomed Signal Process Control 6: 94−104 Gleiss AC, Dale JJ, Holland KN, Wilson RP (2010) Accelerating estimates of activity-specific metabolic rate in fishes: testing the applicability of acceleration data-loggers. J Exp Mar Biol Ecol 385:85−91 Gleiss AC, Wilson RP, Shepard ELC (2011) Making overall dynamic body acceleration work: on the theory of acceleration as a proxy for energy expenditure. Methods Ecol Evol 2:23−33 Halsey LG, Green JA, Wilson RP, Frappell PB (2009) Accelerometry to estimate energy expenditure during activity: best practice with data loggers. Physiol Biochem Zool 82:396−404 Harper DG (1991) Prey capture and the fast-start performance of northern pike Esox lucius. J Exp Biol 155:175−192 Irschick DJ (2003) Measuring performance in nature: implications for studies of fitness within populations. Integr Comp Biol 43:396−407 Johnson MP, Tyack PL (2003) A digital acoustic recording tag for measuring the response of wild marine mammals to sound. IEEE J Ocean Eng 28:3−12 Kawabe R, Nashimoto K, Hiraishi T, Naito Y, Sato K (2003) A new device for monitoring the activity of freely swimming flatfish, Japanese flounder Paralichthys olivaceus. Fish Sci 69:3−10 Lee JK, Park EJ (2009) A fast quaternion-based orientation optimizer via virtual rotation for human motion tracking. IEEE Trans Biomed Eng 56:1574−1582 Maresh JL, Fish FE, Nowacek DP, Nowacek SM, Wells RS (2004) High performance turning capabilities during foraging by bottlenose dolphins (Tursiops truncates). Mar Mamm Sci 20:498−509 Markley L (1999) Attitude determination using two vector measurements. NASA Conf Publ NASA/CP-19989209235, p 39–52
276
➤ ➤ ➤ ➤
➤ ➤ ➤
➤
Aquat Biol 16: 265–276, 2012
Mitani Y, Sato K, Ito S, Cameron MF, Siniff DB, Naito Y (2003) A method for reconstructing three-dimensional dive profiles of marine mammals using geomagnetic intensity data: results from two lactating Weddell seals. Polar Biol 26:311−317 Naito Y (2004) Bio-logging science. Mem Natl Inst Polar Res 58:118−132 Oliver GW (1995) Visualizing the tracking and diving behavior of marine mammals: a case study. Proc 6th Conf Visualization 95:397−399 Ropert-Coudert Y, Wilson RP (2005) Trends and perspectives in animal-attached remote sensing. Front Ecol Environ 3:437−444 Roumeliotis SI, Sukhatme GS, Bekey GA (1999) Smoother based 3D attitude estimation for mobile robot localization. IEEE Int Conf Robot 3:1979−1986 Sabatini AM (2006) Quaternion-based extended Kalman filter for determining orientation by inertial and magnetic sensing. IEEE Trans Biomed Eng 53:1346−1355 Sato K, Mitani Y, Cameron MF, Siniff DB, Naito Y (2003) Factors affecting stroking patterns and body angle in diving Weddell seals under natural conditions. J Exp Biol 206:1461−1470 Shepard ELC, Wilson RP, Halsey LG, Quintana F and others (2008a) Derivation of body motion via appropriate smoothing of acceleration data. Aquat Biol 4:235−241 Shepard ELC, Wilson RP, Quintana F, Gomez LA and others (2008b) Identification of animal movement patterns using tri-axial accelerometry. Endang Species Res 10:47−60 Shiomi S, Sato K, Mitamura H, Arai N, Naito Y, Ponganis P (2008) Effect of ocean current on the dead-reckoning estimation of 3-D dive paths of emperor penguins. Aquat Biol 3:265−270 Shiomi K, Narazaki T, Sato K, Shimatani K, Arai N, Ponganis PJ, Miyazaki N (2010) Data-processing artefacts in Editorial responsibility: Brent Stewart, San Diego, California, USA
➤
➤ ➤
➤
➤
➤ ➤
three-dimensional dive path reconstruction from geomagnetic and acceleration data. Aquat Biol 8:299−304 Tanaka H, Takagi Y, Naito Y (2001) Swimming speeds and buoyancy compensation of migrating adult chum salmon Oncorhynchus keta revealed by speed/depth/acceleration data logger. J Exp Biol 204:3895−3904 Titterton DH, Weston JL (2004) Strapdown inertial navigation technology, 2nd edn. Institution of Engineering and Technology, Stevenage Trawny N, Roumeliotis SI (2005) Indirect Kalman filter for 3D attitude estimation. Univ Minnesota Dep Comput Sci Eng Tech Rep 2 Triola MF (2005) Essentials of statistics, 3rd edn. Pearson Addison Wesley, New York, NY Watanabe Y, Baranov EA, Sato K, Naito Y, Miyazaki N (2004) Foraging tactics of Baikal seals differ between day and night. Mar Ecol Prog Ser 279:283−289 Whitney NM, Pratt HL Jr, Pratt TC, Carrier JC (2010) Identifying shark mating behaviour using three-dimensional acceleration loggers. Endang Species Res 10:71−82 Wilson RP, White CR, Quintana F, Halsey LG, Liebsch N, Martin GR, Butler PJ (2006) Moving towards acceleration for estimates of activity-specific metabolic rate in freeliving animals: the case of the cormorant. J Anim Ecol 75: 1081−1090 Wilson RP, Liebsch N, Davies IM, Quintana F and others (2007) All at sea with animal tracks; methodological and analytical solutions for the resolution of movement. Deep-Sea Res II 54:193−210 Wilson RP, Shepard ELC, Liebsch N (2008) Prying into the intimate details of animal lives: use of a daily diary on animals. Endang Species Res 4:123−137 Yoda K, Naito Y, Sato K, Takahashi A and others (2001) A new technique for monitoring the behavior of freeranging Adélie penguins. J Exp Biol 204:685−690 Submitted: September 26, 2011; Accepted: May 23, 2012 Proofs received from author(s): August 16, 2012