Monitoring Change: Characteristics of Dynamic Geo-spatial Phenomena for Visual Exploration1 Connie Blok ITC, Geoinformatics, Cartography and Visualisation Division, P.O.Box 6, 7500 AA Enschede, the Netherlands
[email protected] http://www.itc.nl/~carto
Abstract. In the context of a research about application of dynamic visualisation parameters in animations for monitoring purposes, this paper reports on characteristics of dynamic geo-spatial phenomena for visual exploration. A framework of concepts is proposed to describe a variety of phenomena in the physical environment. The nature of monitoring tasks is taken into account. Explicit attention is paid to context-sensitivity and to the description of the temporal behaviour of dynamic phenomena. If it proves to be a suitable framework, visualisation variables will be linked to the general concepts to form a theoretical basis for animated representation of dynamic geo-spatial phenomena. Empirical testing of animations will follow to evaluate whether dynamic visualisation variables can be used to prompt thinking about the processes at work and about spatio-temporal relationships by domain experts who perform monitoring tasks. The ultimate goal is to contribute to the development of representation methods and interaction tools.
1
Introduction
Monitoring of geographic phenomena starts with the acquisition of data about spatial dynamics, followed by exploration and analysis of the spatio-temporal data in order to gain insights in processes and relationships. Insights may enable scientists to warn or act otherwise in case of undesired developments, like hazards. It may also lead to the generation of models of reality which are, for example, used to estimate the effects of interference versus no interference in a development, or to extrapolation of trends in order to predict future developments. Almost all geographic phenomena are dynamic 1
This is the revised and updated version of a paper previously published as: Blok, C.A.: Monitoring of Spatio-temporal Changes: Characteristics of Dynamics for Visual Exploration. In: Keller, C.P. (ed.): Proceedings 19th International Cartographic Conference, Ottawa, Canada, Vol. 1. Canadian Institute of Geomatics, Ottawa (1999) 699–709.
Ch. Freksa et al. (Eds.): Spatial Cognition II, LNAI 1849, pp. 16-30, 2000. Springer-Verlag Berlin Heidelberg 2000
Monitoring Change
17
and many geoscientists are, for various monitoring applications, interested in tracking changes that are directly or indirectly visible in the landscape (see e.g. publications in journals such as Environmental Monitoring and Assessment and International Journal of Remote Sensing). The research described here refers mainly to dynamic geo-spatial phenomena in the physical environment, such as vegetation, erosion, atmospheric processes, etc., because it is directed to environmental applications. Dynamics related to social and socio-economic phenomena, like the movement of people, are not explicitly taken into account. Domain specialists who are involved in the monitoring of geographic phenomena have questions that are related to the geometric, thematic and temporal characteristics of data in order to learn more about [8], [10], [24]:
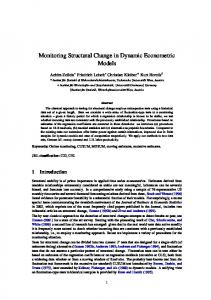
• the occurrence of anomalies: deviations from ‘normal’ values may require immediate action; • ongoing processes; • relationships in space, between themes and/or in time; • causes; • trends. In a GIS environment, answers to questions that are relevant for monitoring are commonly sought by using analytical and computational functions. It means that a query has to be defined, which leads to some kind of processing of the data [15], [24]. The computed results can be graphically represented, for example in a map. Alternatively, it is possible to use graphic representations as a starting point for analysis and exploration of the data. In that case, geographic visualisation is applied, a process which is commonly considered as making geographic data visible in a particular use context: visual exploration. Visual exploration is characterised by highly interactive and private use of graphic representations of predominantly unknown data [16]. It is being assumed that visualisation (a process which generates not only graphic, but also cognitive representations of reality) stimulates thought, and may reveal patterns and relationships that might otherwise remain hidden, e.g. see [6], [19], [18]. Offering different perspectives to the data, dynamics and interaction possibilities play an important role in this context [17]. In the current GIS practice, answers to questions are sought through data analysis in which either the spatial aspects of dynamic phenomena are emphasised by comparison of a (limited) number of snap shots, or the temporal aspects of objects or pixels are for further analysis represented outside the spatial context (e.g. in a graph). These approaches lead to respectively spatial or temporal reasoning, but spatio-temporal reasoning, taking the behaviour of a phenomenon in space and time into account, is not easy in these ways (figure 1). Combined analysis will be easier in a temporal GIS environment (TGIS), but apart from a few prototypes, e.g. [21], a fully operational TGIS does not yet exist [5]. Animated visualisation of dynamic phenomena might also facilitate spatio-temporal reasoning. In order to investigate the behaviour of dynamic geo-spatial phenomena, it is not enough to analyse or visually explore the ‘footprints’ of dynamics in the spatial context. Information on temporal characteristics is required as well, such as the order and
18
Connie Blok
duration of the various stages in a development, the rate of change, etc. Availability of this information (hence, the possibility to reason with spatio-temporal data) depends, amongst others, on factors related to data acquisition, like the moments in time, the frequency, scale and resolution.
Spatial-based reasoning
Temporal reasoning
Spatio-temporal reasoning
Tn T1
T
2
T1
Tn
T1
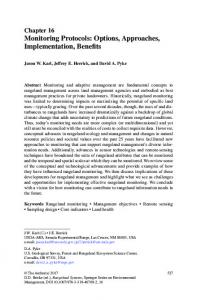
Fig. 1. Types of reasoning with dynamic geo-spatial data Acquisition decisions are often not based on the occurrence of change, but on other (e.g. economic) grounds (figure 2). However, change can be considered as indicating ongoing developments. In the current context change is defined as: variations in time in the geometric, thematic or temporal characteristics of geographic phenomena, or in a combination of these characteristics. Changes over time
T1
Tn
T1
Tn
Recording changes over time
Fig. 2. Data acquisition time is usually not guided by the occurrence of change Change can be graphically represented for visual exploration. Vasiliev [22] proposed a framework for the graphic representation of spatio-temporal data in static maps. However, in dynamic maps (animations) the temporal characteristics of change in ‘world time’ can be viewed in the time during which the animation is running, or in ‘display time’ [13]. Dynamic (and interactive) graphic representation of spatio-temporal data, preferably fully integrated in a TGIS environment, can therefore perhaps add a dimension to the interpretation of geographic data. A domain expert who uses animations to monitor geographic phenomena can extract information about dynamics from changes occurring in the conventional (graphic) representation variables (such as position, form, colour, size etc.). The question is what role the so-called dynamic visualisation variables play in this context. Such variables are, for example, identified by DiBiase et al. [6] and
Monitoring Change
19
MacEachren [16]. Examples are the moment at which change becomes visible in the display, the order and duration of the various stages, the frequency at which a stage is repeated and the rate of change, see also [14]. MacEachren [17] and Köbben &Yaman [12] attempted to link application of the dynamic variables to the measurement levels of the data that are to be represented. This approach is established by Bertin [2] for the graphic variables. Another option is to link the dynamic visualisation variables to dynamic characteristics of the data. In the context of a research about the role of dynamic visualisation variables in animated representations for the monitoring of phenomena in the physical environment, this paper deals with characteristics of dynamic phenomena for representation purposes. The paper reports on a part of the research, of which the ultimate goal is to contribute to the development of visualisation methods and interaction tools that can be used by domain specialists for visual data exploration during the execution of monitoring tasks. In the next sections, questions and tasks that are relevant for the monitoring of dynamic geo-spatial phenomena in the physical environment are first discussed. Then a framework of concepts to characterise those phenomena is proposed. Finally, some aspects related to the next phase in the research are discussed.
2
Geo-spatial Dynamics and Monitoring
Characterising the dynamic phenomena that are relevant for monitoring by a framework of concepts which describe those phenomena in general terms can be useful, especially if the concepts can be linked to representation variables. Such a framework needs to fulfill a number a prerequisites. The concepts should:
• be applicable to a broad range of phenomena in the physical environment (unique links between individual phenomena and representation variables cannot be expected); • be stated in common linguistic expressions that can act to trigger domain-specific knowledge about dynamic phenomena; • be geared to changes that can be visually explored in dynamic representations; • describe changes in the spatial domain; explicitly incorporate the temporal characteristics of changes exhibited in the spatial domain to facilitate the conceptualisation of dynamic phenomena. It has been described above that domain experts who are involved in monitoring tasks are interested in anomalies, processes, relationships, causes and trends. Insight in recent developments and in longer term dynamics are both important. In the context of visual exploration of data representations, it means that questions can partly be addressed to relatively short sequences of images containing (usually recent) changes, and partly to longer time series in which also less recent images are involved (for convenience further indicated as respectively ‘short series’ and ‘longer series’). A number of basic questions can be inferred from literature. Questions that play a role in visual exploration of short series are: “Is there any change?” And if a known process
20
Connie Blok
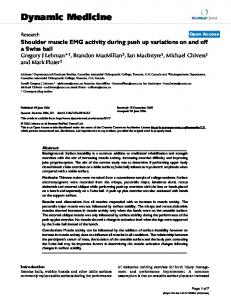
is going on: “What are the developments?” Discovering new processes and trends, however, will usually require examination of longer series. These basic questions enable identification of the geometric, thematic and temporal characteristics of change (figure 3). In addition to identification, comparison of characteristics of geographic phenomena is a task which is supported by visual exploration [17]. Comparison can be applied to different phenomena at the same location and time (e.g. vegetation and rainfall), or to one phenomenon at different locations or in different times (e.g. vegetation in two areas, or in two growing seasons). “Are there changes?” and “Are there anomalies?” are basic questions that can be addressed to short series. The last question can also be addressed to longer series. In addition, questions with respect to possible relationships and causes are relevant, see e.g. [8], [10], [24].
Series Exploration tasks
Short
Longer
Change? What developments?
What process? Trend?
Identification
Tn
T3 T1
T
Relationships / causes? Anomalies?
Changes? Anomalies? Comparison T3 T1
1
Tn
TnTn
T3
T1
T1
T1
Fig. 3. Monitoring questions in relation to visual exploration tasks The tasks and the inferred basic questions that play a role in monitoring can be used as a starting point for the selection of descriptive concepts for the framework. Although relevance and completeness of the proposed framework have to be validated in the next research phase (see also the section ‘Discussion and Outlook’ below), it is postulated that domain experts are interested in the following characteristics of dynamic phenomena:
• the appearance of new phenomena; • the disappearance of existing phenomena; • changes in the geometric, thematic and temporal characteristics;
Monitoring Change
21
• spatio-temporal behaviour over short series (to track changes and act in case of undesired developments); • spatio-temporal behaviour over longer series (to gain insights in processes and relationships and to be able to distinguish trends and extrapolate developments into the future).
3
Spatio-temporal Characteristics
Various existing categorizations of spatio-temporal phenomena have been investigated to assess their usefulness for the research described here. However, none of the classification found meets all the prerequisites that have been defined in the previous section. Some relevant examples are described below. In some classifications categories are distinguished that emphasize changes in the spatial domain; they do not explicitly take the temporal aspects into account. Typical examples of concepts used are appearance/disappearance, movement, expansion/shrinkage, increase/decrease or change in internal/external morphology, e.g. [7]. Hornsby and Egenhofer [11] propose a change description language to characterise sequences of object changes. It consists of a detailed description of transition types that either preserve or change the identity of single and composite objects (e.g. create, generate, reincarnate, divide, merge, mix). Domain-specific knowledge will often be required to distinguish between transition types. The language is meant to build formal data models of change, it does not fully describe the changes in graphic models (e.g. animations) to be used for monitoring applications. For instance, movement, geometric changes such as boundary shifts and temporal characteristics are not (explicitly) incorporated. Eschenbach [9] attempts to classify movement based on the spatial structure of objects. The two main classes are movement along trajectories (complete shifts in position) and internal motion (changes in the position of parts of an object). The last category is further subdivided into growth/shrinkage, internal rotation, movement of parts, and a category referring to movement of large bodies that might be along trajectories, but are too short to result in a complete shift of position. The distinction between the last two subcategories is a not very clear, and probably not relevant for monitoring. The author indicates that the categories are not exclusive, some movements are, for instance, trajectory-based with internal motion. This classification also emphasizes changes in the spatial domain. Yattaw [23] classifies movement by taking the spatial characteristics point, line, area, volume and the temporal characteristics continuous, cyclical, intermittent into account. A matrix of these characteristics results in twelve classes of movement. She also mentions the influence of spatial and temporal scale and of context for the assignment of a particular movement to a class. An advantage is that temporal aspects are explicitly included, although the concepts mainly describe patterns over longer periods. Characteristics like duration and rate of change, relevant for shorter and longer periods of time, are not accommodated. Another drawback is that the spatial characteristics distinguished do not adequately describe changes in the spatial domain.
22
Connie Blok
Building on the work of these authors, however, and on parameters of display time in animations [6], [16], a framework of general linguistic expressions is proposed to characterise changes that are relevant for monitoring and that can (at least in theory) be discovered by visual exploration. Four main categories are distinguished in the framework: concepts to describe change in the spatial domain, change in the temporal domain, overall spatio-temporal patterns over longer series, and relative similarity in comparisons (figure 4). The main categories are related to visual exploration tasks and to the focus of attention of the viewer of the representations: recent developments only (short series) or dynamics over longer periods of time (longer series). Series Exploration
Short
Longer
Identification
Spatial domain; Overall temporal domain patterns
Comparison
Relative similarity
Fig. 4. Main categories of the framework of concepts in relation to visual exploration tasks and the focus of attention: short or longer series
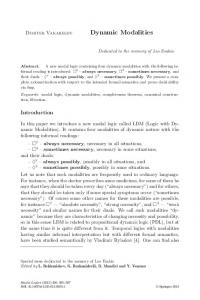
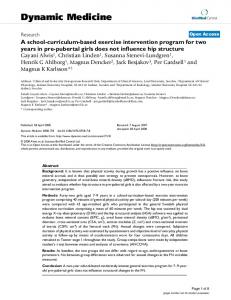
3.1 Change in the Spatial Domain The basic concepts proposed to describe change in the spatial domain are (figure 5):
• Appearance/disappearance: refers to the emergence (the ‘birth’) of a new phenomenon or the vanishing (the ‘death’) of an existing one (e.g. a tornado, a volcano, a wild fire, pollution). Changes in the nature of an already existing phenomenon (such as an inactive volcano that becomes active, or the change from forest stand to arable land) are not characterised by appearance/disappearance, but by concepts from the next category. • Mutation: refers to a transformation that affects the thematic attribute component of an existing phenomenon; it does not refer to changes in geometric characteristics. Two subtypes are distinguished. −
Mutation at nominal level of measurement: refers to a change in the nature or character of a phenomenon (e.g. change from rain to snow, from gully to sheet erosion, from forest to burned area, from a dry to a water containing intermittent river).
Monitoring Change
−
23
Increase/decrease: refers to a change at ordinal, interval or ratio level of measurement (e.g. changes in the force of a tornado, the thickness of the cloud cover, the amount of precipitation, the vegetation index).
• Movement: refers to a change in the spatial position and/or the geometry of a phenomenon. Again, two subtypes are distinguished. −
−
Movement along a trajectory: refers to a movement by which the whole phenomenon changes its position. A kind of path is followed, hence it can be assumed that movement takes more than a single instant of time, some continuity is involved. Along the path, the geometric characteristics of the phenomenon may change (e.g. tornadoes and pollution carried by running water exhibit movement along a trajectory). Boundary shift: refers to movement where at least part of the phenomenon maintains its location (e.g. the jet stream; expansion of the area occupied by an existing phenomena, such as a cleared area, an eroded area, an area with a high vegetation index, or a polluted area). These types of movement may either happen at a single instant of time, or take a longer period.
Appearance / disappearance Tn
Tn
T 1
T 1
Mutation:
nominal
Tn
increase / decrease Tn
Tn T
T
1
1
T 1
Movement:
along a trajectory
boundary shift
Tn
Tn
T 1
T
1
Fig. 5. Basic characteristics of change in the spatial domain A number of remarks can be made here. Firstly, most dynamic phenomena can be characterised by more than one of the proposed basic concepts for change in the spa-
24
Connie Blok
tial domain. For example, a tornado appears, increases in force, moves along a trajectory, decreases again, and finally disappears. In other words: to be able to describe the behaviour of a phenomenon in space, the concepts often have to be combined. Secondly, the concepts used to characterise geo-spatial phenomena often vary: “…the problem of putting a label on a geographic feature is much a matter of context.” [1, pp.73]. That also applies to dynamic phenomena. A number of factors play a role, such as the perspective of the expert or the aspect of a phenomenon being studied [25]. E.g. if the behaviour of a wild fire is examined, relevant concepts to characterise it are appearance/disappearance, mutations (changes in intensity) and, most likely, movement along a trajectory. If, however, the wild fire effect is examined and the expert is interested in burned areas, new areas appear and boundary shifts occur in existing areas. But if the effect is studied in terms of changes in land use, it is more like mutations and boundary shifts. Characterising is also influenced by the phenomenon itself. Incidental pollution (e.g. carried by running water or moving air) is characterised by movement along a trajectory, but in case of more or less continuous pollution of water, soil or the atmosphere from a fixed source, boundary shifts occur. Display scale or size of the area represented also influence characterization. At a global scale the changes from cloudy to cloud free skies can be conceived as mutations, but if a small area is represented, clouds appear and disappear. A large scale display of the eruption of a volcano shows boundary shifts in lava streams. In a small scale representation of the volcanic activity in a region, however, movement cannot be expected. The time frame considered is another factor influencing the way in which a phenomenon is characterised. If a short series of changes is considered, clouds exhibit boundary shifts, in longer series movement along trajectories are more likely. Hence, some basic concepts to characterise change in the spatial domain have been proposed, but use and display contexts seem to influence which (combination of) concepts (is) are most appropriate to describe dynamic phenomena. The relative importance of context sensitivity will be further considered in the next research phase, where various monitoring applications will be investigated to validate the relevance and the completeness of the defined concepts for these applications. Some refinements might be necessary. For instance, it is not clear at this stage whether changes such as splitting and merging need to be distinguished separately, or whether they can be considered as combinations of appearance and disappearance. Also, many dynamic phenomena exhibit almost continuous change of the contours of patterns, in different directions (e.g. cloud cover, vegetation values). For such movement patterns it is not easy to determine whether a phenomenon only changes in form, or in form and size, and perhaps even direction. Therefore, the category ‘boundary shift’ is not further subdivided, but if useful, another level can be added to the hierarchical categorization of basic changes (e.g. expansion/shrinkage and other geometric changes). Representation variables will only be linked to the framework of concepts after this further investigation into applications.
Monitoring Change
25
3.2 Change in the Temporal Domain To further characterise the behaviour of dynamic geo-spatial phenomena, concepts that describe change in the temporal domain are also required. Proposed are (figure 6):
• Moment in time: refers to the instant of time or the time interval at which a change is initiated, it allows the location in time of a change in the spatial domain. • Pace: refers to the rate of change over time. It can be expressed in terms such as ‘slow/fast’; or ‘at an increasing/decreasing/constant rate of change’ [17]. • Duration: refers to the length of time involved in a change and/or the time between changes. It can be expressed in absolute or in relative terms (respectively number of time units, and notions such as ‘short/long’). • Sequence: refers to the order of phases in a series of changes in the spatial domain. • Frequency: refers to the number of times that a phase is repeated in a series of changes in the spatial domain.
Moment
t1 2 3
4
5
Pace fast
Duration Sequence
1 1
1 2
slow
7
3
4 units
4
Frequency 2x
Fig. 6. Characteristics of change in the temporal domain
3.3 Overall Spatio-temporal Patterns over Longer Series Characterising change over longer series of images requires integration of individual changes into an overall spatio-temporal pattern of change. Hence, some additional concepts are introduced to enable the description of spatio-temporal patterns over longer series (although recognition of those patterns depends on the selected time frame and resolution). The patterns can, if required, be further characterised by con-
26
Connie Blok
cepts proposed for the spatial and temporal domains (see also figure 4). The new concepts may refer to the geometric, thematic or temporal data component, or to any combination of these components. Proposed for monitoring applications are (figure 7):
• Cycle: refers to a periodical return to a previous state/condition [20]. Cycles are quite common in the physical environment, e.g. atmospheric processes and changes in vegetation may exhibit cyclic patterns. If a cycle is discovered, developments can perhaps be predicted, although disturbance of usual patterns may always occur. • Trend: refers to a structured, but non-cyclical pattern [20]. It is the general direction, or tendency, of a development over a period of time. Examples are developing spatial clustering (geometric data component), increase in value (thematic data component) and higher frequencies (temporal data component). If a trend can be observed, extrapolation in time may be possible. However, changes in the direction of a development may always occur. If no cycle or trend can be discovered, the pattern is unstructured. Characterising unstructured patterns does not seem useful, because they are hard to interpret.
Cycle
Trend Tn
T1
Tn
T1
Fig. 7. Overall spatio-temporal patterns over longer series (including recent and less recent change)
3.4 Relative Similarity in Comparisons Comparison of changes (in space, between themes and in time) is an exploration task at a higher conceptual level than identification. It can, however, only be performed in a meaningful way if the phenomena are also identified. Therefore, the concepts proposed for identification in short and long series above are considered relevant for comparison as well. In addition, characterizing the relative similarity is desired. For comparison in short series (with usually recent images) the following concepts will probably suffice (figure 8):
Monitoring Change
27
• Same/different: refers to changes that are comparable/incomparable, particularly in the geometric and/or the thematic data component. Same/different observations may point to the occurrence of anomalies and lead to immediate action of a domain expert. Concepts proposed for the comparison of change over longer series (containing recent and less recent images) are:
• Same/opposite/different: refers to patterns that show respectively comparable (proportional), inversely proportional and incomparable changes. Same patterns may point to a positive (cor)relation, opposite patterns to a negative one, and different patterns again to anomalies. • In phase (synchronous)/phase difference: refers to the simultaneousness of pattern developments, which might be particularly relevant for same and opposite patterns. If pattern developments start and end at the same time, patterns are in phase, and perhaps somehow correlated. If same or opposite patterns are observed with a time lag, there is a phase difference. Exploration of those pattern developments can still be interesting, because that may point to a causal relationship. For instance, vegetation might develop similar patterns as precipitation, but somewhat later in time, see also [17], [4].
Same
Short series
Different
Tn T
Tn
Tn
T
T
Opposite
Same Tn
Longer series
T
Tn T
1
1
In phase (synchronous) Tn T
1
1
T
T
T
1
1
1
Phase difference Tn + x
Tn T
T
1
Tn
Tn
Tn
Tn T
1
Different
Tn
T
1
T
1
1
1
Tn
1+x
Fig. 8. Comparing spatio-temporal patterns: relative similarity
28
Connie Blok
4 Discussion and Outlook Retrieval of information from geo-spatial data in a GIS environment is usually accomplished by querying the data, followed by some kind of geocomputation. Intermediate and final results of the queries are often graphically represented. Nowadays, research is also directed to another way to gain information from geo-spatial data and that is by visual exploration, where graphic representations are the starting point for further querying and analysis of the underlying data. For visual exploration of dynamic geo-spatial phenomena, dynamic representations (animations) seem to be attractive media. In dynamic representations, use is being made of dynamic visualisation parameters. Currently there is no empirically tested theoretical framework for application of the dynamic visualisation parameters to geo-spatial data representation. The research described here hopes to contribute to the development of a theoretical framework. The approach is to link characteristics of dynamic geo-spatial phenomena to representation variables. As a first step, the characteristics of phenomena of interest to a particular type of application, the monitoring of change in the physical environment, have been investigated. By taking monitoring tasks into account, a theoretical framework of concepts to describe general characteristics of dynamic phenomena that can be visually explored is proposed in this paper. The general characteristics should be able to trigger more specific domain expert knowledge about the dynamic phenomena by people involved in monitoring tasks. In particular, concepts used to describe change in the spatial domain seem to be influenced by the use and display contexts, but within a particular context, unambiguous assignments are required. The relative importance of context sensitivity will be further examined in the next research phase. The objective of the next phase is to validate the relevance and completeness of the proposed framework for a number of monitoring applications. Some adaptations might be necessary. Adaptations may also stem from literature review into the perceptual and cognitive aspects related to geo-spatial dynamics. Looking into ways in which people perceive and reason with geo-spatial dynamics, in the real world as well as in graphic representations, is considered as an important step, to be taken before characteristics of dynamic phenomena are related to characteristics of dynamic representations. Studying the cognitive aspects of dynamic representations of geo-spatial data is one of the priority research items on the agenda of the Commission on Visualisation and Virtual Environments of the International Cartographic Association [18] and the research described here hopes to contribute to it. For questions that remain to be answered, see e.g. Blok [3]. If perceptual and cognitive aspects can be satisfactory incorporated in visualisation methodologies (or if, to some extent, user experiences and expectations can be met), dynamic representations of geo-spatial data might be powerful instruments for the monitoring of dynamic phenomena. This is based on the assumption underlying exploratory visualisation that vision and cognition together are powerful in pattern seeking [18]. Visual representations can be explored without the necessity to predefine a query in which at least one of the data components is specified (location, the-
Monitoring Change
29
matic attributes or time), as is the case in current GIS’s, see e.g. [15], [24]. However, analytical and computational functions will remain important, for example to calculate the strength of a possible spatio-temporal relationship between two phenomena, discovered by visual exploration. Visual and computational methods each have strengths and weaknesses, but full integration of a dynamic visualisation and a (T)GIS environment seems, potentially at least, beneficial for tasks in which identification and comparison of spatio-temporal patterns and relationships are important. The link between the framework of concepts proposed here and the visualisation variables will form the theoretical basis for animated representation of the dynamic phenomena that are relevant for monitoring. Animations in which the theory is implemented will be empirically tested to evaluate which (combination of) dynamic visualisation variables can be used to prompt thinking about the processes at work and about spatio-temporal relationships by domain experts who perform monitoring tasks. The ultimate goal is to contribute to the development of representation methods and interaction tools that can be helpful in the execution of tasks described above.
References 1. Ahlqvist, O., Arnberg, W.: A Theory of Geographic Context, the Fifth Dimension in Geographical Information. In: Hauska, H. (ed.): Proceedings of the 6th Scandinavian Research Conference on Geographical Information Systems. ScanGIS’97, Stockholm, Sweden (1997) 67–84 2. Bertin, J.: Semiology Graphique. Mouton, Den Haag (1967) 3. Blok, C.A.: Cognitive Models of Dynamic Phenomena and their Representation: Perspective on Aspects of the Research Topic. Presented at NCGIA’s Varenius Project Meeting on Cognitive Models of Dynamic Phenomena and their Representations, University of Pittsburgh, PA, U.S.A. (1998) 4. Blok, C.A., Köbben, B., Cheng, T., Kuterema, A.A.: Visualization of Relationships between Spatial Patterns in Time by Cartographic Animation. Cartography and Geographic Information Science 26.2 (1999) 139–151 5. Castagneri, J.: Temporal GIS Explores New Dimensions in Time. GIS World 11.9 (1998) 48–51 6. DiBiase, D., MacEachren, A.M., Krygier, J.B., Reeves, C.: Animation and the Role of Map Design in Scientific Visualization. Cartography and Geographic Information Systems 19.4 (1992) 201–214, 265–266 7. Dransch, D.: Temporale und Nontemporale Computer-Animation in der Kartographie. Reihe C, Kartographie, Band 15. Freie Universität, Technische Universität, Technische Fachhochschule, Berlin (1995) 8. Eastman, R.J., McKendry, J.E., Fulk, A.: Change and Time Series Analysis. 2nd edn. Explorations in Geographic Information Systems Technology, Vol. 1. Unitar, Geneva (1995) 9. Eschenbach, C.: Research Abstract on Dynamic Phenomena in Space and their Representation. Presented at NCGIA’s Varenius Project Meeting on Cognitive Models of Dynamic Phenomena and their Representations, University of Pittsburgh, PA, U.S.A. (1998)
30
Connie Blok
10. Groten, S.M.E., Ilboudo, J.: Food Security Monitoring Burkina Faso. NRSP Report 95–32. BCRS (Netherlands Remote Sensing Board), Delft (1996) 11. Hornsby, K., Egenhofer, M.J.: Qualitative Representation of Change. In: Hirtle, S.C., Frank, A.U. (eds.): Spatial Information Theory; a Theoretical Basis for GIS. Lecture Notes in Computer Science, Vol. 1329. Springer-Verlag, Berlin Heidelberg New York (1997) 15–33 12. Köbben, B., Yaman, M.: Evaluating Dynamic Visual Variables. In: Ormeling, F.J., Köbben, B., Perez Gomez, R. (eds.): Proceedings of the Seminar on Teaching Animated Cartography. International Cartographic Association, Utrecht (1996) 45–51 13. Kraak, M.J., MacEachren, A.M.: Visualization of the Temporal Component of Spatial Data. In: Waugh, T.C., Healey, R.C. (eds.): Advances in GIS Research Proceedings, Vol. 1. Sixth International Symposium on Spatial Data Handling, Edinburgh, Scotland, UK (1994) 391–409 14. Kraak, M.J., Ormeling, F.J.: Cartography, Visualization of Spatial Data. Addison Wesley Longman Limited, Harlow (1996) 15. Langran, G.: Time in Geographic Information Systems. Taylor & Francis, London (1992) 16. MacEachren, A. M.: Visualization in Modern Cartography: Setting the Agenda. In: MacEachren, A.M., Taylor, D.R.F. (eds.): Visualization in Modern Cartography. Pergamon/Elsevier Science Ltd., Oxford (1994) 1–12 17. MacEachren, A.M.: How Maps Work; Representation, Visualization and Design. The Guilford Press, New York (1995) 18. MacEachren, A.M., the ICA Commission on Visualization: Visualization, Cartography for the 21st Century. Presented at the Polish Spatial Information Association Conference, Warsaw, Poland (1998) 19. Monmonier, M., Gluck, M.: Focus Groups for Design Improvements in Dynamic Cartography. Cartography and Geographic Information Systems 21.1 (1994) 37–47 20. Muehrcke, P.C., Muehrcke, J.O.: Map Use, Reading, Analysis, and Interpretation. 3rd Edn. JP Publications, Maddison, Wisconsin (1992) 21. Peuquet, D., Wentz, E: An Approach for Time-Based Spatial Analysis of Spatio-temporal Data. Advances in GIS Research, Proceedings 1 (1994) 489–504 22. Vasiliev, I.R.: Mapping Time. Monograph 49, Cartographica 34.2 (1997) 23. Yattaw, N.J.: Conceptualizing Space and Time: a Classification of Geographic Movement. Cartography and Geographic Information Science 26.2 (1999) 85–98 24. Yuan, M.: GIS Data Schemata for Spatio-temporal Information. In: Goodchild, M. (ed.): Proceedings of the Third International Conference on Integrating GIS and Environmental Modelling. NCGIA, Santa Fe, New Mexico (1996) 25. Yuan, M.: Use of Knowledge Acquisition to Build Wildfire Representation in Geographical Information Systems. International Journal of Geographical Information Science 11.8 (1997) 723–745