THE ECOLOGY AND MANAGEMENT OF RIEMVASMAAK’S NATURAL RESOURCES
M. Timm Hoffman Dan Sonnenberg Jeanne L. Hurford Barry W. Jagger
NATIONAL
BOTANICAL INSTITUTE
THE ECOLOGY AND MANAGEMENT OF RIEMVASMAAK’S NATURAL RESOURCES
Report on a baseline ecological survey conducted in Riemvasmaak, Northern Cape, South Africa between 16-29 January, 1995, and an outline of a proposed monitoring programme for the region.
M. Timm Hoffman, Dan Sonnenberg, Jeanne L. Hurford & Barry W. Jagger
July 1995
National Botanical Institute, Private Bag X7, Claremont, 7735, South Africa Tel: +27-21-762-1166; FAX: +27-21-797-6903; e-mail:
[email protected]
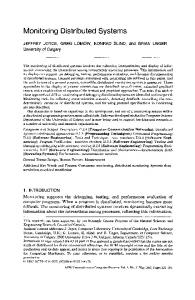
PLATE 1.1. National Botanical Institute members of the survey team and authors of this report: Clockwise from upper left: Barry Jagger, Dan Sonnenberg, Jeanne Hurford and Timm Hoffman
PREFACE During the last five years South Africans have witnessed dramatic political and social changes and genuine attempts are currently being made to redress some of the injustices which occurred during decades of minority government rule. One of the worst of these injustices was the removal and re-location of entire communities as part of a large-scale, social engineering programme which accompanied the South African government’s apartheid legislation from 1948 onwards. This programme of ethnic cleansing or “black spot removal” profoundly affected the lives of millions of South Africans. One such group was a small community of about 1 500 people living an agrarian existence in one of the most arid parts of the country in an area known as Riemvasmaak. Boasting a diverse ethnic heritage the Riemvasmakers colonized this approximately 75 000 ha region immediately north of the Orange River towards the end of the last century and during the first few decades of this century. It was a peaceful and religious community which managed its natural resources effectively, provided schools for the education of its children and which also enjoyed good relationships with its neighbours. However, as part of a well-orchestrated “black spot removal” programme, the South African government forcibly relocated some of the Riemvasmakers during 1973 and 1974. Those with an historical Xhosa ethnicity were moved to the Ciskei in South Africa in 1973 while those with Nama and Damara heritage were moved, against their wishes, to northern Namibia in 1974. A number of Riemvasmakers classified as “Coloured” were dispersed in and around the greater Orange River environment at the same time. Tremendous subsequent hardships ensued for the majority of Riemvasmakers in their adopted lands including livestock losses and debilitating poverty.1 Following their exodus in 1974, Riemvasmaak was used by the South African Defence Force (now known as the South African National Defence Force but referred to as the SADF throughout this document) and other military establishments as a troop-training and arms-testing facility. However, in anticipation of the changes sweeping the country in the early 1990’s a group of Riemvasmakers began to initiate procedures for re-claiming their land. After an intensive struggle in which a number of individuals comprising the Riemvasmaak Coordinating Committee, the Surplus People Project (SPP) and the Legal Resources Centre (LRC) played pivotal roles it was agreed by the Commission on Land Allocation in December 1993 that the people who were forcibly removed from Riemvasmaak should return. But what was there to return to and how would the Riemvasmaak community rebuild their livelihoods? The national as well as the regional economic, social and agricultural environment has changed considerably since 1974. Which agricultural enterprises should be developed or supported, where would the necessary capital be
1
Although elaborated upon in the report which follows, a more detailed account of the history of Riemvasmaak, the brutal nature of the forced removal, their period in the “wilderness” and the community’s claim to the land is contained in Smith & Bozalek (1993) and in the Riemvasmaak Coordinating Committee’s “Submission to the Commission on Land Allocation on behalf of the community of Riemvasmaak” (SPP & LRC, 1993). Other aspects, especially the landuse history of the region are dealt with in more detail elsewhere in this report. i
found and who would assist the Riemvasmakers in their attempts to rebuild their lives? FARM Africa has an extensive and growing experience in agricultural development programmes in Africa and it is to this organization that the Riemvasmaak Trust Committee has turned to provide assistance with the planning of the agricultural development of the region. Planning, however, requires an extensive knowledge of the region’s natural resources and its potential. Responsible and sustainable development programmes also require the measurement of a variety of indicators with which to assess the effectiveness or otherwise of the programme. In order to fulfill its task of developing the agricultural base of Riemvasmaak, FARM Africa, in turn, has requested assistance from the National Botanical Institute (NBI), an organization with expertise in the ecology and management of southern Africa’s arid and semi-arid zones. This report of the National Botanical Institute has six main objectives: a. To synthesize available ecological information about the area including all available plant and animal checklists; b. To conduct a baseline survey of the region and to describe the landscape as it existed in January 1995; c. To assess landscape “condition” in the context of the environmental and landuse history of the region; d. To assess the landscape’s potential and livestock carrying capacity; e. To describe landuse practices in “Old Riemvasmaak”; f. To outline a monitoring programme for Riemvasmaak. Firstly, numerous unpublished reports and plant and animal checklists have emerged concerning the Riemvasmaak environment and our first task, therefore, was to synthesize available information pertaining to the physical and biotic environment of the region. Where applicable we have tried to redraw the key figures and redraft important technical data from other sources so as to make them more accessible to a broader, non-specialist audience. Secondly, a survey of the region was conducted by the authors of this report between January 16-29, 1995. This document serves as a useful vehicle to summarize the main findings of the survey which describes the condition of the landscape after 20 years without livestock. It was important that the survey be conducted in January, before the return of the Riemvasmakers with their stock from January to June 1995. In a sense, the survey describes the Riemvasmaak environment at “time zero” and future changes can now be interpreted according to this benchmark period. Thirdly, a detailed knowledge of the past often helps in the planning for the future. This report, therefore, also emphasizes the environmental and landuse history of the region. An analysis of long-term rainfall records, aerial and ground photographs and the re-sampling of key plant survey sites has helped us to develop a more complete understanding of the changing Riemvasmaak ecological environment over time and to assess its current ecological “condition”. Interviews with a number of livestock farmers has also helped considerably in our understanding of landscape condition in “Old Riemvasmaak”. Fourthly, many Riemvasmakers possess a keen interest in livestock and wish to farm either on a full- or part-time basis. However, FARM Africa, and indeed many other planning agencies, need to know something about the ecological potential and livestock carrying capacity of the region in order to make important decisions
ii
concerning future development projects. We address this thorny carrying capacity issue in our report and draw on the historical testimony of a number of Riemvasmakers to describe the grazing practices and fluctuations in stock numbers which existed in “Old Riemvasmaak”. Finally, in order for the livestock owners and crop farmers of Riemvasmaak to make decisions about their agricultural enterprises in the future they will need to keep track of environmental and economic conditions. Therefore, FARM Africa explicitly wanted this report to advise on the development of a monitoring programme for the region. The National Botanical Institute’s team has been acutely aware throughout this survey that although the Riemvasmakers have been away from their land for 20 years, many retain an impressive knowledge of the region’s natural resources. Because of this we have tried, wherever possible, not only to extract relevant information from key informants but also to feed back to interested members and especially the livestock owners, knowledge that we have gained during the course of our survey. In this way we have also been able to assess the accuracy of our information and data. To this end we met with available Riemvasmakers on the 16 January to discuss our survey intentions. It was suggested at this meeting that we take along a local guide and for three days we enjoyed the expert guidance, advice and warm company of Mr Willem Vass. The last day of our survey was concluded with a brief report-back and discussion of our observations and preliminary findings. Between February and April 1995 the survey data were analyzed and prepared for presentation. A further trip was made to the region by the senior author of this report together with Dr David Catling of FARM Africa from May 2-6 1995. A more detailed three-hour report-back session was arranged for the morning of the 4 May 1995. Highlights of this report, including the long-term rainfall record, stocking rates, water resources, the Prosopis problem and aspects of the monitoring programme were discussed with about 40 Riemvasmakers, most of whom were livestock owners. Further discussions were conducted in smaller groups for the next two days and important details of these fruitful exchanges have been incorporated into the text, figures and tables of this report. A seminar, attended by about 40 academics was also held in the University of Cape Town’s Botany Department on 17 May 1995. The frank and sometimes hostile responses to some of the issues raised in this report, especially those concerning carrying capacity estimates, have been considered in the relevant sections of this report. Finally, our relationship to this project has changed considerably during the last 6 months. While we do “advise” on certain key aspects of the agricultural development programme for the region we would now rather like to emphasize our role as interpreters and advocates of especially the aspirations of the livestock owners of Riemvasmaak. Only a small amount of their extensive knowledge and management expertise has been captured in this report. We would advise that far more effort in the future be spent on simply listening to the history and aspirations of the Riemvasmakers themselves before any far-reaching decisions are taken on crucial aspects such as stocking rates and grazing systems. Without an extensive and inclusive consultation process there is little doubt in our minds that even the most elaborate and expensive development programmes will ultimately fail. Authoritarian grazing “rules” if not developed and agreed to by the livestock owners themselves will
iii
meet with determined resistance. Also, the success of other constructive development programmes will ultimately be jeopardized.
References: Smith H & Bozalek L (1993). Riemvasmaak: Application to the Commission on Land Allocation by Riemvasmaak community. Legal aspects and status of Riemvasmaak land. Unpublished report, 12 November 1993. Legal Resources Centre, Cape Town. SPP & LRC (1993). A claim to Riemvasmaak: Submission to the Commission on Land Allocation on behalf of the community of Riemvasmaak. Unpublished report. Surplus People Project (SPP), Cape Town and Legal Resources Centre (LRC), Cape Town.
M. Timm Hoffman Dan Sonnenberg Jeanne L. Hurford Barry W. Jagger Kirstenbosch July 21, 1995
iv
ACKNOWLEDGEMENTS
Many individuals and organizations have helped in this project. Firstly, we would like to acknowledge the contribution of the Riemvasmaak community itself. Not only have they supplied a great deal of the information contained in this report but they have also directed much of our line of investigation. Although we mention throughout the text, the names of individuals who have helped with specific aspects of our study, we would like to highlight the assistance we have received from Mr Freddy Bosman Snr, Mr Freddy Bosman Jnr, Mrs Rita Maasdorp, Mr Pieter Malgas, Mr James Mapanka and especially Mr Willem Vass. The frank and constructive response of all the livestock farmers to our report-back session on 4 May 1995 is also much appreciated. The National Parks Board assisted us in a number of ways during our baseline survey. Dr Anthony Hall Martin, Dr Hugo Bezuidenhout, Dr Michael Knight and especially Mr Barry Hopgood, the Augrabies Falls National Park Game Warden, are thanked for their help. This report would not have been possible without the supportive encouragement of Dr David Catling, the FARM Africa representative who has been intimately involved with the agricultural development initiatives at Riemvasmaak. Together with Dr Dick Sandford, who suggested the need for the survey and monitoring programme, we have received nothing but constructive assistance. Mr David Makin-Taylor has also provided helpful comment on a number of issues. Ms Sue Power and Ms Glenda Glover of the Surplus People Project have made their very valuable resource files available to us and have provided us with a great deal of historical information concerning Riemvasmaak. Together with Mr Henk Smith of the Legal Resources Centre, the Surplus People Project was pivotal in the struggle for the return of the land to the Riemvasmakers. These people willingly shared their insights of the region and wealth of experience with us. We have benefited from the botanical expertise of many of our colleagues at the National Botanical Institute. In particular we would like to mention the Compton Herbarium staff: Dr John Rourke, Mr Koos Roux and Dr Deidre Paterson-Jones. Other colleagues, including Dr George Davis, Dave Macdonald, Guy Midgley, Dr Mike O’Callaghan, Les Powrie and Dr Mike Rutherford helped with interpretation and analysis of key aspects of the data. An afternoon in the University of Cape Town, Botany Department’s “Bear Pit” discussing aspects of this report with Professor William Bond, Dr Peter Linder, Dr Jeremy Midgley, Dr Willie Stock and others has sharpened our thinking considerably. Other colleagues who have provided information include Professor Noel van Rooyen of the University of Pretoria, Dr Kevin Balkwill of Wits University, Dr Dave Richardson from the University of Cape Town and Tanya Anderson of the McGregor Museum in Kimberley. Carl Stoltsz of the Plant Protection Research Institute provided information and helpful advice on the Prosopis problem at Riemvasmaak. Dr Mariane Tredoux of the Geology Department at the University of Cape Town helped to simplify Riemvasmaak’s complex geology for us. The archaeological work mentioned in the report has benefited from the advice of Professor Andy Smith of the University of Cape Town and Mr Peter Beaumont of the MacGregor Museum.
v
The South African National Defence Force, and especially Captain Willie van der Merwe, have been most cooperative in providing access to their files on Riemvasmaak. They have also sent us a great deal of ecological information collected during their tenure of the region from 1974-1993. Ms Rachel Wynberg of the Environmental Evaluation Unit has also provided us with assistance especially regarding the development of the monitoring programme for the region. We would also like to acknowledge the support of the National Botanical Institute and the Department of Environment Affairs and Tourism. Finally, decisions taken at the household level appear critical for any enterprise whether it be ecological research or livestock farming. In the light of this, the senior author would like to acknowledge the generous support and encouragement that his wife Carolyn has provided throughout this project.
vi
EXECUTIVE SUMMARY •
•
This report of the National Botanical Institute has six main objectives: We synthesize available ecological information about the area including all available plant and animal checklists; conduct a baseline survey of the region and describe the landscape as it existed in January 1995; assess landscape “condition” in the context of the environmental and landuse history of the region; assess the landscape’s potential and livestock carrying capacity; describe landuse practices in “Old Riemvasmaak”; finally, we outline a monitoring programme for Riemvasmaak. The report has four chapters and 10 Appendices.
CHAPTER 1: THE BASELINE SURVEY • •
• •
• • •
•
•
This first chapter describes the baseline survey conducted in Riemvasmaak between 15-29 January 1995. Riemvasmaak is 74 563 ha in extent. It is situated in the Northern Cape province and borders on the Orange River in the south and Namibia in the west. Commercial farmland occurs to the north and northeast of Riemvasmaak while the National Parks Board owns adjoining land in the east and leases 4 270 ha of Riemvasmaak land from the Riemvasmaak Trust in the southeast; A map of local place names including those of veeposte (stockposts) shows the wealth of knowledge which still exists within members of the Riemvasmaak community regarding the ecology and management of the landscape; The geology of the region is tightly coupled to the landforms of the region and is comprised of 3 main geological groups: the Namaqualand Mobile Belt sediments and intrusive rocks; the Nama sediments comprising the plateau; the more recent Kalahari and Quaternary sands; Numerous pegmatites exist in the region and form the basis for the mining industry that existed in the region in the past. The six main pegmatites that have been exploited in the past are described; The results of an analysis of 12 soil samples is presented and a description of the Molopo alluvial fan that has been earmarked for cropland development is included based on the results of previous research in the area; The mean annual rainfall for the region is 125 mm.yr-1 with a coefficient of variation of 59 per cent. Mean annual rainfall increases only marginally from west to east but slightly more from the Orange River basin (75 mm.yr-1) to the northern borders of Riemvasmaak (145 mm.yr-1). Long-term rainfall data for the period 1918-1994 is presented for two rainfall stations situated close to Riemvasmaak and indicate large fluctuations in annual rainfall totals. In some years, less than 25 mm was recorded while for 1976 more than 350 mm was measured. This very high rainfall period, from 1972-1976 coincided with the period when the Riemvasmakers were removed from the region in 1973/74; The Molopo River catchment area is the largest of the four main catchment areas which decrease in size from the Bak, Kourop and Orange River catchments respectively. The water points, including boreholes, dug wells, fountains, natural vii
•
•
•
•
•
•
•
• •
•
springs as well as the Riemvasmaak Hot Spring are mapped and details of each water point is synthesized from previous reports. Only three of the twenty water points sampled by Toens (1994) contained potable water; A lengthy description of the methodology used in the baseline survey is presented to enable future workers to re-sample the area. Our itinerary is presented in Appendix 1. We adopt a landscape approach and couple photographs with our sample plots. 29 photostations provide the basis of our vegetation and landform classification analysis. Details of the photostations and the main view (photograph) used at each photostation are provided in Appendix 8; With the assistance of aerial photographs, five main landforms are mapped: the Plateau (26 % of the area); Rocky slopes (25 %); Rocky footslopes and rocky pediments (34 %); Sandy pediments (14 %); and River beds (1.4 %) with inselbergs forming a sixth rather minor unit; The general composition and dominant species associated with each landform are presented in Appendix 2 and described in the text. A checklist comprising 443 plant species is contained in Appendix 3. None of the species are listed as Endangered or Vulnerable in the Red Data book. A stylized diagram shows Euphorbia gregaria dominating the plateau and rocky slope environments with Acacia mellifera and Stipagrostis spp. common on the sandy pediments. Three variations of the River beds, differing in their species composition are proposed; An analysis of the size class distributions of three important range species (Acacia mellifera, Acacia erioloba and Schotia afra) shows that there has been much recruitment in all three species in the last twenty years and these species have “benefited” greatly from the absence of domestic stock. The widespread recruitment of these species may also be closely linked to the high rainfall period between 1972-1976; The widespread distribution of the alien leguminous shrub Prosopis spp. is highlighted. Because of its potential threat to the production potential as well as to the hydrology of the region we recommend its immediate eradication from the open range and the release of seed-eating weevils to reduce the further spread of the species in Riemvasmaak; A preliminary checklist of reptiles and amphibians comprising 11 frogs, 2 tortoises, 1 turtle, 19 snakes and 35 lizard species is shown in Appendix 4. Three Peripheral and one Rare species are listed while no Endangered or Vulnerable Red Data book species were identified; 192 bird species have been recorded in and around Riemvasmaak and the checklist is shown in Appendix 5. The Red Data book status of three species is listed as Vulnerable, while a further 2 species are listed as Rare. The status of 3 species is unknown (Indeterminate) but is also probably Rare; We observed 72 birds during the course of the survey and their abundance at this time is listed; A checklist of 51 mammal species for the Riemvasmaak and Augrabies Falls National Park regions is presented in Appendix 6 of which one species (the black rhinoceros) is Endangered, 2 are Vulnerable, 2 are Rare and one is listed as Indeterminate in the South African Red Data book for mammals; We observed 12 mammal species in the field during our survey and their abundance and locality as well as that of domestic livestock is also shown in
viii
• •
•
•
• •
•
•
Appendix 6. The most common wild ungulate was the klipspringer and 89 individuals were recorded; 474 goats, 20 sheep, 12 head of cattle; 3 horses and 24 donkeys were seen by the survey team; The results of a helicopter survey conducted by the National Parks Board are presented in Appendix 7 and show that for Riemvasmaak in March there were 31 gemsbok, 64 kudu, 26 springbok, 5 steenbok and 7 klipspringer although the abundance of the last species was clearly underestimated; The grazing environment of Riemvasmaak is described. Firstly, we suggest that based on our understanding of the composition, structure and abundance of important forage species, the vegetation of Riemvasmaak is in an “excellent” condition. It has benefited greatly from the 20 years without domestic livestock and this view is corroborated by the testimony of the Riemvasmakers who have returned to the region. However, the sandy pediments in the east, that were used by the military for their mechanized infantry manouvres appear heavily disturbed; The range potential and carrying capacity of Riemvasmaak are calculated from standard agricultural models which have historically been applied to commercial farms. Recognizing their limitations in a communal land context we nonetheless show that the relationship between long-term annual rainfall data and stocking rate indicates that about 60 ha will be needed to support one Large Stock Unit (LSU) at Riemvasmaak. This sums to 1 243 LSU’s (1 130 mature cows or 7 312 Boer goats) for the area. If the 4 270 ha currently leased to the National Parks Board is excluded from the calculation then the recommended carrying capacity drops to 1 172 LSU’s (1 065 head of cattle or 6 894 goats); Using standard methods for estimating carrying capacity we show that, of all the landforms it is the undisturbed sandy pediments and dry river beds (i.e. the bottomlands) that are able to support the most number of animals; If the carrying capacity and size of each landform is included in the calculation of carrying capacity for Riemvasmaak then only 1 028 LSU’s (935 cattle or 6 047 goats) can be supported on the available range. These values are in agreement with stock numbers that were censused in 1960/61 at the height of a severe drought but three times lower than the Riemvasmakers themselves claimed they possessed in “Old Riemvasmaak”. We explore this apparent contradiction in Chapter 2; The economic analysis of the livestock industry presented by the Department of Agriculture and based on a commercial farming enterprise shows that the gross income from the livestock industry at Riemvasmaak could amount to R684 000 per year. If costs of 60 % are subtracted from this total then a profit of R273 600 or R60-80 per ewe results We conclude this chapter by recommending (a) that the wide interest shown by the Riemvasmakers in owning stock be understood and accepted by all involved in the area; (b) that the general aridity of the region cannot accommodate all interested livestock farmers and the allocation of grazing resources to full-time and part-time farmers is going to be problematic; (c) consensus must be reached amongst livestock farmers concerning stock numbers; (d) no one magic number (e.g. 60 ha/LSU) should dominate the debate as stock numbers should probably track environmental conditions; (e) the establishment of an elected, respected and
ix
influential “stock committee” or similar such institution will probably be the key to the success of the livestock industry’s future. CHAPTER 2: LANDUSE HISTORY • • • • •
•
•
•
•
• •
This chapter presents an archaeological and historical landuse continuum for the region summarized in a general chronology from pre-history to the present; Prior to the ancestors of the present inhabitants of Riemvasmaak settling in the area the Orange River itself was home to a mixed group of Khoikhoi pastoralists and San hunter-gatherer-fishers; By all accounts the area carried abundant game although domestic livestock probably didn’t graze away from the river itself; The results of an archaeological survey conducted by the SADF during their term of tenure are presented and show a wealth of archaeological artefacts in the region; We recommend that there is an urgent need to have the region comprehensively surveyed by an experienced archaeologist especially those areas that have been earmarked for cropland development near the Molopo River mouth. The archaeological history could form an important part of the ecotourism potential of the region; A brief history and chronology of the settlement of Riemvasmaak is provided which suggests that the ancestors of the majority of the current inhabitants of Riemvasmaak arrived in the area from many different regions in southern Africa from about the 1870’s onwards; A discussion of the landuse practices in “Old Riemvasmaak” begins with an analysis of the stock numbers owned by Riemvasmakers in 1960/61, 1973/74 and in 1994. Problems with each of the data sets are described. The data show that stock numbers have changed from a low of 974 LSU’s in 1960/61 to a high of 3593 LSU’s in 1973/74. In 1994 the Riemvasmaak farmers in exile possessed 1302 LSU’s. Differences in the composition of the herds associated with each village in “Old Riemvasmaak” (?1973/74 ) suggest that goats were preferred by livestock owners at or near the river while sheep became common in the herds of farmers living away from the river. Donkeys were only abundant in the herds around the Mission Station while cattle numbers were never high; Who owned livestock in “Old Riemvasmaak”? Our analysis shows that only 8 of the 318 household heads censused in 1960/61 gave their occupation as “veeboer”. The majority of household heads worked as farm workers on the numerous islands of the Orange River. However, it was this group of people who possessed the majority of animals at Riemvasmaak even though each person only owned about 6 goats; Local testimony of a number of farmers at Riemvasmaak was used to reconstruct key aspects of the land tenure and grazing management practices in the years before 1973/74; The functioning of the Mr Jacob Booysen as the Hoofman in the land allocation and grazing management system of “Old Riemvasmaak” is outlined. His role and that of the “voormanne” who helped him govern the region from 1934 until his death in 1972 was integral to the entire landuse system of the area;
x
•
•
•
• •
•
• •
No internal limits appear to have been placed on stock numbers although the state introduced a “head tax” as well as set maximum stock numbers (50 goats, 5 cows, 4 donkeys) to discourage too many animals on the range. Although transgressors were severely punished in the 1940’s it is unclear whether the law was enforced in later years. Oral testimony suggests that as many as 800 goats were owned by a single farmer during the 1950’s; The most important resting system applied was that which set aside large areas of Riemvasmaak, always the productive bottomlands, for the exclusive use of large bulk grazers such as cattle and donkeys. Sheep and goats were not allowed to graze in these “spaarveld” areas without the permission of the Hoofman and then only during a drought; Livestock owners from different parts of Riemvasmaak employed different strategies to deal with the severe droughts which ravaged the area. Those living in and around the Riemvasmaak Mission Station made use of the Orange River while livestock owners living in Deksel and Bok se Puts made use of veeposte (stock posts) where perennial springs were available; The marketing of livestock was non-existent in some areas and the livestock owners were severely exploited by local speculators; Conflicts between livestock owners appeared to have been few and far between. During the mid-1960’s, however, conflict over grazing resources in one area is outlined and the central role that Mr Booysen apparently played in resolving this conflict is described; The results of a re-survey of John Acocks’ sample sites which he visited in 1952 is presented in the text and in Appendix 10. One of the sites exists within the communal land of Riemvasmaak while the other borders the reserve on the south east. Both of the sites show a large decrease in diversity between the two time periods although the site in Riemvasmaak itself appears to have “lost” fewer species than the site in the commercial farmland. It is difficult to explain the changes that we observed at these two sites although overgrazing by domestic livestock is the hypothesis we favour most. Three matched photographs illustrate the nature of the changes that we have measured at these sites; The impact of the 8 South African Infantry Training Unit, Armscor and the South African Airforce on the vegetation of Riemvasmaak is describes and a map of their activities presented; Finally, we use our understanding of the historical landuse practices to comment on the future. We suggest that the Orange River environment could form an integral part of the livestock industry in Riemvasmaak but that one of the greatest challenges faced by FARM Africa lies in the incorporation of the part-time farmers into the livestock industry. We suggest that any new institution which has a role in the management of the livestock industry in Riemvasmaak should be aware of the region’s livestock management history.
CHAPTER 3: A PROPOSED MONITORING PROGRAMME • •
There is a general paucity of advice on how to develop a monitoring programme, especially for communal lands; We suggest a number of elements that should be considered. The first relates the need of the programme. Who needs it and who stands to benefit?
xi
•
•
• • •
•
•
Next, we explore the aims of the programme and propose the following objectives: “The purpose of the monitoring programme is to provide the Riemvasmaak community with sufficient knowledge about the state of their environment (including climate, vegetation, stock condition, crop yields and market forces) at any one time so that informed decisions can be made by all Riemvasmakers, from household to village to community level, about their various agricultural enterprises”; Six main variables or indicators of change are suggested: Climate (rainfall, temperature), Water (quantity & quality), Vegetation “condition” (using matched photographs, key species abundances and demonstration plots) , Livestock (movements, births and deaths and market trends), Croplands and Community health. The location, sampling intensity and frequency, and type of measurement that will be required as well as the proposed responsible person(s) involved are also discussed; Pitfalls regarding data analysis and interpretation are highlighted and the use of participatory methods to present the results of the programme are emphasized; A preliminary budget is provided which suggests that capital equipment expenditure would amount to R51 000 while annual running costs will be about R40 000 including the salary of a Monitoring Warden drawn from the local community; The role of the Monitoring Warden will be crucial to the success of the programme. This individual would see to the day to day running of the programme and could also act as an important link with the Agricultural Extension Services facilitating technology transfer if and when needed by the communal farmers The selection and training of a Monitoring Warden should commence as soon as possible and the necessary infrastructure be developed between August and December 1995. By the beginning of 1996 the monitoring programme could begin.
CHAPTER 4: BIBLIOGRAPHY OF RIEMVASMAAK LITERATURE • • •
24 articles which deal specifically with the history and agricultural potential of Riemvasmaak are listed; Details of 26 press clippings relating to community life, the removal, resettlement and the present are provided; Finally, reference to the general scientific and popular literature as well as numerous unpublished reports which deal with the history and natural resources of Gordonia district, the Kalahari ecosystem and the greater Orange River environment is given. This list comprises 95 articles.
xii
TABLE OF CONTENTS PREFACE
i
ACKNOWLEDGEMENTS
v
EXECUTIVE SUMMARY
vii
CHAPTER 1: THE BASELINE SURVEY 1.1
Introduction
1-2
1.2
Location, settlements, place names and infrastructure
1-2
1.3
The physical environment 1.3.1 Geology 1.3.2 Mining 1.3.3 Soils 1.3.4 Climate 1.3.5 Hydrology and water sources
1-7 1-7 1-11 1-15 1-19 1-24
1.4
The biotic environment 1.4.1 Vegetation 1.4.1.1 General methodology 1.4.1.2 Landform classification 1.4.1.3 Vegetation associated with landforms 1.4.1.4 Size class distributions of key species 1.4.1.5 Alien plant control 1.4.2 Reptiles and amphibians 1.4.3 Birds 1.4.4 Mammals
1-30 1-30 1-30 1-33 1-36 1-45 1-52 1-58 1-58 1-59
1.5 The grazing environment 1.5.1 Veld “condition” 1.5.2 Range potential and carrying capacity 1.5.3 Economic potential of the livestock industry
1-60 1-60 1-62 1-67
1.6
1-69
References
CHAPTER 2: LANDUSE HISTORY 2.1
Introduction
2-75
2.2
The archaeological and historical record
2-77
2.3
Settlement at Riemvasmaak
2-81
xiii
2.4
Landuse practises in “Old Riemvasmaak” 2.4.1 Stock numbers 2.4.2 Land tenure and grazing management 2.4.3 Vegetation change since 1952: Acocks revisited
2-84 2-84 2-89 2-94
2.5
Military occupation: The last 20 years
2-102
2.6
The future
2-106
2.7
References
2-107
CHAPTER 3: THE DEVELOPMENT OF A MONITORING PROGRAMME FOR RIEMVASMAAK 3.1 Introduction
3-110
3.2
Key elements of a monitoring programme
3-110
3.3
Need
3-111
3.4
Purpose
3-111
3.5
Methods 3.5.1 Climate 3.5.2 Water 3.5.3 Vegetation 3.5.4 Livestock 3.5.5 Croplands 3.5.6 Community health
3-112 3-114 3-115 3-115 3-115 3-116 3-116
3.6
Analysis, interpretation and presentation
3-116
3.7
Capital equipment and infrastructural costs
3-117
3.8
Training
3-119
3.9
Programme initiation
3-119
3.10 Operation
3-119
3.11 Termination
3-120
3.12 References
3-130
xiv
CHAPTER 4: BIBLIOGRAPHY OF LITERATURE PERTAINING TO RIEMVASMAAK AND SURROUNDING AREAS WITHIN THE DISTRICT OF GORDONIA, NORTHERN CAPE 4.1 Articles which deal specifically with the history and agricultural potential of Riemvasmaak
4-122
4.2 Press clippings about Riemvasmaak
4-123
4.3 Published scientific and popular articles and unpublished reports which deal with the history and natural resources of Gordonia district, the Kalahari ecosystem and the greater Orange River environment.
4-125
APPENDIX 1: The itinerary of the ecological survey team between 16-30 January, 1995. APPENDIX 2: The percentage cover of species within sites and landforms in Riemvasmaak (see back cover). APPENDIX 3: Checklist of plants in Riemvasmaak and Augrabies Falls National Park. APPENDIX 4: Checklist of amphibians and reptiles at Riemvasmaak and surrounding areas. APPENDIX 5: Checklist of birds recorded for Riemvasmaak and the Augrabies Falls National Park, and an annotated list of birds recorded at Riemvasmaak between 17-29 January, 1995 by the survey team. APPENDIX 6: Checklist of mammals for Riemvasmaak and surrounding areas and the type, number and locality of the 12 mammal species that were observed by the survey team between 17-29 January, 1995. APPENDIX 7: List of mammal species and their abundances determined by the National Parks Board during helicopter surveys in “Bokvasmaak” and Riemvasmaak in March 1995. APPENDIX 8: Description of photostations in Riemvasmaak. APPENDIX 9: Large Stock Unit (LSU) equivalents of grazing animals. APPENDIX 10: Checklist and abundance classes of plant species collected by John Acocks in May 1952 at two localities in and adjacent to Riemvasmaak and resurveyed by the National Botanical Institute’s survey team in January 1995.
xv
LIST OF FIGURES Fig. 1.1. Location, settlements, infrastructure, place names and general topography of Riemvasmaak derived from a composite of 1:50 000 topographical maps: 2820 AC, 2820 AD, 2820 CA, 2820 CB. Fig. 1.2. Place names in “Old Riemvasmaak” including those of topographic features, settlements and veeposte. Table 1.1 provides a translation and interpretation of many of the names shown. Fig. 1.3. The geology of Riemvasmaak enlarged from the 1:250 000 Geological Series 2820 Upington map (Moen, 1988). Fig. 1.4. Major geological groups comprising the Riemvasmaak environment. Fig. 1.5. Occurrence of minerals at Riemvasmaak. (See also Von Backstrom (1967) for a more detailed account of mining operations in the area). Fig. 1.6. Soil unit map of the Molopo alluvial fan (redrawn from Van Niekerk (1994)) showing the distribution of regions with moderate to high irrigation potential (dots) and those with moderate, moderate to low and low irrigation potential (left blank). Rocky, mountainous terrain is indicated by diagonal lines; D = drainage line of Orange River, Molopo River or smaller tributaries of these two rivers. Soil unit map symbols are those used in Table 1.3 where details of the soil units are presented. Star indicates position of photostation 12. Fig. 1.7. Walter-Leith climate diagram for Augrabies close to the south eastern boundary of Riemvasmaak. a = climate station: [rainfall data are taken for the period 1946-1994 from Augrabies village (station number 0281760 1) (28°40’S 20°26’E) while temperature data are for the period 1984-1994 and are from Augrabies Water Falls (station number 0281606 0) (28°36’S 20°21’E) some 14 km northwest of Augrabies village]; b= height above sea level (Augrabies village = 640 m; Augrabies Water Falls = 626 m); c = duration of observation in years (the first figure indicates temperature, the second, precipitation); d = mean annual temperature; e = mean annual precipitation; f= mean daily maximum temperature of the warmest month; g = mean daily temperature variations; h = mean daily minimum temperature of the coldest month; i = curve of mean monthly temperature; j = relative period of drought; k = curve of mean monthly precipitation. Fig. 1.8. Mean annual rainfall for Riemvasmaak and surrounding areas calculated from CCWR (1994) modeled data. Fig. 1.9. Total annual rainfall (histograms) and three-year running mean (solid line) for Augrabies village (station number 0281760 1) (28°40’S, 20°26’E) for the period 1946-1994 and for Geelkop (station number 0283098 3) (28°38’s, 21°04’E) for the period 1918-1988.
xvi
Fig. 1.10 Percent deviation from mean long-term rainfall at Augrabies village (station number 0281760 1) (28°40’S, 20°26’E) for the period 1946-1994 and at Geelkop (station number 0283098 3) (28°38’s, 21°04’E) for the period 1918-1988. Fig. 1.11. Catchment areas of the four main river systems in Riemvasmaak: 1 = Bak River; 2 = Kourop River; 3 = Molopo River; 4 = Orange River. Fig. 1.12. Location of different water sources in Riemvasmaak. Numbers refer to those in Table 1.6. Fig. 1.13 Location of 29 photo stations in Riemvasmaak. Large circles show the general area covered by the images, small dot indicates approximate position of photostation and line indicates the direction of the “main” photograph and sample area. Fig. 1.14. Major landforms in Riemvasmaak: blue = Plateau; purple = Steep slopes; red = Rocky footslopes, rocky toeslopes and rocky pediments; yellow = Sandy pediments; green = River beds. Fig. 1.15. Generalized view of vegetation associated with different landforms in Riemvasmaak. Fig. 1.16. Size class distributions of a population of Acacia mellifera on a sandy pediment at photostation 6. Fig. 1.17. Size class distributions of Acacia erioloba populations recorded at six different photostations in Riemvasmaak. Filled sections indicate dead individuals while hashed sections show the number of individuals in a size class which had one or more pods. Fig. 1.18. Size class distributions of a population of Schotia afra in a rocky river bed at photostation 4. Fig. 1.19. Location of Prosopis glandulosus populations observed between 16-31 January 1995 at Riemvasmaak.
Fig. 2.1. Location of Stone Age (dots) and Pastoralist (circles) archaeological sites in Riemvasmaak as indicated in the preliminary survey data in the South African Defence Force (1990) report. The absence of archaeological sites in places such as the upper Kourop River Valley and lower Bak River simply means that these areas have not been surveyed. See Table 2.2 for a description of the sites. Figure 2.2. The distribution of different types of military activity during the South African Defence Force’s tenure of Riemvasmaak between 1974-1994.
xvii
LIST OF TABLES TABLE 1.1.
Place names and their meaning in “Old Riemvasmaak”.
TABLE 1.2. The geology and lithology of Riemvasmaak (after Moen, 1988). TABLE 1.3. A description of soil units on the Molopo alluvial fan indicating their geomorphological position, dominant soil form, map symbol (see Fig. 1.6) and their irrigation potential (L = Low; M-L = Moderate to Low; M = Moderate; M-H = Moderate to High). Information for this table has been compiled from data in Van Niekerk (1994). TABLE 1.4. Results of an analysis of soil samples from 12 sites in Riemvasmaak. Number refers to the photostation number (see Appendix 8) and the letter refers to the landform wherein the soil sample was taken. Landform abbreviations are Rf = rocky footslope, Sp = Sandy pediment, Pl = Plateau, Pa = Pan on plateau, Rb = River bed. The soils are all loamy sands except for 5c which is a sandy clay loam. TABLE 1.5. The % cover and area (ha) of each river catchment in Riemvasmaak. TABLE 1.6. Water quality and other characteristics of water sources (boreholes, dug wells (= put), springs (= fonteine) and natural waterholes)) in Riemvasmaak. TABLE 1.7. The % cover and area (ha) of each land form in Riemvasmaak TABLE 1.8. Characteristics of the three Prosopis species that occur in the arid zones of southern Africa (information from Harding, 1987; Poynton, 1990). TABLE 1.9. Size class distributions of Prosopis spp individuals seen at photostations in Riemvasmaak. TABLE 1.10. Mean percentage cover (+ std. dev.) and mean Grazing Index Score (+ std. dev.) for 96 sites encompassing different landforms and their variations at Riemvasmaak. TABLE 1.11. Number of cattle or large stock units (LSU) able to be accommodated within different landforms at Riemvasmaak assuming a mean Grazing Index Score (GIS) for the 74 563 ha reserve of 120.6 equivalent to the recommended stocking rate of 60 ha/LSU. TABLE 2.1. General chronology of key historical events relating to land tenure, management and landuse practices in Riemvasmaak and the broader Middle Orange River environment (taken in part from Smith & Bozalek, 1993). TABLE 2.2. List of site numbers and description of archaeological sites in Riemvasmaak (from SADF (1990)). Abbreviations are: ESA = Earlier Stone Age, MSA = Middle Stone Age, LSA = Later Stone Age, OES = Ostrich Egg Shell.
xviii
TABLE 2.3. Number of domestic livestock and their Large Stock Unit (LSU) equivalents in Riemvasmaak in 1960 (unpublished census data), in “Old Riemvasmaak” probably around 1973/74 (see Isaacs & Phillips, 1994) and held by Riemvasmakers in exile in 1994 before their return to Riemvasmaak (unpublished records, Surplus People Project). LSU conversion factors are for adult animals (see Appendix 9, Table 2.4). TABLE 2.4. Number and per cent (in brackets) of the total number of livestock in and around different settlements in “Old Riemvasmaak” as reported by the “Blue Group” in the PRA workshop held on 19 May 1994 (data in Isaacs & Phillips, 1994). LSU conversion factors are for adult animals (see Appendix 9). TABLE 2.5. Mean number of livestock (+ std. dev.) owned by 318 household heads censused in 1960/61 according to their occupation listed in the census records. Mean values for the number of horses and mules owned by different occupation groups were never above 1.6 animals and usually below 0.3 and these livestock categories have therefore been excluded from this table. LSU values include horses and mules and use conversion factors for mature animals (Appendix 9). TABLE 2.6. Comparison of changes between Acocks’ May 1952 sample data and that of the National Botanical Institute’s (NBI) Jan 1995 survey team at two Photostations in Riemvasmaak (see also Appendix 10).. TABLE 2.7. Dates in 1989 and kind of activities carried out by three military organizations using Riemvasmaak as a training facility. Table 3.1. Key variables that could be monitored at Riemvasmaak with some indication of their sampling intensity, location and frequency, the type of measurement and units needed and the individual(s) or agency responsible for the task. TABLE 3.2. Capital equipment and some of the running costs associated with the monitoring programme.
xix
LIST OF PLATES PLATE 1.1. National Botanical Institute members of the survey team and authors of this report: Clockwise from upper left: Barry Jagger, Dan Sonnenberg, Jeanne Hurford and Timm Hoffman. PLATE 1.2. Flat, stony landscape of the plateau between Riemvasmaak Mission Station and Deksel. The landscape is dominated by Euphorbia gregaria with a number of species including Monechma spartioides, Boscia foetida, Panicum arbusculum and Sarcostemma viminale as common elements. The pan in the mid-ground depression is obscurred by a fringe of 2-3 m high Parkinsonia africana trees. Part of panorama of photostation 5. PLATE 1.3. Steep rocky slopes below the plateau dominated by Euphorbia gregaria, Stipagrostis uniplumis and Monechma spartioides. The witgatboom (Boscia albitrunca) which dominates the right foreground is frequently associated with the rocky slope environments. PLATE 1.4. Rocky pediment below the Kouropberg about 1km south of Deksel. The vegetation is dominated by Euphorbia gregaria, Acacia mellifera, Monechma spartioides and Stipagrostis uniplumis. PLATE 1.5. Broken topography and rocky pediment below the plateau near the Molopo gorge about 2 km southwest of the Riemvasmaak Mission Station. The vegetation is dominated by Euphorbia gregaria and Stipagrostis uniplumis on the interfluves and by Schotia afra in the narrow and rocky river valleys. PLATE 1.6. Sandy pediment 5 km north of the Riemvasmaak Mission Station dominated by Acacia mellifera, Stipagrostis uniplumis and Rhigozum trichotomum. This photo represents site 6a of photostation 6. It is also the site where Acacia mellifera size classes were measured (see Fig. 1.16) PLATE 1.7. Wide and sandy river bed about 4.5 km north of the Riemvasmaak Mission Station dominated by Stipagrostis namaquensis in the foreground and Acacia erioloba in the distance. This photo represents site 6b of photostation 6. PLATE 1.8. Wide and saline river bed near the confluence of the Molopo and Orange Rivers close to photostation 12. The vegetation is dominated by Tamarix usneoides, Euclea pseudebenus and Acacia mellifera. PLATE 1.9. Narrow and rocky river bed about 8 km north of Riemvasmaak Mission Station at the point where the road ascends the plateau. The vegetation is dominated by Schotia afra, Acacia mellifera and Cyperus marginatus. PLATE 1.10. An isolated pocket of Kalahari sand little more than 500 m2 dominated by Stipagrostis ciliata and Rhigozum trichotomum (foreground) and Euphorbia gregaria (mid-ground).
xx
PLATE 1.11. Recruitment of Acacia erioloba saplings at old kraal sites near Deksel. The 2 m tall ranging rod in left midground marks the deep dung deposits of an old kraal while Jeanne points to a 1.6 m tall Schotia afra sapling. Note the dominance of mature Acacia erioloba trees in the river course in the right background (see Fig. 1.17, site 3). PLATE 1.12. David Catling of FARM Africa providing scale for the recruitment of a cohort of Acacia erioloba saplings near Gyam/Vaalputs (see Fig 1.17, site 24). PLATE 1.13. Mr Willem Vass standing in front of a single large Prosopis glandulosus individual near Xubuxnap. The large trees in left and right background are all Acacia erioloba individuals while the saplings in the foreground are all Acacia mellifera individuals. PLATE 2.1. Unmarked grave sites south of Deksel in the Kourop River valley. PLATE 2.2. Mr Willem Vass at Xubuxnap sitting on the ruins of his father's oxwagon that was brought to the area in 1939. PLATE 2.3. Matched photograph pair at photostation 25 taken about 7 km east of Wabrand looking west towards the Orange River. The top photograph was taken by John Acocks (#5563) on 22 May 1952 while the lower image was taken on 27 January 1995 (see text for a discussion of the major changes in the landscape). PLATE 2.4. Matched photograph pair at photostation 25 taken from the same camera position as in Plate 2.3 but looking north along the "priest's road winding down the hill." Photographers and dates are the same as for Plate 2.3 (Acocks #5564). (See text for a discussion of the changes). PLATE 2.5. Matched photograph pair of photostation 25 taken from the same camera position and by the same photographers as indicated in Plate 2.3 but looking east (Acocks #5565). (See text for a detailed discussion of the changes in the images). PLATE 2.6. Sandy pediment near Gyam/Vaalputs. The dominance of the landscape by Rhigozum trichotomum suggests that heavy disturbance of the environment has occurred in the past. This may possibly be related to the mechanized infantry manoeuvres or arms-testing exercises carried out during the SADF's tenure of the region.
[PHOTOGRAPHS OF PHOTOSTATIONS 1-29 ARE ALSO SHOWN IN APPENDIX 8]
xxi
Chapter 1 : THE BASELINE SURVEY 1.1
Introduction
1.2
Location, settlements, place names and infrastructure
1.3
The physical environment 1.3.1 Geology 1.3.2 Mining 1.3.3 Soils 1.3.4 Climate 1.3.5 Hydrology and water sources
1.4
The biotic environment 1.4.1 Vegetation 1.4.1.1 General methodology 1.4.1.2 Landform classification 1.4.1.3 Vegetation associated with landforms 1.4.1.4 Size class distributions of key species 1.4.1.5 Alien plant control 1.4.2 Reptiles and amphibians 1.4.3 Birds 1.4.4 Mammals
1.5 The grazing environment 1.5.1 Veld “condition” 1.5.2 Range potential and carrying capacity 1.5.3 Economic potential of the livestock industry 1.6
References
1-1
1.1
INTRODUCTION
Agricultural development programmes require a comprehensive knowledge of the region’s natural resources. Information about the geological, climatic, ecological and agricultural environment is essential if the full potential of an area is to be developed. There is already a considerable body of literature pertaining to Riemvasmaak and the general surrounds of Gordonia (see bibliography). However, much of it is unpublished and exists in difficult-to-locate internal reports. One of our first tasks, therefore, was to synthesize this information in one document and to develop a broad overview of the region’s environmental resources and potential. In addition to this synthesis we have also reported on the results of a baseline survey conducted in mid to late January 1995. An itinerary of this expedition is provided in Appendix 1. A description of major landforms within Riemvasmaak and their associated vegetation is summarized in this chapter. Also, the abundance of key forage species is analyzed and the potential danger posed by the invasive alien genus, Prosopis, is discussed. The difficult and contentious debate around veld “condition”, range potential and carrying capacity is addressed in this chapter and we conclude with a discussion of the economic potential of the proposed livestock industry at Riemvasmaak.
1.2
LOCATION, SETTLEMENTS AND INFRASTRUCTURE
Riemvasmaak is located in the Northern Cape province of the Republic of South Africa (Fig. 1.1). It lies between 28° 13' and 28° 32' S and between 20° 00' and 20° 25' E. Riemvasmaak is 74 562.8124 ha in extent (Van Zyl & Van Zyl, 1994). It is bordered in the west by Namibia and in the north by the privately-owned, commercial farms of Aries, Narougas and Enna. Similarly, a number of commercial farms including Waterval and Omdraai form the eastern boundary of the reserve. The perennial waters of the Orange River form the southern border of Riemvasmaak. On the southern banks of the river itself the table grape-producing farms of Zeekoeisteek and Blouputs occur. The southeastern border is comprised of the Augrabies Falls National Park, a tourist and conservation enterprise owned and administered by the National Parks Board. Part of Riemvasmaak itself is also currently leased to the National Parks Board as part of an agreement with the Riemvasmaak Trust. This region, of about 4 270 ha, forms the extreme southeastern section of Riemvasmaak. It has become known as “Bokvasmaak” or the “Melkbosrandgebied” and is bordered in the south by the Orange River and in the north by the low ridge marked as │Haodaos in Fig. 1.2. A number of farmers, who lived in the settlements in this area prior to their removal in 1974, are unhappy with the fact that they are denied access to this land. An acrimonious protest has recently developed over the lease agreement. A number of fairly widely-dispersed permanent settlements occurred in "Old Riemvasmaak" the largest of which remains the Riemvasmaak Mission Station itself (Fig. 1.1). Historically, Bok se Puts, Deksel and Xubuxnab were the next largest villages and are all located near permanent water supplies within the Bak, Kourop and Orange River valleys respectively. In the southeastern part of Riemvasmaak, in the region now leased to the National Parks Board, the small but permanent settlements of Wabrand and Melkbosrand were situated. Two smaller settlements, probably better described as homesteads, existed in the northeastern parts of Riemvasmaak. These are
1-2
Gyam/Vaalputs and Perdepoort. There were no permanent settlements on the plateau, presumably because there is no permanent water in this environment. A rudimentary road network exists within Riemvasmaak. However, for much of the region it has degenerated to such an extent that it is only negotiable by means of an off-road vehicle or donkey cart (see Hawkins et al 1994). Some of the place names shown on the 1:50 000 topographic maps published by the Chief Director of Surveys and Mapping are not recognized by the Riemvasmakers. For example, Riemvasmaakkop is known locally as Groot Rooiberg or Kai │nabab, while Donkieboud is better known as Donkiemond. There are also errors of location. For example, Twakputs did not exist along the banks of the Orange River but according to local testimony was located further inland. To clarify some of these inaccuracies and to develop a better understanding of the names and locations of settlements, physiographic features and stock posts (veeposte) an informal workshop was held on the 5 May 1995. Mr Hans April, Mr Dawid Isaacs, Mr James Mapanka, Mr Pieter Malgas, Mr April Silwer, Mr Jan Silwer and Mr Gys Simon assisted in the identification and pronunciation of key place names in “Old Riemvasmaak.” Ms Claudia Simon who learnt to read and write Damara at school acted as the scribe. The place names are shown in Fig. 1.2 and described in Table 1.1. This clearly only scratches the surface of the wealth of nomenclatural information that exists for the region. None of the people who helped in the identification of place names had knowledge of the whole of Riemvasmaak. Some parts of the reserve were poorly known and because of this, some inaccuracies and omissions have undoubtedly occurred. We suggest that a group of the older members of the community be taken around the region with the express purpose of establishing the boundaries and more accurate locations and terminology of the key features in Riemvasmaak. As discussed in Chapter 2 this has important implications in understanding the grazing strategies employed in “Old Riemvasmaak”.
1-3
Fig. 1.1. Location, settlements, infrastructure, place names and general topography of Riemvasmaak derived from a composite of 1:50 000 topographical maps: 2820 AC, 2820 AD, 2820 CA, 2820 CB.
1-4
Fig. 1.2. Place names in “Old Riemvasmaak” including those of topographic features, settlements and veeposte. Table 1.1 provides a translation and interpretation of many of the names shown.
1-5
Table 1.1. Damara and Nama place names and their meanings in “Old Riemvasmaak”. Afrikaans place names are not listed here but are shown in Fig. 1.2. Name Kai │nabab !Ôraros │Nabagu Tsu!aos │Nûb !Nun║gaes Kaivlei │Naruxas Matroos║as │i║khoêb Tabetamés ╪Nudaob !Nu║khais !Nu-║naes !Noi╪nâras Doë!nas ╪Ôs ╪Narun|khais ║Nana║as ║Hôb Khukao║Nab Aogu║khoe!nab ║Nam!haob │e║haob Twakputs │Hus !Nugu║ais │Hurugus Khunigu╪nubib !Haodaos
Remarks Also known as “Groot Rooiberg”, (from Kai = groot or big) and called “Riemvasmaakkop” on 1:50 000 topographical maps. “Vlaketjie” (little flat land or depression). “Rooies” (reddish or red ?region). Also known as Sagtehoek. Meaning unknown. “Sandgat” (sand hole or well perhaps). “Grootvlei” (large vlei or marsh). “Vol biesies” (full of reeds - probably Mariscus marginatus). Someone’s surname-Matroos, and from “║as” = kloof or narrow valley or ravine. “Maanhaarjakkals se plek” (place of the aardwolf, Proteles cristatus). “Abwikaboom” (Tamarix usneoides tree). “Ver pad” (long or far road. From “daob” = pad or road). Located somewhere north of Bok se Puts. “Swartbevolkings tradisionele dans” (black community’s traditional dance from “║khais” = traditional dance). Also known as “Wildehondsekloof” (wild dog’s kloof). !Noi (boom) kraal (kraal made out of !Noi (Acacia mellifera). “Iets soos ‘n intrek” (something like a hauling in, gathering or settlement). “Spreekword” (a saying or proverb). “Houtstomp is nie daar nie” (“the tree stump isn’t there”). Also known as Kameeldoringhoek. Meaning unknown. Also known as Skaaphoringkloof. “Waar die manne lê” (“where the men lie” - casualties from the German war. “Waterbank” (water ridge). “Erdmanshoek” (from “erdman” = ground squirrel). Also known as ╪Nus!nâb. Means fountain. Meaning unknown. “Hy is vergeet” (“he (or maybe “it”) is forgotten”) - also known as “Blok Twee”. More commonly known as Wabrand. “Bankpad” (ridge road).
1-6
1.3
THE PHYSICAL ENVIRONMENT
1.3.1 Geology A clear interpretation of the geology of Riemvasmaak is crucial for an understanding of the various landforms of the region since they exist largely as a direct consequence of the geological environment. Although fairly complex in detail (Fig. 1.3, Table 1.2) (see also Von Backstrom, 1967; Gerringer & Botha, 1975) the geology of the region is easily understood when collapsed into its main lithological groups (Fig. 1.4) which together span a tremendous age range. The oldest group of rocks is represented by the basement material of the Namaqualand Mobile Belt which dates to about 1.1 billion years. These are sedimentary, volcanic and intrusive rocks. Following the collision of the original continental material or Kaapvaal craton with other major blocks to the north of it (e.g. the Zimbabwe craton) an unstable region called a mobile belt or geosyncline was created. The sedimentary and volcanic rocks of the Koronnaland sequence and Hartbees River complex were deposited within this region at the time and the intrusive rocks of the Keimoes and Eendhoorn suites are also related to this collisional event. Subsequent erosion over millions of years has exposed both the basement gneisses and other material of the Namaqualand Mobile Belt. This material forms much of the rocky pediments at the base of mountains in the region. An unrelated and substantially more recent event (from 550 million years ago) has been the laying down, within a shallow sea environment of the Nama Group of sediments. It is this sedimentary grey and red-brown quartzite, shale and conglomerate which comprises the plateau and steep rocky slopes of Riemvasmaak. The Kalahari group of sandy alluvial depositions occurred relatively recently during the Quaternary. It is these wind- and water-transported materials which comprise the sandy pediments and sandy dry river beds below the plateau today.
1-7
Fig. 1.3. The geology of Riemvasmaak enlarged from the 1:250 000 Geological Series 2820 Upington map (Moen, 1988).
8
TABLE 1.2. The geology and lithology of Riemvasmaak (after Moen, 1988). MAP SYMBOL
SEQUENCE/ COMPLEX
GROUP/SUITE
FORMATION
LITHOLOGY
Q Qg
Kalahari group sandy alluvium Kalahari group Kalahari group Gordonia
Sandy alluvium Red-brown, wind-blown sand and dunes
Nk
Nama group sediments Nama group Kuibis
Grey and red-brown quartzite, shale, conglomerate
Mgo Mra Mpu Mo Mcl Mbo Mko Mw Mtw
Mc Mdo Mba Md Mga Ma Mrm
Korannaland sequence
Hartbees River complex
Namaqualand Mobile Belt - Sedimentary and volcanic rocks Goedehoop Quartzite, sericitic and/or feldspathic in places Biesjepoort group Rautenback se kop Fine-grained, pink-weathering gneiss Puntsit Quartz-rich and mafic calc-silcate rocks with lenses of wollastonite and marble Omdraai Leucocratic quartz-microcline gneiss, amphibole gneiss, quartzite
Koelmanskop metamorphic suite
Collinskop Bok-se-puts Kourop Migmatite Witwater Gneiss Twakputs Gneiss
Namaqualand Mobile Belt - Intrusive rocks Keimoes Suite Cnydas Subsuite Donkieboud Granite Gneiss Eendhoorn Suite Bak River Granite Gneiss Daberas Granodiorite -
Augrabies Gneiss Riemvasmaak Gneiss
Kinzigite Yellow-weathering gneiss with quart-rich and pelitic zones Migmatitic leucogneiss and biotite gneiss, garnetiferous in places; amphibole gneiss White, garnetiferous mica-poor gneiss, pegmatitic in places Mega blastic, garnetiferous biotite gneiss
Unfoliated, equigranular granites, with tormaline nodules in places Biotite rich granite gneiss, garnetiferous and/or megacrystic in places Biotite-rich, garnetiferous granite gneiss Charnockitic granodiorite Undifferentiated basic rocks (metagabbro, diabase, etc) Grey to red-brown granite gneiss Pink-weathering granite gneiss with a granular or augen texture
9
Fig. 1.4. Major geological groups comprising the Riemvasmaak environment.
1-10
1.3.2 Mining This section is drawn directly from the work contained in the South African Defence Force report (SADF, 1990) and except for a few minor editorial changes and the exclusion of a number of figures it is reproduced in its entirety. Where applicable, additional material drawn from Toens’ (1994) brief synopsis is included. This information is extracted “from the study of certain unpublished reports, most of which are not generally available” (Toens, 1994). Important early sources of information concerning the mining potential are contained in Gerringer & Bothas’s (1975) excellent description of the pegmatite-granite association in Riemvasmaak . Three maps, providing an accurate location and description of each pegmatite field, are also contained in their article. Von Backstrom (1967) presents important details of the pegmatite minerals, including their composition, history of extraction and potential for further exploitation. Although we provide some additional references in our bibliography, a comprehensive survey of the geological and mining literature by a skilled consultant is needed. The pegmatite belt of the Northern Cape Pegmatites occur mainly as relatively sporadic deposits that are connected with granitic intrusive activity. The pegmatites in the northwestern Cape occur along a fairly continuous belt approximately 25 km wide and 250 km long, and is estimated to contain in excess of 50 000 pegmatites of various sizes. The pegmatites, ranging from homogenous to inhomogenous types, are found in the area west of Upington. They are concentrated in distinct areas and seven such fields have been recognized by Gerringer & Botha (1975). The pegmatites have been divided into groups according to their main economical mineralisation. Four different types, namely, rare earth bearing, beryl bearing, andalusite bearing and tourmaline bearing pegmatites have been recognized. Riemvasmaak itself displays a wealth of pegmatite intrusions, including some of the most renowned Rare earth and beryl bearing pegmatites in the country A close association exists between the mineralisation and distribution of the pegmatites and the various granitic occurrences in the area. Gerringer & Botha (1975) have shown that the Rare earth bearing pegmatites are associated with the Central Massif of the Bakriver granite, the beryl bearing pegmatites are associated with the Southern Massif of the Bakriver granite. The andalusite bearing pegmatites are related to the Kouropriver granite and the tourmaline rich types are associated with the younger granites of the Cnydas complex. Several of the pegmatites in the area have been economically exploited in the past, but only in small quantities. The mining of pegmatites has mostly been done by nomadic prospectors who move from one pegmatite to another. The large scale exploitation of pegmatitic mineralisation is hampered by the general lack of geological information pertaining to the size of the pegmatites and the extent of mineralisation.
11
Economically exploited pegmatites in Riemvasmaak. The Bakriver pegmatite This pegmatite is situated on the eastern slope of the Bakriver valley about 9 km south of Bok se Puts. It is approximately 30 m long and between 10 m and 30 m wide. It forms an irregular body with a discordant off-shoot. The body exhibits a complicated structural relationship with the enclosing country rock. The pegmatite has three distinct zones: a border zone, a wall zone and a core with the mineralisation occurring in the wall zone. Between 1952 and 1959 the pegmatite was prospected for gadolinite and allanite, producing several tons. The pegmatite is now largely worked out. Toens (1994) states that “....approximately 75 tons of radioactive materail (was) produced in the Bakriver pegmatite containing 0.07 % uranium oxide.” The Murasie pegmatite At Murasie, five thin tabular parallel pegmatites dip 40 degrees south and form a low hill 9 km south of Bok se Puts. A prospecting pit 500 m reveals a well-developed zonal structure consisting of a quartz core, a perthitic intermediate zone and a wall zone of graphic granite consisting of quart, plagioclase and biotite. The Rare earth minerals are concentrated in the intermediate zone. Allanite and gadolinite generally occur as small anhedral lumps close to the contact with the wall zone and a few tons of the se minerals have been mined. The Japie pegmatite This pegmatite lies 5 km northeast of the confluence of the Orange and Bak rivers, on the southern slope of a steep hill. The east-west trending body dips vertically and plunges east. It is 80 m long and between 10 m and 20 m wide. A creek has cut its way across the western part of the body and exposed the internal structure. The central and largest part of the pegmatite is the quartzitic core surrounded by a perthitic shell. On the northern side of the body considerable quantities of ?ergusonite was allegedly recovered from pockets of biotite, quartz and perthite lying close to the core. The pegmatite was prospected for Rare earth minerals from 1956 to 1958, producing seven tons of gadolinite. The Mosterthoek pegmatite This pegmatite is situated approximately 10 km west of the Riemvasmaak Mission Station. It forms a concordant lenticular dyke 1 000 m long and 7 m to 30 m wide. The pegmatite consists of a quartz-perthite core in contact with a zone consisting of albite, cleavlandite, quartz, muscovite, beryl, schorl and columbite tantalite. Some of the beryl crystals from this pegmatite measure in excess of one meter in length. According to local prospectors (and Toens, 1994), more that 225 tons of beryl have been produced (see also Von Backstrom, 1967).
12
The Kourop pegmatite This pegmatite forms the crest of a steep hill 5 km east of the confluence of the Kourop and Orange Rivers. The pegmatite is a dyke-like body 200 m long and 6 m to 12 m wide. It strikes northwest and dips slightly to the northeast. The pegmatite consists of a border zone and wall zone and a core, which contains radial clusters of andalusite. Elluvial lumps of andalusite in excess of 12 kg can be found in the rubble of the old diggings. No information pertaining to the amount of andalusite produced could be found. The Riemvasmaak pegmatite This pegmatite is exposed 3 km north of the Riemvasmaak Mission Station. It is 60 m long and 3 m wide and lies on the steep slopes of the spur jutting out from the hill on which the northwestern beacon of the farm Waterval is located. Rare earth minerals, mainly gadolinite, have replaced microcline perthite close to and along the contacts with the core. Approximately 140 kg of gadolinite was produced during 1945 from a small mineralized portion of the pegmatite estimated to contain 0.1 % Rare earth minerals (see also Toens, 1994). Other economical deposits in the area Approximately 1.5.km south of Bok se Puts lies the locality of an old Rose Quartz mine. The colour of Rose Quartz is due to the presence of manganese. Although Rose Quartz is common and widespread it is nearly always cloudy and cracked so that clear pieces are scarce. The same mine evidently also produced some smoky quartz, which is a colourless to black variety of quartz. The colour is due to irradiation or due to heat. On the farm Aries, forming the northwestern border of the area, baryte deposits have been found in addition to a gypsum deposit constituting approximately 22 million tons of 67 % gypsum. The deposit is presently (i.e. 1990) being mined by Blue Circle Mines.
13
14
Fig. 1.5. Occurrence of minerals at Riemvasmaak. (See also Von Backstrom (1967) for a more detailed account of mining operations in the area).
15
1.3.3
Soils
No detailed soil survey of the whole of Riemvasmaak has as yet been undertaken. However, because the Molopo alluvial fan (see photostation 12 for a view of the region) has been ear-marked as a potential crop irrigation site it has been thoroughly investigated by Van Niekerk (1994) who provides a soil unit map of the alluvial fan and a detailed physical and chemical analysis of each unit. Because of its importance to the agricultural development of the region, the soil unit map (Fig. 1.6) and brief description of the soil units is included in this report (Table 1.3). In addition to Van Niekerk’s (1994) soil analysis we also collected and analyzed 12 soil samples from a range of landforms in Riemvasmaak and present the data in Table 1.4. We discuss salient features of the soil data set in our description of the vegetation associated with landforms (Section 1.4.1.3).
16
TABLE 1.3. A description of soil units on the Molopo alluvial fan indicating their geomorphological position, dominant soil form, map symbol (see Fig. 1.6) and their irrigation potential (L = Low; M-L = Moderate to Low; M = Moderate; M-H = Moderate to High). Information for this table has been compiled from data in Van Niekerk (1994). NAME
DESCRIPTION
SOIL FORM
Lower Orange River terrace
• Young, alluvial, deep, fine sand deposits • Uniform, very deep, fine sand deposits • Shallow to very deep, wind redistributed, fine sandy alluvium • Very stony, bouldery area • Gently sloping alluvial fan with deep gravelly coarse sand • Recent, gravelly soarse sand alluvium • Recent,deep, gravelly coarse sand alluvium • Deep, calcareous gravelly, coarse sand to gravelly loamy coarse sand • Deep, calcareous, very gravelly loamy coarse sand • Non-calcareous gravelly coarse sand
Higher Orange River terraces
Alluvial fans Very low Molopo River terrace Higher Molopo River terrace
Gently sloping pediment slopes
Narrow, north-aspect pediment Sloping, eroded, upper pediment slopes Moderately deep to shallow soils Lower pediment slope alluvium Stony, older terrace remnants
• Aeolian fine sand and coarse alluvium • Deep, calcareous, gravelly loamy coarse sand • Occur as narrow bands on the upper pediments • Fine sand to loamy fine sand alluvium • Gravel, stones and boulders in a calcareous coarse sand to loamy coarse sand
Dundee Namib Namib
MAP SYMBOL Du1 Nb1 Nb2
IRRIGATION POTENTIAL M M-H M
Namib Dundee
Nb3 Du2
M M
Dundee Dundee Dundee/ Augrabies Augrabies Dundee/ Clovelly Dundee Augrabies
Du3 Du4 Du5
L M-L M-H
Ag1 Du6
M-H M-H
Du7 Ag2
M M-H
Augrabies Dundee Dundee
Ag3 Du8 Du9
M-H M-H M-L
1-17
Fig. 1.6. Soil unit map of the Molopo alluvial fan (redrawn from Van Niekerk (1994)) showing the distribution of regions with moderate to high irrigation potential (dots) and those with moderate, moderate to low and low irrigation potential (left blank). Rocky, mountainous terrain is indicated by diagonal lines; D = drainage line of Orange River, Molopo River or smaller tributaries of these two rivers. Soil unit map symbols are those used in Table 1.3 where details of the soil units are presented. Star indicates position of photostation 12.
1-18
TABLE 1.4. Results of an analysis of soil samples from 12 sites in Riemvasmaak. Number refers to the photostation number (see Appendix 8) and the letter refers to the landform wherein the soil sample was taken. Landform abbreviations are Rf = rocky footslope, Sp = Sandy pediment, Pl = Plateau, Pa = Pan on plateau, Rb = River bed. The soils are all loamy sands except for 5c which is a sandy clay loam. VARIABLE Number Landform Colour % Coarse sand % Medium sand % Fine sand % Silt % Clay pH Resistance (ohm) P (mg/kg) Ca (mg/kg) Mg (mg/kg) K (mg/kg) Na (mg/kg) T-Value [meq%] % Ca % Mg %K % Na % Base saturation Cu (mg/kg) Mn (mg/kg) Zn (mg/kg)
2e Rf BR 22.1 18.9 49.0 4.0 6.0 8.1 417 307 4264 221 335 115 24.45 87.0 7.4 3.5 2.0 100 0.8 37.0 1.3
2f Sp LT R BR 24.5 20.7 46.8 4.0 4.0 7.0 2500 158 486 62 116 52 3.46 70.1 14.8 8.6 6.5 100 0.5 57 0.7
5a Pl RD 20.7 18.0 55.3 2.0 4.0 4.6 1667 31 362 134 163 55 4.03 44.9 27.4 10.4 5.9 89 0.8 37.0 0.8
5c Pa RD 26.7 6.9 38.4 12.0 16.0 6.4 833 230 1216 187 419 61 8.94 67.8 17.2 12.0 3.0 100 2.1 187 2.0
7a Sp LT R BR 22.5 20.7 50.8 2.0 4.0 7.6 200 165 1192 59 129 52 6.99 85.1 6.9 4.7 3.2 100 1.0 45.0 0.6
SOIL SAMPLE 7c 8a Sp Sp LT R BR BR 19.0 20.5 16.7 16.7 54.3 54.8 4.0 4.0 6.0 4.0 6.2 6.5 2500 3333 94 142 474 611 108 78 96 106 58 53 3.75 4.19 63.0 72.7 23.7 15.3 6.5 6.5 6.7 5.5 100 100 0.5 0.5 43.0 45.0 1.0 0.6
9a Sp BR 24.5 18.9 50.6 2.0 4.0 6.5 2000 155 646 92 111 52 4.49 71.8 16.9 6.3 5.0 100 0.7 53 0.5
11b Rb BR 19.8 16.0 58.2 2.0 4.0 5.7 3731 100 382 85 108 52 3.19 59.7 21.9 8.7 7.1 97 0.5 41.0 0.7
12a2 Rb BR 20.4 16.7 56.9 2.0 4.0 7.2 1190 98 838 51 90 75 5.16 81.1 8.1 4.5 6.3 100 0.7 42.0 0.5
18a Sp RD 26.0 20.7 43.3 4.0 6.0 6.3 3846 59 211 71 53 51 1.99 52.8 29.3 6.8 11.1 100 0.4 31.0 0.7
18b Sp RD 24.1 22.0 43.9 4.0 6.0 6.7 308 157 355 75 107 273 3.85 46.0 16.0 7.1 30.8 100 0.6 49.0 0.9
1-19
1.3.4 Climate Werger & Coetzee (1977) provide an excellent introduction to the climate of the Augrabies Falls National Park including descriptions of the solar radiation, temperature, wind, rainfall and ralative humidity. With a mean annual rainfall figure of 124.4 mm (std. dev. = 73.47 mm) there are few places in South Africa as arid as Riemvasmaak (Fig. 1.7). Although highly unpredictable (coefficient of mean annual rainfall = 59.06 %) long-term records indicate that rainfall is greatest between February and April with a distinct peak in March. The mean annual temperature is 21.6 °C and although the mean daily maximum temperature for January - the warmest month is 37.4 °C, summer temperatures frequently exceed 40 °C. When considered on a monthly basis, at no time during the year does water availability exceed evaporative demand and a state of permanent drought therefore exists. The spatial variation, between 75-155 mm.yr-1 in Riemvasmaak's annual rainfall totals (Fig. 1.8), suggests that only small gradients in moisture availability exist. Rainfall increases only slightly from west to east reflecting the more general regional trend for an increase in mean annual rainfall totals in more eastern parts of the Northern Cape. The most pronounced trend within Riemvasmaak itself, however, is for an increase northwards away from the lower elevations of the Orange River channel onto the higher-lying plateau environment. The modelled data indicate that places along the Orange River receive between 75-85 mm.yr-1 but that this increases to between 135-145 mm.yr-1 on the plateau north of the Riemvasmaak Mission Station. The long-term rainfall records for Augrabies village and Geelkop, about 50 km east of Augrabies (Fig. 1.9, Fig. 1.10), show that the region is characterised by periods of alternating low and high rainfall which have been interpreted by some researchers as pseudocycles (Tyson, 1988). The general pattern in rainfall for the region during the last 65 years may be interpreted as follows. There appears to have been a general aridification of the region from 1918-1933 with only 4 years showing any significant increase above the long-term mean annual amounts (Fig. 1.9, Fig. 1.10). Between 1934 and 1941, however, a series of generally higher rainfall years followed. From 1942 right up until 1948 (for Augrabies village at least) mean annual totals were very low. The early 1950's are characterised by large fluctuations in annual totals but from 1956 to the end of 1966 there was a clear decrease in rainfall totals. From 1967 in Augrabies but a little later in Geelkop, an unparalleled and sustained increase in annual rainfall occurred. These "wet" conditions were to last until 1977 in Augrabies and have been followed by one of the most extended dry spells on record which continues to the present. The significance of the wet 1970's which coincidentally occurred at the very beginning of the SADF's tenure has important implications for the recruitment of key tree species such as Acacia erioloba and Schotia afra and will be discussed in more detail later.
1-20
Fig. 1.7. Walter-Leith climate diagram for Augrabies close to the south eastern boundary of Riemvasmaak. a = climate station: [rainfall data are taken for the period 1946-1994 from Augrabies village (station number 0281760 1) (28°40’S 20°26’E) while temperature data are for the period 1984-1994 and are from Augrabies Water Falls (station number 0281606 0) (28°36’S 20°21’E) some 14 km northwest of Augrabies village]; b= height above sea level (Augrabies village = 640 m; Augrabies Water Falls = 626 m); c = duration of observation in years (the first figure indicates temperature, the second, precipitation); d = mean annual temperature; e = mean annual precipitation; f= mean daily maximum temperature of the warmest month; g = mean daily temperature variations; h = mean daily minimum temperature of the coldest month; i = curve of mean monthly temperature; j = relative period of drought; k = curve of mean monthly precipitation.
1-21
Fig. 1.8. Mean annual rainfall for Riemvasmaak and surrounding areas calculated from CCWR (1994) modeled data.
1-22
400
Augrabies (1946-1994)
350
Rainfall (mm)
300 250 200 150 100 50
19 94
19 92
19 88 19 90
19 86
19 84
19 80 19 82
19 78
19 76
19 74
19 72
19 70
19 68
19 66
19 64
19 60 19 62
19 58
19 56
19 54
19 52
19 50
19 46 19 48
0
Year
450
Geelkop (1918-1988)
400
350
Rainfall (mm)
300
250
200
150
100
50
19 1 19 8 20 19 22 19 24 19 2 19 6 28 19 3 19 0 32 19 34 19 36 19 3 19 8 40 19 4 19 2 44 19 4 19 6 48 19 5 19 0 52 19 5 19 4 56 19 5 19 8 60 19 62 19 64 19 6 19 6 68 19 70 19 72 19 74 19 76 19 7 19 8 80 19 82 19 8 19 4 86 19 88
0
Year
Fig. 1.9. Total annual rainfall (histograms) and three-year running mean (solid line) for Augrabies village (station number 0281760 1) (28°40’S, 20°26’E) for the period 1946-1994 and for Geelkop (station number 0283098 3) (28°38’s, 21°04’E) for the period 1918-1988.
1-23
200
Augrabies (1946-1994) Mean = 124.4 mm.yr-1
100
50
0 19 46 19 48 19 50 19 52 19 54 19 56 19 58 19 60 19 62 19 64 19 66 19 68 19 70 19 72 19 74 19 76 19 78 19 80 19 82 19 84 19 86 19 88 19 90 19 92 19 94
per cent deviation
150
-50
-100
-150
Year
200
Geelkop (1918-1988) Mean = 147.8 mm.yr
-1
100
50
0 19 18 19 20 19 22 19 24 19 26 19 28 19 30 19 32 19 34 19 36 19 38 19 40 19 42 19 44 19 46 19 48 19 50 19 52 19 54 19 56 19 58 19 60 19 62 19 64 19 66 19 68 19 70 19 72 19 74 19 76 19 78 19 80 19 82 19 84 19 86 19 88
per cent deviation
150
-50
-100
Year
Fig. 1.10 Percent deviation from mean long-term rainfall at Augrabies village (station number 0281760 1) (28°40’S, 20°26’E) for the period 1946-1994 and at Geelkop (station number 0283098 3) (28°38’s, 21°04’E) for the period 1918-1988.
1-24
1.3.5 Hydrology and water sources Four river systems occur in Riemvasmaak (Fig. 1.11; Table 1.5) and the general direction of drainage is from north to south although the Molopo River channel itself runs slightly transverse to this pattern The Bak River drains the western portion of Riemvasmaak and is the second largest catchment within the region. The central portions of the reserve are drained by the marginally smaller Kourop River. The eastern parts are drained by the Molopo River and its tributaries forming the largest catchment in Riemvasmaak. Three small subcatchments of the Orange River occur between each of the Bak, Kourop and Molopo Rivers.
TABLE 1.5. The % cover and area (ha) of each river catchment in Riemvasmaak. No. 1 2 3 4 (4a) (4b) (4c)
Catchment
Area
Bak River Kourop River Molopo River Orange River (Orange River) (Orange River) (Orange River)
% 23.4 23.3 36.0 17.3 (4.8) (5.0) (7.5)
ha 17 433 17 369 26 898 12 863 (3 579) (3 700) (5 584)
Total
100.0
74 563
Over the years a number of boreholes and dug wells or “putte” have been established while the location of a number of natural springs and water holes are still remembered by local people. Upon the request of FARM Africa, P D Toens and Associates - a consulting geological and geohydrological enterprise - investigated the water sources of Riemvasmaak. This study (Toens, 1994) was conducted in August 1994 and together with information contained in the SADF report (SADF,1990) has been synthesised into a more user-friendly format in Fig. 1.12 and Table 1.6. The most crucial finding of Toens (1994) was that only three of the twenty water points sampled contained potable water (numbers 5, 6 & 20). The remaining sources had excessive levels of either fluoride or nitrates or were too saline for healthy human consumption. These findings are in stark contrast to the views expressed by the Riemvasmaak community who during a workshop in May 1994 (Isaacs & Phillips, 1994) described many of their water sources as "vars" (fresh).
1-25
Fig. 1.11. Catchment areas of the four main river systems in Riemvasmaak: 1 = Bak River; 2 = Kourop River; 3 = Molopo River; 4 = Orange River.
1-26
Fig. 1.12. Location of different water sources in Riemvasmaak. Numbers refer to those in Table 1.6.
1-27
Table 1.6. Water quality and other characteristics of water sources (boreholes, dug wells (= put), springs (= fonteine) and natural waterholes) in Riemvasmaak. No.
Description
Water level (m)
Depth (m)
Nitrate (mg/l) Acc. limit = 6.00 Max. limit = 10.00 26.40
1
RIEM 1
B1
Production borehole
12.5
17.3
2
RIEM 2/ G38354 RIEM 3/ G38355 RIEM 4 RIEM 5 RIEM 6 RIEM 7 RIEM 8 RIEM 9 RIEM 10 RIEM 11 RIEM 12 RIEM 13 RIEM 14 RIEM 15 RIEM 16 RIEM 17 RIEM 18 RIEM 19 RIEM 20 RIEM 21 RIEM 22 RIEM 23
-
Production borehole
27.2
80.0
114
3.40
4.03
-
Borehole
26.9
81.0
116
3.21