International Journal of Materials, Mechanics and Manufacturing, Vol. 2, No. 4, November 2014
Monitoring of Biodiesel Transesterification Process Using Impedance Measurement T. Rachmanto, D. Allanson, C. Matthews, and I. Jenkinson
research effort. The transesterification process can be performed in both batch and continuous reactors. In the batch reaction the process is highly influence by factors such as stirring speed, molar ratio, catalyst and temperature. In order to optimize the biodiesel transesterification process, on line monitoring is required to provide feedback for system control. Feedback is required to indicate whether the process has reached steady state conditions and delivers the opportunity to save energy during the process by reducing mechanical agitation or by reduction of heater input energy [4]. Gas chromatography (GC) has been used to characterize the biodiesel properties during the reaction process, high precision GC measurement can be used to determine product yield (methyl esters) and conversion efficiency. However gas chromatography is not typically used for online measurement as it requires intensive sample preparation and the cost of the equipment is prohibitive and is unsuitable for low cost industrial process monitoring and control purposes. Alternative measurement/monitoring approaches have been investigated. The use of a fibreoptic probe based on Near Infra Red (NIR) spectroscopy to monitor the transesterification process was investigated by Knothe [5]. Ellis et al. [6] investigated the use of an acoustic wave solid state viscometer to measure shear stress during the transesterification reaction and presented results showing that the shear stress and hence viscosity dropped significantly during the reaction process before reaching a steady state value. Trevisan also investigated the use of infrared spectroscopy to monitor a batch biodiesel reaction [7], DeBoni employed laser spectroscopy to monitor the transesterification process over a period of 6000s. His results indicated that a steady state was achieved after 2500 seconds [8]. The identified prior work has proven that it is possible to use simple methods to monitor the transesterification process and determine state of the reaction during the region controlled by the chemical reaction kinetics and that it may be possible to employ sensors for feedback control purposes.
Abstract—Transesterification is commonly used to produce biodiesel from methylester. In order to control the conversion process it is often useful to employ process monitoring and in particular monitor the mass transfer processes that limit the initial reaction rates. Such monitoring of the initial phase of reaction may provide opportunity for process optimization. Previous work has identified many methods to monitor reaction progress. This paper proposes the use of a simple method which is able to provide information regarding the progress of mass transfer and chemical reaction during biodiesel production. The process uses impedance measurement. The experimentally determined impedance results clearly show the two important phases of the transesterification reaction, a mass transfer control phase followed by a kinetically controlled phase. Index Terms—Biodiesel, impedance, interdigital impedance sensor, transesterification, process monitoring.
I. INTRODUCTION Alternative diesel fuels have been the subject of extensive investigation. The consumption of mineral based Diesel fuels is increasing significantly together with the associated problems of environmental damage. Fatty acid methyl ester (FAME) based Biodiesel manufactured from vegetable oils or animal fats is excellent candidate to replace common diesel fuel being renewable, non-toxic and often giving rise to reduced exhaust gas emission (lower levels of nitrogen oxide (NOx) emissions). Unfortunately vegetable oils cannot be simply used to fuel diesel engine due to its increased viscosity and lower volatility (tendency of a compound to vaporize) [1]. Biodiesels are commonly derived by converting triglycerides (vegetable oils or animal fats) to alkyl esters. The resulting alternative diesel fuel suffers from the disadvantage of having viscosity around 10 to 17 times greater than that of ordinary diesel [2]. Consequently it is difficult to utilize the renewable based fuel directly in a diesel engine designed for operation with mineral Diesel. Operation with the alkyl ester based fuel can lead to increased carbon deposits, injectors coking, oil ring sticking and the possibility of lubrication oil degradation caused by contamination with vegetable oil [3]. Several techniques have been investigated to reduce the viscosity of vegetable oils and fats in order to meet diesel fuel standards. Transesterification is a widely used method for the production of biodiesel and is the subject of significant
II. TRANSESTERIFICATION A number of sequence and reversible reactions are occurring during the biodiesel transesterification process. Triglycerides and free fatty acid (oil or vegetable oils) will undergo a reversible reaction with an alcohol, the products of this reaction are glycerol (GL) and fatty (FA) acid alkyl ester. Monoglycerids (MG) and diglycerids (DG) are formed during the reactions of catalytic transesterification reactions to glycerol and methyl ester as final products. The triglycerides can be converted with or without the use of a catalyst, however alkali or acid catalyze is commonly used for commercial applications. A catalyst free reaction can be
Manuscript received February 5, 2014; revised March 31, 2014. T. Rachmanto, D. Allanson, and C. Matthews are with the School of Engineering, Liverpool John Moores University, UK (e-mail:
[email protected]). I. Jenkinson is with the School of Engineering Technology and Marine Operations Liverpool John Moores University, UK.
DOI: 10.7763/IJMMM.2014.V2.140
265
International Journal of Materials, Mechanics and Manufacturing, Vol. 2, No. 4, November 2014
transesterification process using mechanical agitation with the mixing rate of 700 min-1 is 10.3 times higher than that reported with 100 min-1 mixing rate. In addition the use of a higher reaction temperature can reduce mass transfer limitations with the higher energy level of molecules resulting faster diffusion into a pseudo homogeneous phase [14]. This previous work has shown that there is potential to optimise mechanical agitation and minimise the effects of mass transfer resistance during the batch reaction of biodiesel. Such optimisation should lead to increased process efficiency, reduced reaction time, reduced energy consumption and better utilisation of the reactants. This can be achieved by utilising a relatively simple design of sensor together with strategies for closed loop process control.
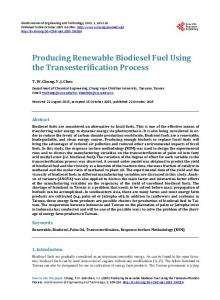
performed under certain circumstance such as on the critical condition.. A batch transesterification process has two significant mechanisms, and exhibits a mass transfer control region that is followed by a second order kinetically controlled region [9]. CH2-O-CO-R1 | CH-O-CO-R2 + | CH2-O-CO-R3 Triglyceride CH2-OH | CH-O-CO-R2 + | CH2-O-CO-R3 Diglyceride
CH3OH Methanol
CH3OH Methanol
CH2-OH | CH-O-CO-R2 | CH2-O-CO-R3 Diglyceride
+ CH3-OCO-R1 Methylester
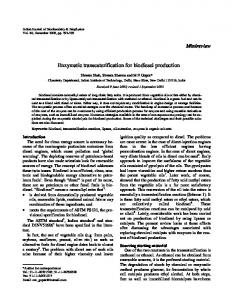
CH2-OH | CH-O-CO-R2 + CH3-OCO-R3 | CH2-OH Monoglyceride Methylester
IV. INTERDIGITAL IMPEDANCE SENSOR CH2-OH | CH-O-CO-R2 + | CH2-OH Monoglyceride
CH3OH Methanol
CH2-OH | CH-OH | CH2-OH Glycerol
The authors have identified a need to develop a cost effective sensing strategy that would allow for the closed loop control of simple batch and continuous flow reactors. The sensor developed is based on the InterDigital (ID) design that has been successfully employed in other fields, such as the estimation of the nitrate contaminantion [15] and to sense the presence of dangerous marine biotoxins in seafood as developed by Sayifudin et al. [16]. ID sensors have also been developed and employed biomedical applications [17]. The ID sensor is of simple construction and consists of two sets of interleaved electrodes (fingers). The two sets of electrodes are separated by a gap and when an AC excitation voltage is applied across the interleaved electrodes an oscillating electric field is developed. The fields generated by the excitation will penetrate into the material surrounding the sensor, in this case the reacting fluids. The dielectric properties (permittivity) of the material surrounding the sensor will therefore have a significant influence on how the material interacts with an applied electromagnetic field. Hence the dielectric properties in conjunction with electrode and substrate geometry will directly affect the capacitance and the conductance of the electrodes [18]. If the electrodes are insulated from the material under test, then the sensor will detect purely changes in capacitance. Alternatively if the electrodes are directly in contact with the material under test (as in this application) then the sensor will detect changes in capacitance and electrical conductivity of the material under test. This will make the sensor simultaneously sensitive to changes in ion concentration and dielectric properties allowing the sensor to detect the changes resulting from the mixing of reactants during the mass transfer and the change in dielectric properties resulting from transesterification. When a sinusoidal voltage is applied across the electrodes of a planar ID sensor, the current flow between the electrodes is the result of the applied potential difference and described by Ohms law. The ratio between the excitation voltage and the resulting current flow is the impedance (Z). The impedance is a complex quantity and ignoring the effects of parasitic inductance, we can consider it to consist of two phasor components, the resistance (ZR) or real part and the capacitive reactance (ZC) or imaginary part.
+ CH3-OCO-R3 Methylester
III. MASS TRANSFER AND REACTION In the early stages of the transesterification process the methanol is ineffective as the rate of reaction is limited by the interface mass transfer resistance [10]. This is due to the reactants being initially, in effect unmixed. Subsequent agitation of the reactants causes mixing, increasing the interfacial area and reducing the interface mass transfer resistance. The time required to bring about the required degree of mixing gives rise to a significant time delay between methanol and catalyst injection and the start of any significant transesterification reaction. As a result the transesterification process can be divided into two regimes, the regime controlled by the mass transfer process (methanol injection and reactant mixing) and the regime where the process is controlled by the reaction kinetics. The ability to monitor progression through the two regimes may provide opportunities for the development of strategies for automatic control and optimisation. For this purpose it may be beneficial to determine the extent of mass transfer, detect the completion of mass transfer, detect the start of significant reaction and subsequently determine the point of completion. For continuous flow reactors determination of mixing effectiveness and reaction completeness may also be off significant benefit for control purposes. The influence of mass transfer on the transesterification process may be mostly dependent on controlling variables such as impeller type/number, agitation speed, agitation amplitude and reaction temperature. Previous work has identified agitation methods such as the use of magnetic stirrer, static stirrer, ultrasound and ultra turrax. Bambase et al. [11] reported that the using of a higher agitation speed (magnetic stirrer) reduces the mass transfer resistant significantly. For the transesterification of crude sunflower oil it was shown that the mass transfer limitation was reduced to an effective zero time lag by selecting a 400-600 rev/min agitation speed. Other researchers [12], [13] have revealed that mass transfer coefficients achieved for the
(1) 266
International Journal of Materials, Mechanics and Manufacturing, Vol. 2, No. 4, November 2014
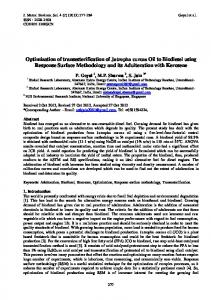
The capacitive reactance is perpendicular to the resistance and hence the sensor current will be out of phase with the excitation voltage by the angle θ that depends on the relative magnitude of the two effects. ( )
Assuming that the ID sensor behaves in a similar manner to the simple plate capacitor, then for a given frequency of excitation and fixed sensor geometry, the capacitance will depend solely on the dielectric constant and changes in the material composition will directly give rise to a change in the measured value of Z’’. During the initial stages of transesterification the reactants are effectively unmixed and the conductivity measured by the sensor will represent that of the raw feedstock. During methoxide injection and mixing, the conductivity will be expected to increase as the ions are distributed throughout the reactant volume increasing its conductivity. As mass transfer near completion chemical reactions begin, both real part and imaginary parts of the liquids dielectric will be simultaneously changing. Increasing liquid conductivity due to enhance ion distribution will make permittivity value increase. The resulting increase in conductivity associated with ions will give rise to and increased imaginary component and hence complex permittivity and measure capacitance will increase. In order to investigate the potential of using ID sensors to monitor transesterification reactions a simple sensor was fabricated, Fig. 1. The electrode pattern was created on a printed circuit board using a FR4 substrate. The copper plate thickness was 35μm; the width of the track forming the ID fingers was 1.6mm and the surface finished by Ormecon (partial chemical tin for ultra-flat pads). The original layout was created by Proteus 7 PCB design software and a number of sensors were produced from a single PCB sheet. The resulting sensor had a 1.5cm2 effective area and 0.4 mm gap width between digits. A precision shunt resistor (40.2K 0.1% tolerance) was used to sense the circuit current (see Fig. 2).
(2)
θ Sensing waveform
Vexc Vid Excitation waveform
Fig. 1. Relationship between the applied voltage and induced current in an impedance measurement.
The capacitive reactance is mainly affected by frequency of excitation f and the capacitance C between the electrodes. Z’’
(3)
The capacitance between the electrodes depends upon the geometry of the sensor and the dielectric properties of the substrate and surrounding material. For a simple capacitor comprising of two parallel circular plates the capacitance is given by: (4)
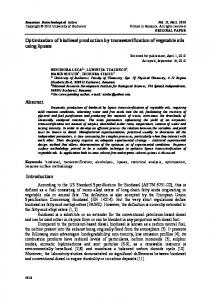
Vexc where ε is the complex permittivity in F/m, A is the effective area of the plates and D is the interplate distance. Complex permittivity is complex parameter and consists of real and imaginary parts. The real part is representing the value of material polarization and the imaginary part is representing value caused by ohmic and polarization losses. If losses come from the migration of charge carriers complex permittivity can be written: ε = ε’ – jε’’
Vid Fig. 2. Interdigital sensor.
The conductive current is dependent on the ion concentration related with dynamic of the process, it can be measured by flowing current flow through the sensor. In order to measure the current along the sensor, the voltage across the shunt resistor was measured:
(5)
where ε = complex permittivity; ε’ = real part of permittivity; . For ε’’ = imaginary part of permittivity; and j = √ medium having high conductivity the effect of charge migration cannot be simply neglected, the permittivity or dielectric constant is then given by [19]: ε = ε’(1 -
)
(6)
Vexc = Iid*Z
(7)
Vid = Iid*Rid
(8)
where Vexc excitation voltage across the sensor, Vid is the sensing voltage across the shunt series resistor Rid and Iid is flowing current across the resistor. The impedance of the sensor:
where σ is the conductivity of the liquid, the loss tangent is and represents the ratio of conductive current to displacement current in the material. The materials have low loss if loss tangent less than 0.1 and material has high loss if the loss tangent is greater than 10 [19]. Perfect dielectric material does not possess a conductivity value, it can hold and returns a charge from electromagnetic energy.
Z = Vexc/Vid*Rid
(9)
The real part and imaginary part of the sensor can be calculated: 267
International Journal of Materials, Mechanics and Manufacturing, Vol. 2, No. 4, November 2014
Z’ = Z*Cos θ
(10)
Z’’ = Z*Sin θ
(11)
(20°C - 70°C) the sensor and a thermocouple were immersed in 80ml of sunflower oil. The oil was then heated via a hot plate and mixed by rotating magnetic stirrer. Fig. 3 illustrates the variation of phase angle that occurred, it can be seen that there is a very small change in phase angle (approx. 0.4°) over the temperature range investigated. There was also a small increase (0.2mV) in the potential difference measured across the shunt resistor as illustrated in Fig. 4. Fig. 5 can be derived using equation 3, as can be seen from the graph 5 that capacitance value from 22.4oC - 33.6oC remains stable around 5.581pF. Increasing of capacitance value can be observed after 33.6oC until 69.4oC is 0.032pF which corresponds to a change of approximately 0.5%. There is no visible change in permittivity in low temperature while the changing in higher temperature is not notably high.
The voltage magnitude of Vid and voltage phase between Vexc and Vid is measured.
V. EXPERIMENTAL INVESTIGATION A. Method A small laboratory scale (