Research Report ETS RR–14-04
Monitoring of Scoring Using the e-rater ® Automated Scoring System and Human Raters on a Writing Test Zhen Wang Alina A. von Davier
June 2014
ETS Research Report Series EIGNOR EXECUTIVE EDITOR James Carlson Principal Psychometrician ASSOCIATE EDITORS Beata Beigman Klebanov Research Scientist
Gary Ockey Research Scientist
Heather Buzick Research Scientist
Donald Powers Managing Principal Research Scientist
Brent Bridgeman Distinguished Presidential Appointee
Gautam Puhan Senior Psychometrician
Keelan Evanini Managing Research Scientist
John Sabatini Managing Principal Research Scientist
Marna Golub-Smith Principal Psychometrician
Matthias von Davier Director, Research
Shelby Haberman Distinguished Presidential Appointee
Rebecca Zwick Distinguished Presidential Appointee
PRODUCTION EDITORS Kim Fryer Manager, Editing Services
Ayleen Stellhorn Editor
Since its 1947 founding, ETS has conducted and disseminated scientific research to support its products and services, and to advance the measurement and education fields. In keeping with these goals, ETS is committed to making its research freely available to the professional community and to the general public. Published accounts of ETS research, including papers in the ETS Research Report series, undergo a formal peer-review process by ETS staff to ensure that they meet established scientific and professional standards. All such ETS-conducted peer reviews are in addition to any reviews that outside organizations may provide as part of their own publication processes. Peer review notwithstanding, the positions expressed in the ETS Research Report series and other published accounts of ETS research are those of the authors and not necessarily those of the Officers and Trustees of Educational Testing Service. The Daniel Eignor Editorship is named in honor of Dr. Daniel R. Eignor, who from 2001 until 2011 served the Research and Development division as Editor for the ETS Research Report series. The Eignor Editorship has been created to recognize the pivotal leadership role that Dr. Eignor played in the research publication process at ETS.
ETS Research Report Series ISSN 2330-8516
RESEARCH REPORT
Monitoring of Scoring Using the e-rater ® Automated Scoring System and Human Raters on a Writing Test Zhen Wang & Alina A. von Davier Educational Testing Service, Princeton, NJ
This article proposes and investigates several methodologies for monitoring the quality of constructed-response (CR) scoring, both human and automated. There is an increased interest in the operational scoring of essays using both automated scoring and human raters. There is also evidence of rater effects—scoring severity and score inconsistency by human raters. Recently, automated scoring of CRs was successfully implemented with human scoring for operational programs (TOEFL® and GRE® tests); however, there is much that is not yet known about the performance of automated scoring systems. Hence, for quality assurance purposes, there is the need to provide a consistent and standardized approach to monitor the quality of the CR scoring over time and across programs. Monitoring the scoring results will help provide scores that are both fair and accurate for test takers and test users, enabling testing programs to detect and correct changes in the severity of scoring. Keywords Constructed-response items; automated scoring; human scoring; quality control
doi:10.1002/ets2.12005 Constructed-response (CR) items have been increasingly used in standardized assessments. CR items may include openended questions, structured performance tasks, and other kinds of free-response items that require examinees to display certain skills and knowledge. The tasks that are presented to examinees may be simple or highly complex; responses may range from short answers to presentations, projects, and interviews, such as in portfolios. The performance, or response, may be captured through a handwritten essay booklet, a word-processed document on a computer, an audio file recorded on the computer, a computer-simulated scenario, a stage performance (recorded or not), or some other nonmultiplechoice format. Inclusion of CR items increases the depth of a test, or at least its face validity, and allows for the productive testing of skills that many believe cannot be easily accomplished solely through the use of multiple-choice items (Lane & Stone, 2006). CR items are usually scored by people—a challenge for the standardization of an assessment. There is evidence that the scores provided by the human raters are often variable, both in terms of scoring severity and inconsistency (Longford, 1995). These individual differences are called rater effects.1 Recently, automated scoring has been used for complex CRs such as essays, and Educational Testing Service (ETS) uses the e-rater® automated essay scoring system. Automated scoring has some advantages over human scoring such as “fast scoring, constant availability of scoring . . . greater score consistency, a higher degree of tractability of score logic for a given response . . . that is not feasible under operational human scoring” (Ramineni, Trapani, Williamson, Davey, & Bridgeman, 2012, p. 2). Some high-stakes testing involves both human and machine scoring, which increases the need for quality control and monitoring of those scores. However, utilizing and validating this kind of hybrid scoring system would require a systemic evaluation and monitoring. Validity and reliability are two essential properties for the scores from standardized tests. Reliability measures the consistency of the performances of examinees on a test. Validity measures the extent to which the test measures a targeted construct. If the test does not measure the targeted construct consistently, then the test cannot be used to make appropriate decisions about the examinees. As with any operational scoring, both the human and automated scores need careful monitoring for each test administration to ensure their reliability, validity, and consistency while minimizing invariance across groups over time. Hence, all operational programs need to provide a consistent and standardized approach to monitor the quality of CR scoring over time. By monitoring the scoring results and by addressing the sources of threat to validity, we can provide fair scores to test users and control the potential for drift or bias in human-raters’ and automated scores. Corresponding author: Zhen Wang, E-mail:
[email protected]
ETS Research Report No. RR-14-04. © 2014 Educational Testing Service
1
Z. Wang and A. A. von Davier
Monitoring of Scoring Using e-rater®
This study explores and proposes several quality control analyses using both human-rater and e-rater scores. The methods are illustrated on the writing task of an English language assessment. Our study responds to the need for statistical analyses that provide a consistent and standardized approach to monitoring the quality of the CR scoring over time and across testing programs. Unfortunately, the literature on effective quality control procedures using quality control tools on automated scores or long-term monitoring on both human and automated scores is sparse. However, many studies have been conducted on human scoring and rater effects (DeCarlo, 2010; Donoghue, McClellan, & Gladkova, 2006; Engelhard, 1994, 2002; Longford, 1995; Myford & Wolfe, 2009; Patz, Junker, Johnson, & Mariano, 2002; Wang & Yao, 2012; Wilson & Hoskens, 2001; Wolfe & Myford, 1997). The results from these studies indicate that biases of examinee ability estimates or systematic error may be caused by varying degrees of rater leniency or central tendency. Additionally, rater effects can increase these bias estimates and lower test reliability (Donoghue et al., 2006; Wang & Yao, 2012). Some studies have been conducted on the performances of automated scoring (i.e., e-rater), the relationship and differences between automated and human scoring (Attali, 2007; Attali & Burstein, 2006; Burstein & Chodorow, 1999; Chodorow & Burstein, 2004). Burstein and Chodorow (1999), Chodorow and Burstein (2004), and Attali and Burstein (2006) analyzed e-rater’s performance. Attali (2008) and Attali, Bridgeman, and Trapani (2010) found that generic e-rater scoring models produced scores that were comparable to human scores. Ramineni, Williamson, and Weng (2011) found notable mean score differences between e-rater and human raters for essays written by certain demographic groups in the GRE® General Test and explored the root causes of these differences. Ramineni et al. (2012) used a newer version of e-rater and conducted a comprehensive study that compared the performance of prompt-specific and generic scoring models based on data from two TOEFL iBT ® writing prompts and evaluated the performance of e-rater against human raters across different demographic groups. Although these studies indicate that e-rater performs about as well as human raters in operational scoring, both need to be monitored carefully for quality assurance, especially for high-stakes tests. An issue exists regarding how human raters are assigned to essays (Wang, 2010). Wang and Yao (2011) used simulated data to examine human-rater effects. The results of their study indicated that the way essays are assigned to human raters, and the human-rater effects, especially the effect of human-raters’ scoring severity, can increase the student ability estimate bias and lower test reliability. Ramineni et al. (2011) used a combination of statistical methods (such as weighted kappa, Pearson correlation, and standardized mean difference), human qualitative reviews (such as the use of the scoring scale/rubric and the human rating process/procedures), and the e-rater scoring mechanism to identify the root causes of score differences between human raters and e-rater and to decide whether such discrepancies reflect inadequacies of e-rater, human raters, or both. In their study, some subgroup (e.g., China) was found to have much higher e-rater scores compared with human raters. During the quality review process, they found that e-rater is not severe enough on language errors, overvaluing organization and development, and occasionally undervaluing content. Haberman (2011) discussed alternative approaches to score the TOEFL iBT writing test using e-rater: “In the 1st approach, the predicted variable is the expected rater score of the examinee’s 2 essays. In the 2nd approach, the predicted variable is the expected rater score of 2 essay responses by the examinee on a parallel form of the test” (p. i). He concluded that adding additional human scoring is needed only when e-rater and human scores appear discrepant and such scoring should be minimized as much as it is feasible. Williamson, Xi, and Breyer’s (2012) article proposed “a generalizable framework for the evaluation and use of automated scoring . . . through summaries of operational criteria, policies, and practices” for the evaluation and use of automated scoring (e-rater; p. 11). Additionally, they provided brief discussions of how, in a high-stakes environment, a combination of automated scoring and human scoring might differ from other methods of automated scoring implementation (e.g., only using automated scoring). There appears to be little research available in the literature that examines the use of quality assurance methodologies to monitor variations over time in both automated scoring and human-rater performance. Few research articles (Lee & von Davier, 2012; Luecht, 2010) have proposed the use of quality control techniques to monitor the scoring, equating, and reporting of test scores. The rater effects may substantially increase the bias in students’ final scores without careful monitoring (Wang & Yao, 2012). Walker (2005), Wang (2010), and Wang and von Davier (2010) proposed a set of statistics and a framework (examinee, test, prompt level, and rater level) that can be used to monitor the quality and consistency of CR scoring. For automated scoring, there is no need to look for changes in rater severity. However, if an engine update occurs (e.g., e-rater is updated on an annual basis), the scores need to be investigated for comparability against human-rater 2
ETS Research Report No. RR-14-04. © 2014 Educational Testing Service
Monitoring of Scoring Using e-rater®
Z. Wang and A. A. von Davier
scores and against the previous engine, which is done over the same prompts for the same sample of essays. In addition, the automated scores need to be monitored over time for both the population total scores and the total scores by group level (e.g., demographic groups) to ensure that no cumulative bias occurs. We recommend a similar general approach to monitor the quality of human scoring, with some specific differences that are pointed out as necessary. We see this article as a work in progress that will need to be updated as the technology progresses, new testing programs adopt e-rater scoring or other automated scoring systems, and as the demographics change. Methodology In this study, we propose several methods for monitoring the quality of the CR scoring, using either or both the e-rater and human-rater scores. We treat e-rater and human raters as two valid approaches to scoring under the assumption that the e-rater calibration is based on an appropriate sample when the scoring engine has been updated. We use the writing data from an English language assessment for illustration purpose only. In our analyses, we have provided some guidelines for monitoring the CR scoring by (a) providing prompt-level analyses, (b) allowing human-rater and e-rater comparisons, (c) providing means of identifying outliers (scores and prompts), and (d) comparing examinees’ performances among the major demographic groups. Description of the Data In the operational writing section of the test, examinees are asked to write essays on two writing prompts that measure their ability to write in an academic setting. The first type of writing prompt is referred to as integrated writing, which requires combining information that examinees have heard in a simulated class lecture with what they have read in test materials. The second type of writing prompt is known as independent writing, which requires examinees to express an opinion and support it based on their own knowledge and experience. All writing essays are rated both by one human rater (h1-rater) and e-rater (Version 11.1), receiving both scores. E-rater scores are used as a contributory score for both writing prompts on the test for the final score. H2-raters’ data analyses are from the agreement sample, where 10% of essays was randomly drawn and scored by a second human rater (h2-rater) for each prompt. During the operational cycle, interrater reliability analysis of the h1-rater and h2-rater was based on the agreement sample. The agreement sample was selected separately for each writing prompt. In this study, no further rater analysis was conducted to combine the two different types of prompts. During the operational cycle, human raters participate in a standardized training process before they are allowed to rate the essays. The e-rater engine, however, is trained on a group of essays that does not include responses to the prompt that was actually administered. For the independent writing prompts, if the h1-rater and e-rater differ by >1.5 score points, then an h2-rater is assigned to score the prompt and resolve the discrepancy. For the integrated prompt, if the h1-rater and e-rater differ by >1.0 score points, then an h2-rater is assigned to resolve the discrepancy. The final score is usually based on the average of the two of the three scores that are closer to each other. In this study, we focused on the comparison of the scores between the h1-rater and e-rater. The comparison between h1-rater and h2-rater was also conducted based solely on the agreement sample. H2-rater data used in the study are not an adjudicator. There should not be any systematic difference between the pool of h1-raters and h2-raters. Those h2-raters who were asked to read the essays owing to large discrepancy between h1-rater and e-rater were not included in the analyses. The data were obtained from a 5-month 100% operational data set of 352,895 examinees whose essays received one human score and an e-rater score ranging between 0 and 5 for both the independent and integrated prompts. There were a total of 31 writing prompts administered 5 months in 2010/2011. Item Analyses Descriptive statistics including the means, standard deviations (SD), and SD ratios for both the h1-rater and e-rater were calculated. The prompts with the largest mean differences between the h1-rater and e-rater (SD ≥ |0.30|) were treated as outliers. If the ratio between the SDs of the h1-rater and e-rater scores was close to 1 for a prompt, it was indicative that the variance between the h1-rater and e-rater scores was similar. An SD ratio of about 1.5 or higher was treated as a cause for concern. ETS Research Report No. RR-14-04. © 2014 Educational Testing Service
3
Z. Wang and A. A. von Davier
Monitoring of Scoring Using e-rater®
Score Comparisons To identify unusual human and e-rater scores, a dependent t-test was used to test the significance of the raw score mean difference between the h1-rater and e-rater for each prompt. If the p value is less than the prespecified alpha level, .001, we will conclude that the difference is significantly different from zero. The significance level of the t-test depends heavily on the sample size of the examinees. Standardized Mean Difference The standardized mean difference is a measure of effect size. It was used to measure the tendency of the human raters to score systematically higher or systematically lower than e-rater. It is defined as the difference between two means divided by an SD for the data: 𝜇 1 − 𝜇2 , (1) 𝛽=√ 𝜎12 + 𝜎22 − 2𝜎12 where 𝜇1 and 𝜎12 are the mean and variance of human raters, and 𝜇2 and 𝜎22 are the mean and variance of e-rater. 𝜎 12 is the covariance between the two groups. According to Cohen (1988), values of 𝛽 between .2 and .3 are considered small effect sizes, around .5 as medium effect sizes, and .8 to 1 as large effect sizes. In this study, a 𝛽 value of .3 is the cutoff value used to identify potential outlier essays. Essay-Level Agreements and Consistency For both the integrated and independent prompts, we identified those essays with discrepancies between human rater and e-rater scores, by using interrater agreement statistics between the two human raters (h1-rater and h2-rater), and the h1-rater and the rounded e-rater score. For this analysis, the e-rater scores were rounded to the nearest whole number to place them on the same discrete rating scale that was used by the human raters: 0, 1, 2, 3, 4, or 5. When the two raters assigned the same score to a student’s response, the agreement rating was denoted as exact, that is, there was perfect agreement. Ratings that differed by exactly 1 score point were denoted as adjacent. Ratings that differed by 2 or more score points were denoted as nonadjacent. The results were presented by essay. Following are the descriptions of the rater agreement variable: • • •
Exact: No (0) score point differences between the two raters Adjacent: ±1 score point difference between the two raters Nonadjacent: ±2 score point difference between the two raters
Both quadratic weighted kappas and linear weighted kappas were calculated using the h1-rater and unrounded e-rater scores by prompt for the overall group of essays. Kappa is a measure of agreement between pairs of raters and can be interpreted as the degree to which the observed amount of agreement exceeds random chance (Cohen, 1988). However, kappa does not take into account the degree of disagreement between raters. Therefore, when the categories are ordered, it is preferable to use a weighted kappa and assign weights that depend on the size of the difference so that different levels of disagreement can contribute differently to the value of kappa. Linear weights are appropriate when the difference between the first and second categories has the same importance as a difference between the second and third categories. If the difference between the first and second categories is less important than a difference between the second and third categories, quadratic weights may be appropriate. In essay rating, quadratic weighted kappas of approximately .7 for two raters are fairly common. In any rating of essays or speech samples, quadratic weighted kappas below .6 are troubling (Haberman, 2012). Mean Differences (Bias) In this study, we chose to further examine the data to better understand the trends of human raters by comparing them with e-rater scores. To identify human raters who were more strict or lenient than other raters, e-rater scores were used to help identify the outlier raters by looking at the differences between the ratings of the human raters and 4
ETS Research Report No. RR-14-04. © 2014 Educational Testing Service
Monitoring of Scoring Using e-rater®
Z. Wang and A. A. von Davier
their corresponding e-rater scores. The mean of these differences was labeled bias; the SD of these differences was labeled SDDIFF .2 Np 1 ∑( ) D , (2) Bias = Np i=1 i SDDIFF
√ √ Nr √ ∑ )2 ( √1 = Di − Bias , Nr i=1
(3)
where e represents the essay, Di the difference between the h1-rater score and rater score for essay i, and Ne the total number of essays. Raters for whom the bias was equal to or above an absolute value of 0.30 were labeled as potential outlier raters. Any raters who scored fewer than 300 essays were excluded from the study. A total of 251 raters scored more than 300 integrated essays, and 289 h1-raters read more than 300 independent essays. Shewhart Control Charts Using Human-Rater Scores In addition to examining bias for identifying outlier human raters, we used Shewhart control charts (National Institute of Standards and Technology [NIST]; Shewhart, 1931; Western Electronic Company, 1958) based on h1-rater scores to help monitor human-raters’ performances. A Shewhart control chart has the following characteristics: • • • • •
it is a line graph; the horizontal axis, in most cases, represents time; the vertical axis shows the value of the variable that is to be controlled; the chart includes horizontal lines showing the mean of the variable and values of a specified distance above and below the mean—values that are unlikely to occur under normal circumstances; and a value above the upper line or below the lower line is evidence that the variable is being affected by something other than the usual sources of variation.
A Shewhart control chart has four elements: points that represent a statistic (mean) of the measurement of a quality characteristic in samples taken from the process at different times, a center line that is drawn at the value of the mean of the statistic, and the upper and lower control limits that indicate the threshold at which the process output is considered. Control limits are computed from the process SD. The upper control limits (UCL) and lower control limits (LCL) are ( ) UCL = mean of means + k process standard deviation (4) ( ) LCL = mean of means − k process standard deviation ,
(5)
where k is the distance of the control limits from the baseline (mean of means), expressed in terms of the SD unit. When k is set to 3, the charts are called three-sigma control charts (see 6.3.2.1. in NIST, n.d..; Western Electronic Company, 1958). Three standard errors (three-sigma units) as the marker for the control limit was originally proposed by Shewhart (1931) and applied by others for quality control purposes (American Society for Testing and Materials, 1976, pp. 134–135; Montgomery, 1997, p. 217; Omar, 2010). Control limits (lines) are drawn at three SDs from the center line and represent the threshold where points above (or below) those lines are considered outliers. In this study, a fluctuating control limit was calculated using the different number of essays read by each human rater. If a rater’s mean h1-rater scores fall outside of the fluctuating control limits, that rater was considered outlier in the study. In this study, we applied the Shewhart control chart to inspect human-raters’ performances based on their h1-rater scores only, which is different from all its applications in other assessments (Gao, 2009; Lee & von Davier, 2012). In Gao’s (2009) study, for example, a Shewhart control chart was used to monitor item performance over time and detect possible item exposure. In Lee and von Davier’s (2012) study, Shewhart control charts were used to inspect the individual or the grand means of all the scaled scores. However, in Omar’s (2010) study, he also used Shewhart mean and SD charts to ensure quality for human rating performance. In this study and in the case of rater monitoring, a Shewhart control chart ETS Research Report No. RR-14-04. © 2014 Educational Testing Service
5
Monitoring of Scoring Using e-rater®
Z. Wang and A. A. von Davier
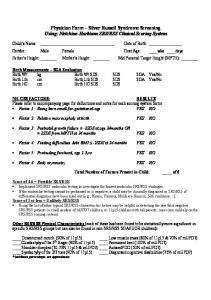
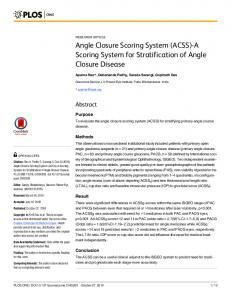
can be used to plot raters’ statistics at each test administration—or, if the testing program offers continuous testing, it can be used to plot raters’ statistics for each month of scoring. Standard Deviations E-rater can be used to detect human raters with a central tendency. The e-rater was calibrated on a set of human raters. The variance of e-rater is supposed to match the (average) variance of the h-raters used for calibration. An individual rater can be identified if she or he consistently rates lower than the e-rater for score categories higher than the average score category (or higher than the e-rater for the score categories lower than the average score category). To identify whether human raters tend to avoid awarding high and low scores, e-rater scores can be used to monitor human raters. If the ratio between the SDs of the h1-rater and the corresponding e-rater scores is close to 1 for each h1-rater, then it is indicative that the variance between the h1-rater and e-rater scores is similar. If a human rater has a much smaller SD than e-rater for the same responses—in other words, if the SD ratio of a human rater versus the corresponding e-rater is very different from 1.0—then the human rater is considered the excessive use of central scores (rather than extreme scores). Results Scatter Plots Scatter plots can show what a general pattern is, but they also show whether any individual prompts deviate from the general pattern. Scatter plots were created, containing data points for each prompt’s h-rater and e-rater mean and SD (see Figure 1a and b). The x-axis contains the e-rater mean; the y-axis contains the human-rater means. For example, in Figure 1a and b, the human raters tended to give somewhat lower scores than e-rater. In Figure 1b, there is one prompt that caused the examinees to write essays that received especially high scores from e-rater, but not from the human raters. In Figure 2a, there is some variation, but generally the e-rater scores and human scores have similar SDs—except for one prompt, for which the human scores had a particularly small SD. In Figure 2b, the human raters tended to have similar SDs as e-rater. Item Analyses Descriptive statistics such as score means, SDs, and SD ratios between h1-rater and h2-rater, and h1-rater and e-rater were calculated. The prompts with the largest mean score differences (≥|0.30|) between h1-rater and h2-rater, and h1-rater and e-rater scores are listed in Table 1 for both prompt types, respectively. Table 1 also lists the other descriptive statistics. For most integrated and independent writing prompts, h2-rater scores are lower than h1-rater scores
(b)
4
Human rater
Human rater
(a)
3.5
3
4
3.5
3
2.5
2.5 2.5
3
3.5
e-rater
4
2.5
3
3.5
4
e-rater
Figure 1 Scatter plots of mean scores for human raters and e-rater by prompt type: (a) integrated prompts and (b) independent prompts. 6
ETS Research Report No. RR-14-04. © 2014 Educational Testing Service
Monitoring of Scoring Using e-rater®
Z. Wang and A. A. von Davier
(b)
(a) 1.4
1.2
Human rater
Human rater
1.2
1.4
1
0.8
1
0.8
0.6
0.6 0.6
0.8
1
1.2
1.4
0.6
0.8
e-rater
1
1.2
1.4
e-rater
Figure 2 Scatter plots of standard deviations for human raters and e-rater by prompt type: (a) integrated prompts and (b) independent prompts. Table 1 Comparison of Descriptive Statistics for Human Raters and e-rater for Outlier Integrated and Independent Prompts h1-rater Prompt ID 2010_11_01A 2010_11_02A 2010_12_01A 2010_12_01B 2010_12_99A 2011_01_99A 2011_01_33A 2011_03_82A 2011_03_83A 2011_03_95A 2010_11_01A 2011_02_87A
Prompt type Integrated Integrated Integrated Integrated Integrated Integrated Integrated Integrated Integrated Integrated Independent Independent
N
Mean
14,113 10,608 13,167 13,529 19,635 8,455 13,401 10,860 8,505 8,795 14,113 13,108
2.98 3.08 3.08 2.97 3.23 2.78 2.82 2.92 3.20 3.17 3.33 3.30
SD 1.20 1.10 1.22 1.16 1.16 1.15 1.16 1.21 1.22 1.15 0.82 0.80
h2-rater Mean 2.64 2.82 2.69 2.62 2.92 2.48 2.49 2.58 2.90 3.17 3.28 3.24
SD 1.20 1.13 1.27 1.17 1.23 1.16 1.15 1.22 1.28 1.23 0.88 0.89
e-rater Mean 3.44 3.40 3.45 3.44 3.28 3.09 3.21 3.24 3.30 2.77 3.72 3.59
SD 1.13 1.19 1.12 1.11 1.19 1.17 1.17 1.16 1.17 1.11 0.77 0.79
h1-rater − h2-rater differences Mean a
0.34 0.26 0.39a 0.35a 0.31a 0.30a 0.33a 0.34a 0.30a 0.00 0.05 0.06
h1-rater − e-rater differences
SD ratio
Mean
SD ratio
1.00 0.97 0.96 0.99 0.94 0.99 1.01 0.99 0.96 0.93 0.93 0.90
−0.46 −0.31a −0.37a −0.47a −0.05 −0.31a −0.39a −0.31a −0.11 0.40a −0.39a −0.30a a
1.06 0.92 1.09 1.05 0.97 0.98 0.99 1.04 1.04 1.04 1.06 1.01
Note. H2-raters have lower sample sizes than h1-raters. Essays were randomly assigned to h2-raters for checking reliability. a Boldface indicates means greater than absolute value.
and e-rater scores are higher than the h1-rater scores. However, we found that the h1-rater and h2-rater scores of one integrated prompt (2011_03_95A) are much higher than the corresponding e-rater scores. We found more integrated prompts having discrepancies between h1-raters, h2-raters, and e-rater than independent prompts. Outlier Scores For the integrated prompts, there are eight prompts with large discrepancies (≥|0.30|) between the h1-rater and e-rater mean scores. In terms of the independent prompts, a large discrepancy (≥|0.30|) between the h1-rater and e-rater mean scores occurred for two prompts (see Table 1). An examination of the outlier prompt h1-rater scores reveals that they are very different from the e-rater scores—most of which are much lower than the e-rater scores. In addition, the corresponding h2-rater scores are much closer to the h1-raters than e-rater, indicating that the e-rater scores for these prompts might be inflated to some extent. SD Ratios and Mean Differences The mean SD ratio for h1-rater and h2-rater for the integrated prompts is 0.96 and 0.85, and the mean SD ratio for h1-rater and e-rater for the independent prompts is 1.00 and 1.03, respectively. Generally speaking, if two human-raters’ SD values are close to each other, the variance between h1-rater and e-rater is similar. For the integrated prompts, the SD ratio for h1-rater and e-rater, and h1-rater and h2-rater is pretty consistent; for the independent prompts, the SD ratio for h1-rater ETS Research Report No. RR-14-04. © 2014 Educational Testing Service
7
Monitoring of Scoring Using e-rater®
Z. Wang and A. A. von Davier
and e-rater, and h1-rater and h2-rater is not. In this case, the SD value of h2-rater is larger than that of both h1-rater and e-rater. For most prompts, the mean differences between h1-rater and e-rater scores are close to 0, and their SD ratio is close to 1, indicating that their variances do not differ much. However, the lowest SD ratio between h1-rater and e-rater is 0.78 for prompt 2010_12_10A, which shows that its h1-rater variance is much smaller than its e-rater variance for this prompt. Also this prompt’s SD values for h2-rater are almost the same as its h1-rater’s SD values, indicating that further investigation is needed regarding this prompt’s e-rater scores. Outlier Prompts A dependent t-test was used to test the significance between the h1-rater and e-rater scores for each of the writing prompts. Potential outlier prompts with large t-test values (p < .0001) and effect sizes >0.30 were found for both the integrated and independent writing prompts (see Table 2). For the integrated prompts, a total of five prompts were identified as outliers. In terms of the independent prompts, a total of seven prompts were identified as potential outliers. Six of the nine prompts identified in Table 2 were also listed as outlier prompts in Table 1, which shows consistency among the different methods that were used to identify outliers. Boxplots Figure 3a and b shows the boxplots for the 31 integrated and independent writing prompt mean scores for h1-rater, h2rater, and e-rater. Boxplots provide useful depictions of moderate to large distributions of numbers. The box, or fence, captures the interquartile range representing the middle half of the distribution of scores (i.e., the scores ranging between the 25th and 75th percentiles). The centerline in the box represents the median score value and the asterisk represents the mean. The whiskers extending from the box denote possible skewness in one or both tails of the distribution of values. It is very clear that the e-rater score mean is higher than that of h1-rater and h2-rater for both prompt types. And the three integrated prompt mean scores have much more variation than the three independent mean scores based on all 31 prompts used in the study. Additionally, we also noticed that approximately 10 of the integrated prompt e-rater mean scores have values that are much more extreme than those of the independent prompts. Prompt-Level Agreement and Consistency A comparison of the agreement between the two human-rater and rounded e-rater scores indicates that the rounded erater and h1-rater scores of the integrated prompts have lower mean percentages of exact and adjacent agreement (38% and 84%) than the corresponding percentages for the independent prompts (58% and 98%; see Figures 4a and b and 5a and b). However, h1-rater and h2-rater scores for the integrated prompts have high percentages of exact and adjacent agreement, which is similar to that of the independent prompts. The purpose of this article is to illustrate statistical methods for monitoring the scoring process and not to exhaustively compare the e-rater and h-rater. For the data used Table 2 List of Outlier Prompts Prompt ID
Prompt type
N
h1-rater
e-rater
t-test
Standardized mean differencea
2010_11_01A 2010_12_01A 2010_12_01B 2011_01_33A 2011_03_95A 2010_11_01A 2010_12_34A 2011_01_33A 2011_02_55A 2011_02_87A 2011_02_86B 2011_03_95A
Integrated Integrated Integrated Integrated Integrated Independent Independent Independent Independent Independent Independent Independent
14,113 13,167 13,529 13,401 8,795 14,113 5,988 13,401 8,777 13,108 14,444 8,795
2.98 3.08 2.97 2.82 3.17 3.33 3.26 3.21 3.31 3.30 3.20 3.17
3.44 3.45 3.44 3.21 2.77 3.72 3.54 3.54 3.57 3.59 3.48 3.46
51.45 40.27 52.23 44.15 −35.97 75.03 36.22 51.63 39.80 55.34 53.44 40.99
0.39 0.32 0.42 0.36 −0.35 0.49 0.36 0.30 0.31 0.37 0.33 0.32
Note. p value < .0001 for all items in the table. a Means were greater than absolute value. 8
ETS Research Report No. RR-14-04. © 2014 Educational Testing Service
Monitoring of Scoring Using e-rater®
Z. Wang and A. A. von Davier
3.8
3.8
3.6
3.6
3.4
3.4
3.2
3.2
Score
(b) 4.0
Score
(a) 4.0
3.0
3.0
2.8
2.8
2.6
2.6
2.4
2.4
2.2
2.2
2.0
2.0 INT_H1
INT_H2
INT_E
INT_H1
INT_H2
INT_E
Rater
Rater
Figure 3 Boxplots of the mean score distributions for the 31 writing prompts: (a) integrated prompts and (b) independent prompts. INT = integrated; IND = independent; H1 = h1-rater; H2 = h2-rater; E = e-rater.
70
70
60
60
Percent
(b) 80
Percent
(a) 80
50
40
50
40
30
30 1
2
Rater
3
4
Rater
Figure 4 Boxplots of 31 writing prompts’ percent agreement between human rater and e-rater: (a) exact agreement for integrated prompt and (b) exact agreement for independent prompt. 1 and 3: Between human rater 1 and human rater 2. 2 and 4: Between human rater 1 and e-rater.
in this article it does appear that e-rater gives a higher score than the h1-rater at each raw score point (0, 1, 2, 3, 4, and 5), especially for the integrated prompt. Further research is needed to investigate the generalizability of these findings to more data sets. H1-rater and e-rater scores for the integrated prompts have the lowest mean correlations (.58; see Figure 6a and b). H1-rater and e-rater scores for the independent prompts have higher mean correlations (.71) than those of the integrated prompts. The mean correlations between h1-rater and h2-rater scores are similar (.88) for both integrated and independent prompts. Table 3 displays the quadratic weighted kappas and linear weighted kappas for both writing prompt types. The quadratic weighted kappas range from .63 to .74 for the independent prompts and from .51 to .65 for the integrated prompts. The linear weighted kappas are lower for both prompts, ranging from .29 to .41 for the integrated prompts and from .38 to .49 for the independent prompts. Human-Rater Outliers The bias means and the differences between the ratings of the human raters and their corresponding e-rater score SD (SDDIFF ) values were calculated for each rater. Raters who scored a large number of essays (N > 300) and whose absolute ETS Research Report No. RR-14-04. © 2014 Educational Testing Service
9
Monitoring of Scoring Using e-rater®
Z. Wang and A. A. von Davier
95
95
Percent
(b) 100
Percent
(a) 100
90
85
90
85
80
80 1
2
3
Rater
4
Rater
Figure 5 Boxplots of 31 writing prompts’ percent agreement between human rater and e-rater: (a) adjacent agreement for integrated prompt and (b) adjacent agreement for independent prompt. 1 and 3: Between human rater 1 and human rater 2. 2 and 4: Between human rater 1 and e-rater.
0.9
0.9
Correlation
(b) 1.0
Correlation
(a) 1.0
0.8
0.7
0.6
0.8
0.7
0.6
0.5
0.5 1
2
Rater
1
2
Rater
Figure 6 Boxplots of 31 writing prompts’ correlations between human rater and e-rater: (a) integrated prompts and (b) independent prompts. 1: Correlations between human rater 1 and human rater 2. 2: Correlations between human rater 1 and e-rater.
bias value was ≥0.30 (an arbitrary cutoff value) were listed as potential outlier raters in the study. For the integrated writing prompts (Table 4), 22 harsh and two lenient h1-raters were identified when comparing their ratings to e-rater scores. In terms of the independent writing prompts, 40 h1-raters were identified as harsh raters and no lenient raters were found (see Table 5). Figure 7a and b presents bivariate plots of SDDIFF against their bias values for integrated and independent prompts. In this analysis, e-rater scores were treated as the expert scores against which we would check the h1-rater scores. Figure 7a and b indicates a negative bias (i.e., a tendency for the human raters to rate the essays more harshly than e-rater) for both prompt types. In general, the plots show that h1-raters have the same degree of bias for the independent prompts and the integrated prompts when compared with e-rater scores. On the other hand, however, the SDDIFF values, on average, are larger for the integrated prompts than for the independent prompts, indicating that the differences between the e-rater and h1-rater scores for the integrated prompts fluctuate more than those of the independent prompts. Such patterns are also found in the box plots for each prompt type. Shewhart Control Charts Using Human-Rater Scores We used the Shewhart control charts (see Figures 8 and 9) to identify potential human-rater outliers who were either harsher or more lenient than the other human raters based on h1-rater data only. In this study, we tried the three-sigma 10
ETS Research Report No. RR-14-04. © 2014 Educational Testing Service
Monitoring of Scoring Using e-rater®
Z. Wang and A. A. von Davier
Table 3 Quadratic Weighted and Linear Weighted Kappas for Integrated and Independent Writing Prompts Integrated prompt Prompt ID 2010_11_44A 2010_11_01A 2010_11_77A 2010_11_02A 2010_12_13A 2010_12_34A 2010_12_90A 2010_12_01A 2010_12_01B 2010_12_22A 2010_12_88A 2010_12_99A 2011_01_08A 2011_01_55A 2011_01_29A 2011_01_39A 2011_01_99A 2011_01_33A 2011_02_55A 2011_02_98A 2011_02_99A 2011_02_87A 2011_02_86A 2011_02_86B 2011_03_44A 2011_03_99A 2011_03_82A 2011_03_83A 2011_03_89A 2011_03_95A 2011_03_86A
Independent prompt
N
Quadratic weighted kappa
Linear weighted kappa
Quadratic weighted kappa
Linear weighted kappa
14,009 14,113 13,328 10,608 10,520 5,988 7,333 13,167 13,529 11,565 12,538 19,635 17,995 10,450 7,049 16,091 8,455 13,401 8,777 7,838 12,618 13,108 11,007 14,444 7,220 6,612 10,860 8,505 10,387 8,795 12,950
.57 .54 .53 .59 .60 .54 .51 .56 .52 .64 .57 .65 .60 .58 .55 .56 .57 .58 .61 .64 .57 .55 .57 .56 .57 .61 .59 .60 .56 .54 .62
.34 .33 .33 .36 .37 .33 .29 .34 .32 .41 .34 .41 .37 .36 .33 .35 .36 .36 .38 .40 .36 .34 .34 .35 .35 .39 .37 .38 .34 .33 .40
.68 .63 .69 .69 .71 .66 .71 .68 .67 .70 .71 .70 .72 .72 .72 .66 .70 .68 .69 .70 .70 .66 .73 .69 .74 .72 .73 .68 .71 .69 .70
.43 .38 .44 .44 .46 .42 .46 .43 .42 .45 .45 .45 .47 .47 .48 .42 .45 .43 .44 .45 .45 .41 .48 .44 .49 .47 .48 .43 .46 .44 .45
(a)
(b) 1.4
–0.6
–0.4
–0.2
Standard deviations of differences
Standard deviations of differences
1.4 1.2 1 0.8 0.6 0.4 0.2 0
1.2 1 0.8 0.6 0.4 0.2
0
0.2
Bias
0.4
0 –0.6
–0.4
–0.2
0
0.2
0.4
Bias
Figure 7 Comparison of human raters and e-rater using bias and standard deviations of differences: (a) integrated prompt and (b) independent prompt.
rule first for the fixed control limit, but we found it was too sensitive and had lots of noise for rater analyses; so we used the fluctuating control limit based on three-sigma rule. To further reduce noise, raters were defined as outlier raters if their mean scores were 0.13 beyond either the fluctuating upper or lower control limits. We also found that the six-sigma rule might be a good rule to use as the fixed control limit to identify outlier human raters. In Figures 8 and 9, both fixed control limit based on the six-sigma rule and fluctuating control limit (three-sigma rule) were plotted. To see whether the six-sigma rule is good, we needed other programs to monitor. ETS Research Report No. RR-14-04. © 2014 Educational Testing Service
11
Monitoring of Scoring Using e-rater®
Z. Wang and A. A. von Davier
Table 4 List of Human Rater Outliers Versus e-rater for Integrated Prompts Rater ID
N
Bias
Rater severity
163233 151643 128993 128494 120892 191182 139569 171543 155774 118087 138323 191609 196719 197256 118995 122566 133262 194326 138031 160366 181194 116257 173463 162585
480 438 504 2,156 382 1,364 532 552 738 1,094 2,279 886 1,405 314 1,059 1,679 545 459 2,586 1,224 691 520 337 436
−0.43 −0.41 −0.40 −0.40 −0.38 −0.37 −0.37 −0.37 −0.35 −0.35 −0.35 −0.35 −0.34 −0.33 −0.32 −0.31 −0.31 −0.31 −0.31 −0.31 −0.30 −0.30 0.30 0.33
Harsh Harsh Harsh Harsh Harsh Harsh Harsh Harsh Harsh Harsh Harsh Harsh Harsh Harsh Harsh Harsh Harsh Harsh Harsh Harsh Harsh Harsh Lenient Lenient
Note. Only h1-raters having N > 300 and absolute value of bias >0.30 are listed. The total number of h1-raters was 351; 251 of them had N > 300. 3.5 3.4 3.3
Mean
3.2 3.1 3.0 2.9 2.8 2.7 2.6 1
11
21
31
41
51
61
71
81
91
101 111 121 131 141 151 161 171 181 191 201 211 221 231 241 251
Rater Figure 8 Shewhart control chart of human raters for the integrated prompts. Center line = mean of the scores given by all h1-raters; fluctuating control limit = six-sigma of the mean of each h1-rater; fixed control limit = six-sigma of the mean of the scores given by all h1-raters.
These Shewhart control charts contain all the h1-raters who scored either one or both of the two writing prompt types. Both figures show that the ratings from the h1-raters randomly vary around the mean value. However, some raters’ average ratings are higher than the mean; some of them exceed the UCL by >0.13, while others are below the lower control limit by >0.13. A total of 21 outlier h1-raters were identified for the integrated prompt (see Table 6), seven of whom were identified through an examination of rater bias (Table 4). A total of 37 outlier h1-raters were found for the independent prompts (see Table 7), 20 of whom were also identified through an examination of rater bias (Table 5). It seems that those h1-raters who are identified by Shewhart control charts and who are also very different from their corresponding e-rater scores can be considered as potentially harsh or lenient and, therefore, rater outliers. 12
ETS Research Report No. RR-14-04. © 2014 Educational Testing Service
Monitoring of Scoring Using e-rater®
Z. Wang and A. A. von Davier
Table 5 List of Human Rater Outliers Versus e-rater for Independent Prompts Rater ID
N
Bias
Rater severity
111456 130881 136037 125231 122445 114014 137674 128773 177748 119170 179175 128494 118648 145586 138323 128793 191585 191610 170489 139535 142760 196917 171543 133256 132384 160366 163233 129249 154056 192279 192839 130097 139741 197379 147277 128309 119004 123281 130951 196719
352 1,930 371 371 371 371 371 371 371 371 371 371 371 371 371 371 371 371 371 371 371 371 371 371 371 371 371 371 371 371 371 371 371 371 371 371 371 371 371 371
−0.50 −0.49 −0.46 −0.46 −0.45 −0.45 −0.40 −0.40 −0.39 −0.39 −0.39 −0.38 −0.38 −0.38 −0.38 −0.37 −0.37 −0.37 −0.37 −0.37 −0.36 −0.36 −0.36 −0.36 −0.36 −0.34 −0.34 −0.34 −0.34 −0.33 −0.32 −0.32 −0.32 −0.32 −0.32 −0.32 −0.32 −0.31 −0.31 −0.30
Harsh Harsh Harsh Harsh Harsh Harsh Harsh Harsh Harsh Harsh Harsh Harsh Harsh Harsh Harsh Harsh Harsh Harsh Harsh Harsh Harsh Harsh Harsh Harsh Harsh Harsh Harsh Harsh Harsh Harsh Harsh Harsh Harsh Harsh Harsh Harsh Harsh Harsh Harsh Harsh
Note. Only h1-raters having N > 300 and absolute value of bias ≥0.30 are listed. The total number of h1-raters was 411; 289 of them had N > 300. 3.6 3.5
Mean
3.4 3.3 3.2 3.1 3.0 2.9 0
10 20 30 40 50 60 70 80 90 100 110 120 130 140 150 160 170 180 190 200 210 220 230 240 250 260 270 280 290
Rater
Figure 9 Shewhart control chart of human raters for the independent prompts. Center line = mean of the scores given by all h1-raters; fluctuating control limit = six-sigma of the mean of each h1-rater; fixed control limit = six-sigma of the mean of the scores given by all h1-raters. ETS Research Report No. RR-14-04. © 2014 Educational Testing Service
13
Monitoring of Scoring Using e-rater®
Z. Wang and A. A. von Davier
Table 6 List of Human Rater Outliers for Integrated Prompts, Based on Shewhart Control Chart Rater ID
UCL/LCL
Mean
Difference
Rater severity
173518 173463a 130963 196555 110343 152858 123281 192805 163233a 191182a 128993a 151643 139535 128494a 139497 196719a 162203 122445 128624 128793 158960
3.19 3.26 3.12 3.17 3.23 3.13 3.19 3.22 2.89 2.97 2.90 2.88 2.92 2.99 2.90 2.97 2.99 2.87 2.89 2.99 2.89
3.36 3.42 3.28 3.30 3.34 3.24 3.29 3.32 2.63 2.74 2.69 2.70 2.75 2.84 2.76 2.85 2.87 2.76 2.79 2.89 2.79
−0.17 −0.16 −0.16 −0.13 −0.11 −0.11 −0.10 −0.10 0.26 0.23 0.21 0.18 0.17 0.15 0.14 0.12 0.12 0.11 0.10 0.10 0.10
Lenient Lenient Lenient Lenient Lenient Lenient Lenient Lenient Harsh Harsh Harsh Harsh Harsh Harsh Harsh Harsh Harsh Harsh Harsh Harsh Harsh
Note. UCL = upper control limits; LCL = lower control limits. The UCL/LCL used fluctuating control limits depending on n counts. a Rater was also identified in Table 4.
Human-Rater Variability and Central Tendency We used e-rater scores to monitor human-raters’ variability and central tendencies. A human rater with a much smaller SD than the corresponding e-rater SD on the same essays was considered to be a possible excessive user of similar scores rather than variety of scores. Additionally, if the mean h1-rater scores were close to the middle score of 3 in combination with the small SD values when compared with e-rater scores, then these characteristics were considered to be strong evidence of rater central tendency. A total of seven h1-raters with SD ratio >1.10 between the h1-rater and e-rater scores are presented in Table 8 for the integrated prompt—their h1-rater mean scores ranging between 2.89 and 3.17, which are close to the middle score of 3, indicating some degree of human-rater central tendency. A total of 12 h1-raters with SD ratio >1.10 between the h1-rater and e-rater scores are presented in Table 9 for the independent prompts, with h1-rater mean scores ranging from 3.08 to 3.33, indicating some degree of human-rater central tendency for the independent prompts as well.
Group Comparisons The performance between h1-rater and e-rater for the five largest demographic groups—from China, Korea, India, Japan, and Taiwan—is compared. At the prompt level, the mean raw scores of the independent prompts are higher than those of the integrated prompts for some groups (i.e., China, Japan, and Taiwan) and not necessarily the case for the others (i.e., India and Korea). By making prompt-level comparisons, it is very clear that large h1-rater and e-rater score differences occur in most prompts for groups from one or more countries, mainly in China, Taiwan, and Korea. Small or no h1-rater and e-rater score differences are found from India, followed by Japan. Boxplots of the h1-rater and e-rater mean scores for the 31 prompts for each country can be found in Figure 10. For prompt 2011_03_95A, all the countries, including India, have large h1-rater and e-rater discrepancies—the h1rater raw score means are much higher than the e-rater mean scores (see Figure 11). This prompt differs from the other prompts in that its e-rater scores for the integrated prompts are lower than its h1-rater scores for all the five countries; however, its e-rater scores for the independent prompts are higher than its human-rater scores for all the five countries. 14
ETS Research Report No. RR-14-04. © 2014 Educational Testing Service
Monitoring of Scoring Using e-rater®
Z. Wang and A. A. von Davier
Table 7 List of Human Rater Outliers for Independent Prompts, Based on Shewhart Control Chart Rater ID
UCL/LCL
Mean
Difference
Rater severity
186734 165178 153307 117586 146917 132564 129723 168750 127989 118888 139577 154004 128326 118082 131675 133262 130881a 114014a 125231a 111456a 139535a 136037a 145586a 122445a 128793a 119170a 163233a 132384a 133256a 191585a 118648a 122566 154056a 196917a 138323a 128494a 142760a
3.36 3.44 3.41 3.39 3.37 3.39 3.37 3.37 3.38 3.39 3.41 3.36 3.36 3.40 3.38 3.41 3.25 3.27 3.26 3.19 3.27 3.16 3.23 3.21 3.25 3.27 3.17 3.27 3.27 3.22 3.26 3.23 3.26 3.23 3.26 3.25 3.22
3.62 3.68 3.65 3.63 3.56 3.57 3.54 3.54 3.52 3.52 3.54 3.48 3.48 3.51 3.49 3.51 3.00 3.03 3.02 3.02 3.11 3.01 3.08 3.06 3.10 3.12 3.03 3.14 3.14 3.09 3.14 3.11 3.14 3.12 3.15 3.14 3.12
−0.26 −0.24 −0.24 −0.24 −0.19 −0.18 −0.17 −0.17 −0.14 −0.13 −0.13 −0.12 −0.12 −0.11 −0.11 −0.10 0.25 0.24 0.24 0.17 0.16 0.15 0.15 0.15 0.15 0.15 0.14 0.13 0.13 0.13 0.12 0.12 0.12 0.11 0.11 0.11 0.10
Lenient Lenient Lenient Lenient Lenient Lenient Lenient Lenient Lenient Lenient Lenient Lenient Lenient Lenient Lenient Lenient Harsh Harsh Harsh Harsh Harsh Harsh Harsh Harsh Harsh Harsh Harsh Harsh Harsh Harsh Harsh Harsh Harsh Harsh Harsh Harsh Harsh
Note. UCL = upper control limits; LCL = lower control limits. The UCL/LCL used fluctuating control limits depending on n counts. a Rater was also identified in Table 4. Table 8 List of Outliers for H1-Rater Versus e-rater Standard Deviations for Integrated Prompts Rater ID
N
128834 132923 135868 139303 128865 133256 114157
678 556 705 886 541 2, 102 1, 672
h1-rater mean h1-rater SD e-rater mean e-rater SD h1-rater − e-rater mean differences h1-rater − e-rater SD ratio 2.89 3.17 3.04 2.94 3.13 3.12 3.08
1.00 1.06 1.00 1.01 1.09 1.02 1.03
3.18 3.28 3.31 3.19 3.40 3.25 3.22
1.16 1.22 1.15 1.15 1.23 1.15 1.16
0.29 0.11 0.27 0.25 0.27 0.13 0.14
1.16 1.15 1.15 1.14 1.13 1.13 1.13
Note. The list above is based on the h1-raters whose SD ratio between h1-rater and e-rater is >1.13.
Summary The quality control of human-rater and e-rater scores is essential. This article summarizes some important considerations and illustrated the application of specific statistical and graphical procedures that can help monitoring both human and e-rater performances. Below, we summarize the findings from our research and suggest recommendations for operational practice. ETS Research Report No. RR-14-04. © 2014 Educational Testing Service
15
Monitoring of Scoring Using e-rater®
Z. Wang and A. A. von Davier
Table 9 List of Outliers for H1-Rater Versus e-rater Standard Deviations for Independent Prompts Rater ID
N
119170 145586 124694 128309 152858 125382 155774 140142 123281 118087 191650 119474
1, 398 545 2, 897 417 2, 317 1, 261 498 1, 250 1, 184 1, 735 2, 451 604
h1-rater mean h1-rater SD e-rater mean e-rater SD h1-rater − e-rater mean differences h1-rater − e-rater SD ratio 3.12 3.08 3.21 3.25 3.31 3.33 3.24 3.33 3.18 3.31 3.23 3.27
0.56 0.66 0.70 0.62 0.70 0.66 0.70 0.70 0.71 0.72 0.72 0.71
3.51 3.48 3.50 3.58 3.48 3.52 3.50 3.48 3.49 3.46 3.47 3.45
0.81 0.83 0.81 0.75 0.80 0.79 0.81 0.81 0.81 0.82 0.82 0.81
0.39 0.40 0.29 0.33 0.17 0.19 0.26 0.15 0.31 0.15 0.24 0.18
1.45 1.26 1.24 1.21 1.21 1.20 1.16 1.16 1.14 1.14 1.14 1.13
Note. The list above is based on the h1-raters whose SD ratio between h1-rater and e-rater is >1.13.
(b) 4.5
4.0
4.0
3.5
3.5
Country
TWN_E
TWN_H
KOR_E
KOR_H
JPN_E
CHN_H
TWN_E
TWN_H
KOR_E
KOR_H
JPN_E
JPN_H
1.5 IND_E
1.5 IND_H
2.0
CHN_E
2.0
JPN_H
2.5
IND_E
2.5
3.0
IND_H
3.0
CHN_E
Mean score
4.5
CHN_H
Mean score
(a)
Country
Figure 10 Boxplots of human rater and e-rater of 31 prompts for five demographic groups: (a) integrated prompt and (b) independent prompt. CHN = China; IND = India; JPN = Japan; KOR = Korea; TWN = Taiwan; H = human rater; E = e-rater.
(b) 4
4
3.5
3.5
3
3
2.5
2.5
Score
Score
(a)
2 1.5
2 1.5
H1–rater e–rater
1 0.5
1
H1–rater
0.5 0
0 China
India
Japan Korea Taiwan
China India Japan Korea Taiwan
Figure 11 Example of outlier prompts based on five demographic groups: (a) integrated prompt and (b) independent prompt.
16
ETS Research Report No. RR-14-04. © 2014 Educational Testing Service
Z. Wang and A. A. von Davier
Monitoring of Scoring Using e-rater®
Can We Detect Unusual Human-Rater and e-rater Scores? From the results in the study, we can conclude that some writing prompts have large discrepancies between the h1-rater and e-rater, and we can use human-rater scores to detect unusual e-rater scores, and also we can use e-rater scores to detect unusual human-rater scores. Some statistics and charts such as means, SDs, boxplots, percentages of agreement, correlations, and t-tests are very effective in detecting outlier prompts, human raters, and e-rater scores. We recommend they be used jointly while monitoring human-rater and e-rater scores at the examinee level, test score level, and prompt level throughout the operational cycle. Prompts with large discrepancies between h1-rater and e-rater need further investigation. For example, we can use a second human rater to identify whether a prompt’s e-rater score is an outlier if the first and second human-rater scores are close to each other, or we can use the second human rater to identify whether a prompt’s h1-rater score is an outlier if its e-rater and h2-rater scores are close to each other. According to Davey (2009) and Haberman (2012), the Pearson correlation and quadratic weighted kappa between human-rater and unrounded e-rater scores must equal to or exceed .70 for the approval of an e-rater scoring model. Further, when comparing human-rater and e-rater score differences (e.g., percentage of agreement, correlations, and quadratic and linear weighted kappa) for integrated and independent prompts, it appears that almost all the integrated writing prompts have large gaps between the h1-rater and e-rater, which do not meet Davey’s (2009) and Haberman’s (2012) criteria. That being said, Williamson et al. (2012) indicated that although we may fail to meet the .70 threshold, a scoring model may be used if the human-rater to e-rater quadratic weighted kappas are close to a borderline performance of humans. Some validity studies (Williamson et al., 2012) and a special research study (Haberman, 2011) have already been conducted regarding this situation. These can be deemed acceptable, given that Haberman (2011) pointed out that the independent prompts are less content focused with more accurate e-rater scores than the integrated prompts, where content is more important and the accuracy of e-rater scores is lower. It is clear that careful monitoring of the integrated prompt scores will be necessary and additional investigations should be conducted for e-rater model building work for future integrated writing prompts. Do Human-Rater and e-rater Scores Differ in Terms of Severity? Although it is challenging to determine whether a human rater is accurate or not, two methods were used in this study to identify harsh or lenient human raters: bias analyses using a comparison of h1-rater and e-rater scores and Shewhart control charts using h1-rater scores only. In general, we found that e-rater is more lenient than human raters for both the integrated and independent prompts, but our results indicated that both methods are reliable ways to identify rater outliers and that a combination of both methods could be used in an ongoing fashion to monitor human-rater performances. Can One Detect Human-Rater Central Tendencies? For each h1-rater, the ratio of its SD versus the corresponding e-rater SD were calculated to check for human-rater variability. Human raters who had a smaller SD than the corresponding e-rater SD were identified as lacking variability in the study. If their mean h1-rater scores were also close to the middle score of 3, then they were regarded as raters having some degree of central tendency. Some of the human-rater outliers with some degree of central tendency were identified for both prompt types using their corresponding e-rater scores. Although e-rater scores may have their own issues, and they may not be the perfect metric for evaluating human raters, they can be used as alternative scores to check human-raters’ variability. Does e-rater Work Similarly to Human Raters in Samples of Examinees From Different Countries? By looking at the h1-rater and e-rater raw score mean differences trend for each of the five largest demographic groups, the largest differences occurred for examinees from China, followed by Taiwan and Korea. Japan and India had the smallest discrepancies between h1-rater and e-rater for the independent prompts. For the integrated prompts, Taiwan had the lowest raw score mean differences than those of the other countries. Additional investigations need to be ETS Research Report No. RR-14-04. © 2014 Educational Testing Service
17
Monitoring of Scoring Using e-rater®
Z. Wang and A. A. von Davier
conducted to identify the major reasons why some countries (e.g., China and Taiwan) have higher e-rater scores for some prompts. For integrated prompt 2011_03_95A, all the countries, including India, had large h1-rater and e-rater discrepancies— h1-rater raw score means were higher than those of e-rater, which is not the case for all the other prompts. Further investigation is needed on this prompt. As indicated by Ramineni et al. (2011), more research studies need to be conducted to understand the root causes of these demographically based score differences to determine whether such discrepancies reflect inadequacies of e-rater, human raters, or both. Discussion This study explores some additional analyses using both human raters and e-rater for both the integrated and independent prompts of an English language assessment. The operational team has already implemented some of these procedures (e.g., weighted kappa and standardized mean score differences) for analyzing essay scoring, and inspects the results regularly. The purpose of this article is to integrate the monitoring of scores for both e-rater and h-rater. This study responds to the need for statistical analyses that provide a consistent and standardized approach to monitoring the quality of the CR scoring over time and across testing programs. According to Davey (2009), there is no guarantee that automated scoring will work with all essays, prompt topics or prompt families. Widespread disagreements between automated and human scores can occur if unusual writing surprises and confuses automated scoring algorithms, if a prompt is differentially valued by human and automated scoring, or if the topics or scoring rubrics are incompatible with automated scoring. Unfortunately, the literature on effective quality control procedures using these types of analyses of automated scoring is sparse. The use of graphic representations (e.g., Shewhart control charts, scatter plots, and boxplots) should be an integral part of quality control procedures because they present informative multivariate views of the data and can highlight general trends and correspondence with scoring agreement expectations. The purpose of this article is to illustrate statistical methods for monitoring the scoring process and not to exhaustively compare the e-rater and h-rater. From the data used in this article, it does appear that e-rater gives a higher score than the h1-rater at each raw score point (0, 1, 2, 3, 4, and 5), especially for the integrated prompt. Further research is needed to investigate the generalizability of these findings to more data sets. E-rater scoring seems to exhibit a small bias for specific language groups, but this is mediated by the additional operational procedures, such as the additional human raters. In general, human raters and the e-rater agree fairly well; however, when the e-rater calibration is not based on an appropriate sample or the scoring engine has not been updated, then a large discrepancy with human raters may occur for some prompts. Automated scores are valid only to the extent that the original human scores used to calibrate them are valid; and all they can do is validate whether the essay incorporates the same linguistic structures as essays that received high scores from human raters. Additionally, it is desirable to continue to develop the e-rater individual scoring models as the e-rater generic scoring models have difficulties with individual prompts. The purpose of this article is neither to comprehensively compare the e-rater and the h-rater nor to interpret the causes of the differences between the two scoring methods, but to propose several statistical tools for monitoring the two scoring procedures and for identifying outliers. Our recommendation is that once outliers are identified, then the statistical analysis team, the automated scoring engine experts, and the content specialists and the leaders of the human scorers investigate these outliers. However, we identified some differences between e-rater and human-rater scores across the two types of prompts. Further research is needed to investigate the generalizability of these findings to more data sets. We propose the following potential reasons for the differences detected between the h-rater and e-rater. First, differences in the construct that the human-rater or e-rater measure: as Haberman (2011) pointed out, the e-rater scoring model for independent prompts does not measure content, but the e-rater scoring model for integrated prompts is very sensitive to content. Second, linear model: the operational e-rater scoring in this study was based on the linear model. The linear model may have the issue of regression to the mean, which may produce fewer extreme scores than even human raters. Davey (2009) indicated that e-rater and human scores are imperfectly related owing to this issue. Other models such as cumulative-logit model (Haberman & Sinharay, 2008) should be explored and used for future research. Finally, human rating quality in the training sample: human scores need to be carefully monitored during the automated scoring 18
ETS Research Report No. RR-14-04. © 2014 Educational Testing Service
Monitoring of Scoring Using e-rater®
Z. Wang and A. A. von Davier
process. An automated scoring trained on human scores can emulate the ratings of human scorers (Bejar, 2011), and the development quality of automated scoring is “largely dependent upon the quality of the human scores” (Williamson et al., 2012, p. 7). The statistical assumptions in some of the analyses in this study are based on the randomization of human raters during the rater-assignment process. These analyses include bias analyses using h1-raters and e-rater, Shewhart control charts, and SD analyses. In this report, we recommend using multiple procedures (statistics and plots) to identify outlier human raters or prompts, which may provide an incentive for further investigation. The tables and plots summarize the type of statistics that we recommend. Note that these recommendations are in some sense preliminary, given that our operational experience with e-rater is relatively limited. For future operational work, we recommend that results from the analyses in this study are made available to the scoring department, assessment developers, and automated scoring group so that further steps can be taken to improve the quality of the testing programs, thus enhancing the validity of the assessments. In addition, these tools can be made part of the training materials for psychometricians. Acknowledgments The authors are grateful to Shelby Haberman and Skip Livingston for their advice and valuable insights during the research phase of the project. The authors also thank Yu Sun for her help on plotting some figures and checking the results. The authors also thank René Lawless for her comments and suggestions on the previous version of the manuscript. The opinions expressed in this article are those of the authors and not necessarily of Educational Testing Service.
Notes 1 Kingsbury (1922) categorized rater effects in terms of severity, halo effects, and central tendency. 2 Also used in Way, Vickers, and Nichols’ (2008) study to investigate the effects of different training and scoring approaches to human CR scoring.
References American Society for Testing and Materials. (1976). ASTM manual on presentation of data and control chart analysis (Pub. No. STP15D). Philadelphia, PA: Author. Attali, Y. (2007). Construct validity of e-rater in scoring TOEFL essays (Research Report No. RR–07–21). Princeton, NJ: Educational Testing Service. Attali, Y. (2008). e-rater evaluation for TOEFL iBT independent essays. Unpublished manuscript. Attali, Y., Bridgeman, B., & Trapani, C. (2010). Performance of a generic approach in automated scoring. Journal of Technology, Learning, and Assessment, 10(3), 1–16. Attali, Y., & Burstein, J. (2006). Automated essay scoring with e-rater V.2. Journal of Technology, Learning, and Assessment, 4(3), 1–31. Bejar, I. I. (2011). A validity-based approach to quality control and assurance of automated scoring. Assessment in Education: Principles, Policy and Practice, 18(3), 319–341. Burstein, J., & Chodorow, M. (1999). Automated essay scoring for nonnative English speakers. In M. Broman Olsen (Ed.), Computer mediated language assessment and evaluation in natural language processing (pp. 68–75). Morristown, NJ: Association for Computational Linguistics. Chodorow, M., & Burstein, J. (2004). Beyond essay length: Evaluating e–rater’s performance on TOEFL essays (Research Report No. RR–04–04). Princeton, NJ: Educational Testing Service. Cohen, J. (1988). Statistical power analysis for the behavioral sciences (2nd ed.). Mahwah, NJ: Erlbaum. Davey, T. (2009, April). Principles for building and evaluating e–rater models. Paper presented at the annual meeting of the National Council on Measurement in Education, San Diego, CA. DeCarlo, L. T. (2010). Studies of a latent class signal detection model for constructed-response scoring II: Incomplete and hierarchical designs (Research Report No. RR-10-08). Princeton, NJ: Educational Testing Service. Donoghue, J. R., McClellan, C. A., & Gladkova, L. (2006). Using rater effects models in NAEP. Unpublished manuscript. ETS Research Report No. RR-14-04. © 2014 Educational Testing Service
19
Z. Wang and A. A. von Davier
Monitoring of Scoring Using e-rater®
Engelhard, G., Jr. (1994). Examining rater errors in the assessment of written composition with a many-faceted Rasch model. Journal of Educational Measurement, 31, 93–112. Engelhard, G., Jr. (2002). Monitoring raters in performance assessments. In G. Tindal & T. M. Haladyna (Eds.), Large-scale assessment programs for all examinees: Validity, technical adequacy, and implementation (pp. 261–287). Mahwah, NJ: Erlbaum. Gao, R. (2009). Detect cheating using statistical control methods for computer based CLEP examinations with item exposure risks. Unpublished manuscript. Haberman, S. (2011). Use of e-rater in scoring of the TOEFL iBT writing test (Research Report No. RR–11–25). Princeton, NJ: Educational Testing Service. Haberman, S. (2012). Measure of agreement. Unpublished manuscript. Haberman, S., & Sinharay, S. (2008). Sample-size requirements for automated essay scoring (Research Report No. RR–08–32). Princeton, NJ: Educational Testing Service. Kingsbury, F. A. (1922). Analyzing ratings and training raters. Journal of Personnel Research, 1, 377–383. Lane, S., & Stone, C. A. (2006). Performance assessment. In R. L. Brennan (Ed.), Educational measurement (4th ed., pp. 387–431). Westport, CT: Praeger. Lee, Y.-H., & von Davier, A. A. (2012). Using data mining and quality control techniques to monitor scaled scores. Manuscript submitted for publication. Longford, N. (1995). Models for uncertainty in educational testing. New York, NY: Springer-Verlag. Luecht, R. M. (2010, April). Some small sample statistical quality control procedures for constructed response scoring in language testing. Paper presented at the annual meeting of the National Council on Measurement in Education, Denver, CO. Montgomery, D. C. (1997). Introduction to statistical process control (3rd ed.). New York, NY: Wiley. Myford, C. M., & Wolfe, E. W. (2009). Monitoring rater performance over time: A framework for detecting differential accuracy and differential scale category use. Journal of Educational Measurement, 46, 371–389. National Institute of Standards and Technology. (n.d.). NIST/SEMATECH e–handbook of statistical methods. Retrieved from http://www.itl.nist.gov/div898/handbook/pmc/section3/pmc32.htm Omar, M. H. (2010). Statistical process control charts for measuring and monitoring temporal consistency of ratings. Journal of Educational Measurement, 47(1), 18–35. Patz, R. J., Junker, B. W., Johnson, M. J., & Mariano, L. T. (2002). The hierarchical rater model for rated test items and its application to large-scale educational assessment data. Journal of Educational and Behavioral Statistics, 27, 341–384. Ramineni, C., Trapani, C., Williamson, D. M., Davey, T., & Bridgeman, B. (2012). Evaluation of e-rater for the GRE issue and argument prompts (Research Report No. RR–12–06). Princeton, NJ: Educational Testing Service. Ramineni, C., Williamson, D., & Weng, V. (2011, April). Understanding mean score differences between e–rater and humans for demographic–based groups in GRE. Paper presented at the annual meeting of the National Council on Measurement in Education, New Orleans, LA. Shewhart, W. A. (1931). Quality control chart. Bell System Technical Journal, 5, 593–603. Walker, M. (2005). Proposed rater statistics for TOEFL iBT constructed response. Unpublished manuscript. Wang, Z. (2010). TOEFL Writing Prompt 2 (independent prompt) health check report: Human rater and e-rater. Unpublished manuscript. Wang, Z., & von Davier, A. A. (2010). Proposed procedures to monitor the performance of the human & electronic ratings for all programs. Unpublished manuscript. Wang, Z., & Yao, L. (2011, April). The effects of scoring designs and rater severity on students’ ability estimation for constructed response items. Paper presented at the annual meeting of the National Council on Measurement in Education, New Orleans, LA. Wang, Z., & Yao, L. (2012, April). Investigation of the effects of scoring designs and rater severity on students’ ability estimation using different rater models. Paper presented at the annual meeting of the National Council on Measurement in Education, Vancouver, BC. Way, W. D., Vickers, D., & Nichols, P. (2008, March). Effects of different training and scoring approaches on human constructed response scoring. Paper presented at the annual meeting of the National Council on Measurement in Education, New York, NY. Western Electronic Company. (1958). Statistical quality control (2nd ed.). New York, NY: Author. Williamson, D. M., Xi, X., & Breyer, F. J. (2012). A framework for evaluation and use of automated scoring. Educational Measurement: Issues and Practice, 31(1), 2–13. Wilson, M., & Hoskens, M. (2001). The rater bundle model. Journal of Educational and Behavioral Statistics, 26, 283–306. Wolfe, E. W., & Myford, C. M. (1997, April). Detecting order effects with a multi–faceted Rasch scale model. Paper presented at the annual meeting of the National Council on Measurement in Education, Chicago, IL. 20
ETS Research Report No. RR-14-04. © 2014 Educational Testing Service
Monitoring of Scoring Using e-rater®
Z. Wang and A. A. von Davier
Action Editor: Beata Beigman Klebanov Reviewers: F. Jay Breyer and Chaitanya Ramineni ETS, the ETS logo, E-RATER, GRE, LISTENING. LEARNING. LEADING., TOEFL, and TOEFL IBT are registered trademarks of Educational Testing Service (ETS). All other trademarks are property of their respective owners. Find other ETS-published reports by searching the ETS ReSEARCHER database at http://search.ets.org/researcher/
ETS Research Report No. RR-14-04. © 2014 Educational Testing Service
21