techniques have become unbearable due to the well known power wall. To over- come this issue, processor manufacturers turned to multi-core designs, ...
Monitoring Performance and Power for Application Characterization with the Cache-aware Roofline Model Diogo Ant˜ao, Lu´ıs Tani¸ca, Aleksandar Ilic, Frederico Pratas, Pedro Tom´as, and Leonel Sousa INESC-ID / Instituto Superior T´ecnico, Universidade de Lisboa, Lisbon, Portugal
Abstract. Accurate on-the-fly characterization of application behaviour requires assessing a set of execution-related parameters at runtime, including performance, power and energy consumption. These parameters can be obtained by relying on hardware measurement facilities built-in modern multi-core architectures, such as performance and energy counters. However, current operating systems (OSs) do not provide the means to directly obtain these characterization data. Thus, the user needs to rely on complex custom-built libraries with limited capabilities, which might introduce significant execution and measurement overheads. In this work, we propose two different techniques for efficient performance, power and energy monitoring for systems with modern multi-core CPUs. Here we propose two monitoring tools that allow capturing the run-time behaviour of a wide range of applications at different system levels: i) at the user-space level, and ii) at kernel-level, by using the OS scheduler to directly capture this information. Although the importance of the proposed monitoring facilities is patent for many purposes, we focus herein on their employment for application characterization with the recently proposed Cache-aware Roofline model. Keywords: Power and performance monitoring, application characterization, power and performance counters
1
Introduction
Modern computing systems are complex heterogeneous platforms capable of sustaining high computing power. While in the past designers have been able to improve processing performance by applying power hungry techniques, e.g., by increasing the pipeline depth and, therefore, the overall working frequency, such techniques have become unbearable due to the well known power wall. To overcome this issue, processor manufacturers turned to multi-core designs, typically by replicating a number of identical cores on a single die to increase performance, where each core includes a set of private coherent caches and dedicated execution engines, and in some cases hardware support for multiple threads. Although
these solutions are able to provide extra processing power, they also introduce additional complexity into the design, making it harder for application designers to fully exploit the available processing power. In particular, all cores share the access to a common higher level memory organization, typically containing the last level cache and the main memory, and the contention caused by multiple cores competing for the shared resources can drastically affect the execution efficiency. In addition to the these issues, current trends show us that future processors and applications will have to consider novel techniques to improve power and energy efficiency, potentially leading to extra architectural complexities. In order to characterize and understand the behaviour of such complex computational systems, we require accurate real-time monitoring tools. These allow, for example, to identify application and architectural efficiency bottlenecks for real-case scenarios, thus giving both the programmer and the computer architect hints on potential optimization targets. While many profiling tools have been developed in the latest years, e.g., PAPI [1] and OProfile [2], it is not always easy to convert the acquired data into insightful information. This is particularly true for modern processors, which comprise very complex architectures, including deep memory hierarchy organizations, and for which several architectural events must be analysed. Taking into account the complexity of modern processor architectures and the effects of having different applications running concurrently in multiple cores, Ilic et al. [3], proposed a Cache-aware Roofline model to unveil architectural details that are fundamental in nowadays application and architectural optimization. The Cache-aware Roofline Model [3] is a single-plot model that shows the practical limitations and capabilities for modern multi-core general-purpose architectures. It shows the attainable performance of a computer architecture as an upper-bound, by relating the peak floating-point performance (Flops/s), the operational intensity (Flops/byte), and the peak memory bandwidth for each cache level in the memory hierarchy (Bytes/s), all in the same plot. The model considers data traffic across both on-chip and off-chip memory domains, as it is perceived by the core [3]. In this paper we propose two monitoring methods that combine the advantages of the recently proposed Cache-aware Roofline Model [3], with real-time accurate monitoring facilities in a way that allows application developers to easily relate the application behaviour with the architecture characteristics, thus fostering new application optimizations. The two different monitoring tools proposed herein rely on the Hardware Performance Measurement Counters (HPMCs) and are able to extract in real-time important power and performance characteristics of the running application. While the first of these tools (SpyMon) aims at providing a simple environment that can be used from the user-space, it is complemented by a second tool (KerMon) which allows accurate application profiling by measuring application execution at the kernel level. Both tools are designed to be lightweight, easily adjusted for the user needs, and do not require changing the application code. It thus eases the monitoring of complex parallel
applications that spawn multiple threads, e.g., OpenMP or OpenCL applications running on the CPU. The results reported in this paper illustrate the differences between the two proposed monitoring tools, and show the importance of using such monitoring techniques for the understanding and characterization of application execution on modern general-purpose processors. Overall both monitoring methods are able to provide insightful information about the behaviour of the applications and how its execution is affected by the processor architectural limitations.
2
Performance Monitoring
Most modern processors contain HPMCs that can be configured to count microarchitectural events such as clock cycles, retired instructions, branch misspredictions and cache misses. To count these events, a small set of Model-Specific Registers (MSRs) is provided by each architecture, which limits the total number of events that can be simultaneously measured. For example, on the Intel Sandy Bridge and Haswell architectures, the HPMC facility provides three MSRs types: – the IA32_PERFEVTSELx MSRs, which allow selecting and configuring an event to be monitored by a corresponding IA32_PMCx MSR HPMC; – the IA32_PMCx, which contains the actual counter value; – the MSR_OFFCORE_RSPx MSR, which allows selecting and configuring other events such as the amount of DRAM traffic. To setup an event, one needs to determine the adequate configuration word for that event, which needs to be written into one IA32_PERFEVTSELx MSR. In order to read the counter value it is necessary to read the corresponding IA32_PMCx MSR. Optionally, it is possible to set an initial value into the counter by writing the desired value into the corresponding IA32_PMCx MSR, which is particularly useful to avoid register overflows. If the configured event is an uncore event, it is also necessary to determine the adequate uncore configuration word and write it into the corresponding MSR_OFFCORE_RSPx MSR [4]. On the Intel architectures, HPMC does not provide energy or power consumption measurements. In order to assess this information, the Running Average Power Limit (RAPL) interface must be used. This allows simultaneously obtaining real-time energy consumption readings for several different domains, such as cores, package, uncore or DRAM. The configuration and the reading procedures on these monitoring interfaces are not trivial and require special permissions to be accessed. In order to overcome the referred constraints from the user-space perspective, an MSRDriver library was developed, which provides low level routines for reading and writing to MSRs, allowing us to configure, reset and read the HPMCs. However, for the kernel-space monitoring tool (KerMon) it is possible to directly read and write the MSRs directly. In such a case the MSRDriver tool is not required.
2.1
Related Work
Many tools can be found in the literature that allow monitoring applications using the above referred HPMCs, e.g., PAPI [5], OProfile [2], PerfCtr [6], Permon2 [7], Intel PCM [8] and LIKWID [9]. Here we present a set of two different tools: SpyMon, which targets application monitoring from the user-space, and KerMon, which monitors processor events directly from the kernel-space. The main difference between most of the previously described tools and SpyMon is the fact that the latter follows a core-oriented topology, instead of process-oriented. Thus, it allows monitoring any given application thread, running at any given time, not worrying on which process may have launch them. This allows reducing overheads on the filtering process, keeping the tool simple and headed to its purpose. Furthermore, SpyMon allows for real-time reconfiguration of the HPMCs to be read. Although LIKWID is also one of the few tools which is core-oriented, that tool was designed as a wrapper to the user application and, so far, does not take power consumption into account. Moreover, it does not allow plotting the information according to the Cache-Aware Roofline Model. Some of the above referred tools, do not access the HPMCs directly. They invoke a Linux kernel subsystem called ”Perf Events” (originally ”Performance Counters for Linux”) that provides support for performance events monitoring on the user-space. It is available from Linux 2.6.31 [10] and it is still the only available framework native to the standard Linux kernel to support reading the HPMCs. Since this subsystem is available, user-space tools started to use it in detriment of other drivers, due to the latter requiring kernel or module compilation and installation. PAPI is an example of such a tool that nowadays uses ”Perf Events” instead of another drivers such as the PerfCtr or Permon2 [5]. The ”Perf Events” subsystem, although residing in the kernel, is designed to be invoked by user-space applications. It cannot be called in kernel space without several modifications. Furthermore, on restricted contexts, e.g. an interrupt handler or the task scheduler (where the functions must be fast, simple and cannot sleep), it is impossible to use ”Perf Events” due to its inner complexity. KerMon uses an approach different than SpyMon. It allows accurate profiling by measuring application execution at the kernel level. This allows transparent monitoring of an application even when it is scheduled to a different core. It thus has a wider range of scenarios where it can be used, providing a novel solution to the existing state-of-the-art.
3
User-space application monitoring (SpyMon)
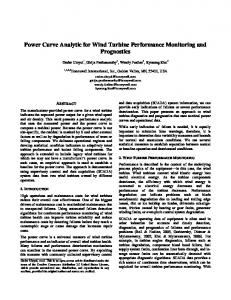
The proposed SpyMon tool is developed for monitoring CPU performance and power consumption. It is designed to be lightweight, simple and adjustable for the user needs. In contrast to most of the state-of-the-art tools, SpyMon follows a core-oriented approach, monitoring the behaviour of each logical CPU and therefore being able to capture the information of all running applications.
Physical6Core60 LC0 LC4 App. 0 (Thread60)
App. 1 (Thread60)
Physical6Core61 LC1 LC5
Physical6Core62 LC2 LC6
App. 0 (Thread61)
App. 0 (Thread63)
Physical6Core63 LC3 LC7 App. 2 (Thread61)
L1
L1
L1
L1
L2
L2
L2
L2
L3 LC6-6Logical6Core
SpyMon6monitor6(master)
SpyMon6spy6(slave)
Fig. 1. Spacial perception of SpyMon while monitoring 5 threads from 3 applications.
The proposed tool is composed of a ”monitor” and several ”spies”, following a master-slave methodology. The monitor (master) is the main process of the tool and is responsible for all the required initializations, for data analysis and processing and for controlling the flow of the whole tool. The spies (slaves) are lightweight processes bonded to a pre-defined logical core and have the sole purpose of configuring and fetching the performance counter readings. The typical SpyMon configuration is to launch a spy to monitor each of the logical cores and to pin the monitor to the last logical core, as shown in Figure 1. The communication is made by means of signals and communication pipes and it is minimized in order to reduce the cache pollution, thus reducing the SpyMon interference with the running applications. The pipes are bidirectional, allowing the master to change, at run-time, the events to be monitored in a logical core (e.g., because a running application changed state, or because it changed logical core). Moreover, other configurations are possible, e.g., if the user requires the monitoring of an application pinned to a specific logical cores, a single spy configuration can be adopted. According to the user needs, the tool can also be configured regarding the performance events to monitor (e.g., retired instructions, L1 misses and number of loads), the time between samples and the number of samples, thus defining the execution time of the tool. The number of events is limited by the number of HPMCs and the number of events available on the architecture. The performance events configuration of each logical core is stored in temporary files during the tool execution. This allows the user to reconfigure the counters of a specific logical core at run-time. SpyMon follows the steps shown in Figure 2. When the application is launched, the master initializes the required drivers (step 1), namely the MSRDriver and RAPL (even though other drivers could be used, as long as they give the tool access to the special purpose registers). Then, the master creates and binds a process (spy) for each logical core to be monitored (step 2), where each spy is responsible for configuring the HPMCs of its logical core (step 3). The configuration is sent by the master through a communication pipe. When the
N Monitor
(1)
(2)
Initiate required drivers
Launch and pin spies to each target core
Request
(3)
(4)
Configure HPMCs
Wait for signal
Spy
(6)
(5)
(7)
HPMCs readings and read energy counters
HPMCs reconfiguration
Send HPMCs readings
Reconfigure HPMCs according to request
(8) Terminate spies and drivers
N signal 1
signal 2
pipe communication
N number of iterations
Fig. 2. SpyMon execution diagram.
configuration is done, each spy gets into a sleep state until its action is required by the monitor (step 4). The monitor has two possible requests (step 5): it may ask for the counter readings (step 6) or for a reconfiguration of the HPMC events to monitor in a specific (or several) logical core (step 7). In step 6, the master signals each spy with signal 1. Each spy reads the raw values of the HPMCs and sends them to the master using the established pipe. Then, the monitor reads the energy HPMCs and derives power consumption, thus completing a sample. In step 7, the monitor signals the corresponding spy (or spies) with signal 2 and sends the required configuration through the pipe. The default request is the one represented in step 6. However, before sending a request, the master checks the time stamp of the performance events configuration files and, if any of them has been updated since the last configuration, step 7 is executed. This procedure is repeated periodically for each sample. During the time between samples, all SpyMon processes are suspended in order to reduce the interference of the tools with the running applications.
4
Kernel-space application monitoring (KerMon)
KerMon follows a different approach than SpyMon; it uses a process-oriented approach by monitoring applications directly from the kernel scheduler. Thus, it allows getting accurate power and performance readings for all individual threads spawn by a monitored application, at the cost of requiring kernel modification by means of a patch. Naturally, the performance readings may still be affected by other running applications, since some HPMCs are not specific to a logical core (e.g., uncore events and energy consumption are shared between multiple logical cores). In other cases, it is possible to get individualized readings, but these are still influenced by other running threads (e.g., L1 and L2 cache misses from logical core 0 are likely to be influenced by the thread executing on logical core 4, as depicted in Figure 1). The Linux task scheduler is currently implemented in a manner that provides a set of classes that can be expanded to design different scheduling levels,
Fig. 3. Algorithm to pick a task to be executed. The dashed elements are implemented by the KerMon patch.
organized by priority. The levels that co-exist in standard Linux distributions are, from highest to lowest priority, Real-Time scheduler and Completely Fair Scheduler (CFS). According to the task scheduler algorithm, each running process is assigned with a specific scheduling level and is scheduled by distributing processor run time to all processes in a fair manner, but taking into account the scheduling levels priority. Thus, when the task scheduler is invoked, it will iterate over the scheduling classes until one of the classes returns a task to be executed, as shown in Figure 3. That implies that the class order in this iterative process reflects its priority. Since the real-time class is the first in the task scheduler order, no CFS task can be executed while there is a real-time task in a runnable state [11]. Taking advantage of the existing scheduling algorithm, a KerMon class was introduced with a priority level between real-time and CFS (see Figure 3). This allows reducing the interference of Linux system applications (e.g. daemons and terminals) on applications being monitored and provides implicit isolation for accurate benchmarking. The new KerMon class is based on modifying a copy of the CFS class to enable power and performance measurement whenever a task is scheduled in/out or a schedule tick occurs. Since within the Operating System (OS) task scheduler interrupts and preemption are disabled, the implementation must be fast, lightweight and cannot go into sleep mode. Due to those strict restrictions, KerMon must rely on raw low-level Central Processing Unit (CPU) interfaces. Thus, for configuring and reading event counters, it uses the HPMC interface; to obtain a measure of time, it simply accesses the Time-Stamp Counter (TSC) register, reading the number of cycles since the system boot; energy consumption is obtained through the RAPL interface.
Fig. 4. KerMon task lifecycle. The dashed elements are implemented by the KerMon patch and the grey elements are performance monitoring actions.
To monitor an application, one needs to use the standard Linux system call sched_setscheduler in order to change the application’s scheduler class into KerMon. Then, the new system call set events must be invoked to instruct KerMon which events need be monitored in this application. The KerMon scheduling class then works as depicted in the task life-cycle in Figure 4. When a task is created (1) and becomes runnable (2), it is put on a logical core runnable list. Thus, when the scheduler picks this task among the runnable ones (3), KerMon configures and starts the event counters by writing to the appropriate HPMCs (4), just before the logical processor is assigned to the task execution (5). The KerMon will then read the HPMCs, forming a monitoring sample and storing it in a task associated buffer, in any of the following occasions: (7) When a scheduler tick occurs1 (6) and at least 50ms of continuous unsampled runtime has occurred. (8) When the scheduler is called for preemption purposes, either because the running time has expired or because the task goes into sleep mode while waiting for some event. When the task is scheduled out, depending on the reason why the scheduler is invoked (9), the task can: go back to the runnable state (2) if it was preempted; sleep waiting for an event to occur (10); or exit, ending its life cycle. An user-space application can then retrieve the samples of a monitored application through the new system call read event log, that fetches the samples from the buffer associated with the application. The samples can be post-processed 1
A scheduler tick is a periodic interruption to update the execution statistics and to check if is necessary to preempt the running task.
TaskA (KerMon)
TaskB (CFS)
TASK5B5- Start5execution
Running
Running Sleeps
Preempted
(lower priority)
(waiting for a resource)
Running
Running
Preempted
TASK5B5- Preemption TASK5A5- Setup5hardware5performance5counters5and5start5execution TASK5A5- Read5performance5counters5and5go5to5sleep TASK5B5- Resuming5execution TASK5B5- Preemption TASK5A5- Task5awake,5performance5counters5setup5and5resuming5execution
(lower priority)
TASK5A5- Scheduler5tick5occurs since550ms5have5elapsed,5the5performance5counters5are5read TASK5A5- Scheduler5tick5occurs since5>50ms5have5elapsed,5the5performance5counters5are5read
Task terminated
TASK5A5- Task5completes5and5the5final5counter5values5are5read Running
Fig. 5. Example of a timeline of two tasks sharing a CPU, where task A executes on KerMon while B executes on CFS. For simplification, in this figure, the tick period is 25ms.
for any purpose such as benchmarking. By having one buffer per monitored application, it is possible to monitor multiple applications in a simultaneous and independent manner. Moreover, it is possible to define different events for various applications. Figure 5 presents an example timeline of two tasks executing on the same logical processor, where task A executes on KerMon scheduling class, while task B executes on the default CFS scheduling class. As it can be observed, applications scheduled on the KerMon class have higher priority than those on the CFS class. Thus, task A forces task B to be preempted whenever it goes to the runnable state. Also, monitoring of task A is triggered whenever it is preempted or whenever a tick occurs and more than 50 ms have elapsed since the last sampling event.
5
Experimental Results
As stated before, in order to assess the potential of the proposed methods, we show the outcome of combining them with the Cache-aware Roofline Model [3]. For that we have executed a group of floating-point applications, selected from the SPEC CPU 2006 benchmark set, on an Intel i7 3770K processor2 . More2
The Intel i7-3770K is an Ivy Bridge based micro-architecture with 4 cores. It operates at 3.5GHz and its memory organization comprises 3 cache levels of 32KB, 256KB and 8192KB, respectively. The DRAM memory controllers support up to two channels (8B) of DDR3 operating at 2x933MHz.
Table 1. Sets of monitoring events used to characterize the execution. Event Set
Event
Description Number of SSE single-precision FP scalar µops executed. Number of SSE single-precision FP packed IVY FP COMP OPS EXE SSE PACKED SINGLE µops executed. Number of AVX 256-bit packed single0 IVY SIMD FP 256 PACKED SINGLE precision FP instructions executed. Number of AVX 256-bit packed doubleIVY SIMD FP 256 PACKED DOUBLE precision FP instructions executed. Number of SSE double-precision FP scalar IVY FP COMP OPS EXE SSE SCALAR DOUBLE µops executed. Number of SSE double-precision FP packed IVY FP COMP OPS EXE SSE FP PACKED DOUBLE µops executed. Qualify any retired memory µops that are 1 IVY MEM UOP RETIRED ALL LOADS loads. Qualify any retired memory µops that are IVY MEM UOP RETIRED ALL STORES stores. Number of lines brought into the L1 data IVY L1D REPLACEMENT cache. IVY LLC REFERENCE Last level cache references. 2 Number of instruction fetches that missed the IVY L2 RQSTS CODE RD MISS L2 cache. IVY OFF CORE MISSES 0 Number of L3 Misses. SSE - Streaming SIMD Extensions; FP - floating-point; AVX - Advanced Vector Extensions; µops - micro-operations IVY FP COMP OPS EXE SSE FP SCALAR SINGLE
over, since the Intel i7 3770K processor only supports simultaneous access to 4 HPMCs, our experimental test set required repeating the execution of every application for each set of 4 events as specified in Table 1. The monitoring results obtained for the different events’ sets were combined a posteriori by using as reference the number of instructions executed in each time interval (the number of instructions was obtained from the fixed counter IINSTRUCTION:RETIRED [4]). Figure 6 shows the performance results for each SPEC CPU 2006 benchmark application as obtained with the two proposed monitoring methods. The results are plotted as points representing the overall (average) performance results, superimposed to the roofline model derived in [3]. Moreover, the points are plotted against different lines that represent the maximum achievable performance of the Intel 3770K processor for double-precision MUL and ADD arithmetic instructions of different vectorization widths: scalar, Streaming SIMD Extensions (SSE) and Advanced Vector Extensions (AVX). Aside from calculix, which we analyse further below, all other applications show a similar performance behaviour in both cases. Moreover, we also show the overall power and energy results in Figure 7 obtained with both monitoring methods. As for performance, also for power and energy we observe the same trends for both methods, although SpyMon incurs in a small constant overhead due to the active monitoring threads. In order to explore the potential of the features introduced in the proposed tools we show a more thorough analysis for two applications, calculix and tonto. A more fine-grained analysis of the application behaviour is important because, in many cases, the same application may show different behaviours during the execution. Events that may affect the execution over time are: fluctuations of the pressure on the memory subsystem, different types of instructions may be executed simultaneously creating bottlenecks in different points of the micro-
25
23 2
/S 2 AVX
21
DBL
DR
OA
L1 L
SE
ine
oofl
SSE (ADD,MULL) Roofline DBL (MAC) Roofline
e
D
OA
L1 L
flin Roo
DBL (ADD,MULL) Roofline
20 2
01
202 203 205
games lbm milc
GemsFDTD calculix gromacs
namd povray soplex
sphinx3 tonto DBL
AVX MAC Roofline
24
AVX (ADD,MULL) Roofline SSE (MAC) Roofline
PerformanceX[GFlops/s]
PerformanceX[GFlops/s]
2
25
AVX MAC Roofline
4
23 2
/S 2 AVX
21
DBL
204 203 202 OperationalXIntensityX[flops/bytes]
SSE (ADD,MULL) Roofline DBL (MAC) Roofline
e
D
OA
L1 L
flin Roo
DBL (ADD,MULL) Roofline
201
203 205
201
ine
20
202 SSE AVX
oofl
DR
OA
L1 L
SE
AVX (ADD,MULL) Roofline SSE (MAC) Roofline
games lbm milc
GemsFDTD calculix gromacs
namd povray soplex
sphinx3 tonto DBL
SSE AVX
204 203 202 OperationalXIntensityX[flops/bytes]
(a) KerMon
201
(b) SpyMon
Fig. 6. Application roofline model plot for i7 3770K, showing the floating-point SPEC 2006 benchmarks; the application colour characterization was made according to average classification (double, SSE or AVX) Power
Energy
14000
30
12000
25
20
8000 15 6000 10
4000
Power8[W]
10000 Energy8[J]
Power8[W]
25
Power
14000
Energy
12000 10000
20
8000 15 6000 10
Energy8[J]
30
4000
5
2000
5
2000
0
0
0
0 to
s
3
nx
ay
ex
d
o
hi
pl
vr
nt
sp
so
m
po
ilc
na
m
s
ac
TD
D
ix
es
om
m
lb
gr
m
ga
sF
ul
lc
em
ca
G
3
nx
o
hi
ay
ex
pl
s
s
ac
d
vr
nt
to
sp
so
m
po
na
ilc
om
m
m
lb
gr
TD
D
ix
es
m
ga
sF
ul
lc
em
ca
G
(a) KerMon
(b) SpyMon
Fig. 7. Average power and energy consumption for the execution of the different benchmarks
architecture, overflow of HPMCs, system changes, execution uncertainties and other non-deterministic behaviours, just to name a few. The outcome of these effects is clearly depicted for calculix that gives a different result for each monitoring method. In fact, just by observing the results depicted in Figure 6 would lead us to classify calculix as a memory-bound (KerMon) or as a compute-bound (SpyMon). Nevertheless, these effects are also valid for other applications, for which the single observation of the average point may be misleading, thus requiring a more detailed analysis. However, when the execution is broken into smaller samples (50 ms) one can perform a more accurate analysis. This is illustrated for calculix in Figure 8(a) and Figure 8(b), where we can observe that the application comprises two very distinct behaviours, which are now consistent across both methods: i ) on the bottom-left of the roofline plot a significant number of samples appears in the memory-bound region, and ii ) on the top-right side of the roofline we observe two patterns of points, one for AVX instructions, and a second for simple double-precision instructions, both more towards the compute-bound region. In particular, in ii) we can observe that the program
PerformanceD[GFlops/s]
DBL
SSE AVX
20 2-4 2-8
(1) AVX (MAC) Roofline (2) AVX (ADD,MULL) / SSE (MAC) Roofline (3) SSE (ADD,MULL) / DBL (MAC) Roofline (4) DBL (ADD,MULL)Roofline
2-12 2
-16
2
-14
2
-12
2
-10
2
-8
2
-6
2
-4
2
-2
2
DBL
SSE AVX
20 2-4 2-8
(1) AVX (MAC) Roofline (2) AVX (ADD,MULL) / SSE (MAC) Roofline (3) SSE (ADD,MULL) / DBL (MAC) Roofline (4) DBL (ADD,MULL)Roofline
2-12
0
2
-16
2
-14
2
-12
2
-10
2
-8
2
-6
2
-4
2
-2
2
0
OperationalDIntensityD[flops/byte]
OperationalDIntensityD[flops/byte]
(a) Roofline (KerMon)
(b) Roofline (SpyMon)
30
30 DBL
SSE AVX
28 Power [W]
28
Power [W]
(1) (2) (3) (4)
24
PerformanceD[GFlops/s]
(1) (2) (3) (4)
24
26
24
22
26
24
22 DBL
20
20 0
20
40
60
80 Time [s]
100
120
140
(c) Power consumption (KerMon)
160
0
20
40
60
80 Time [s]
100
120
SSE
AVX 140
160
(d) Power consumption (SpyMon)
Fig. 8. Monitoring performance and power of Calculix; for simplification purposes, the L2, L3 and DRAM load rooflines for AVX, SSE and DBL instructions are not represented in plots a) and b)
sections where AVX instructions are more predominant tend to be more affected by the memory execution than the program sections dominated by scalar double-precision instructions. Moreover, Figure 8(c) and Figure 8(d) show the power results sampled over time. The characterization of tonto is depicted in Figure 9(a). In this case we also observe two distinct regions in the roofline, namely corresponding to scalar instructions and to SSE instructions. In contrast to the calculix case, here the application shows a memory-bound behaviour, although near the compute bound region. The results obtained for the power consumption over time are also depicted in Figure 9(b). In this case, the results show that the distinct regions observed on the roofline plot, are also clearly differentiated in time, showing a heterogeneous execution pattern. We can conclude from this analysis that tonto uses different parts of the architecture more intensively in very distinct time instants. In order to better illustrate this behaviour, we combined the results shown in Figure 9(a) with the execution over time and have created a temporal representation of the application Roofline. The plot in Figure 10 eases the visualization of the different program sections over time.
24
30
2
DBL
28
SSE (ADD,MULL) / DBL (MAC) Roofline 2
Power [W]
Performance/[GFlops/s]
AVX (ADD,MULL) / SSE (MAC) Roofline
23
DBL (ADD,MULL) Roofline
21 20
SSE AVX
26
24
22
DBL
2-1 -5 2
2
-4
2
-3
2
SSE AVX
-2
2
20
-1
0
Operational/Intensity/[flops/byte]
(a) Roofline
20
40
60
80 Time [s]
100
120
140
160
(b) Power consumption over time
Fig. 9. Monitoring performance and power of Tonto using KerMon
Performance [GFlops/s]
23 22 21 200
-3
40
2 80
120
Time [s] DBL
SSE AVX
160
200 2-5
-4 ty 2 ensi l Int iona/byte] t a r Ope [flops
Fig. 10. Temporal representation of the Roofline for Tonto (KerMon)
6
Conclusions
In this paper we propose two new tools for application monitoring and characterization, which extract runtime information at different OS levels, namely: SpyMon at user-space level and KerMon at kernel-space level (OS scheduler). These tools combine the accuracy of hardware measurement facilities, which are integrated in modern multi-core architectures, with the Cache-Aware Roofline Model. This allows run-time characterization of application execution and allows extracting important guidelines for application optimization. The experimental results presented in this paper show that both KerMon and SpyMon obtain similar performance characterization results. However, SpyMon, which performs core-oriented characterization, may show an increased powerusage if set to monitor cores which are not being used by any of the running applications. On the other hand, since KerMon requires changing the OS scheduler, it is harder to install in a system and requires root access. Despite these differences, in overall, both monitoring methods allow a user/programmer to get a clear picture of the behaviour of the application and how its execution is affected by the processor architectural limitations.
Acknowledgments This work was partially supported by national funds through Funda¸c˜ao para a Ciˆencia e a Tecnologia (FCT) under projects P2HCS (ref. PTDC/EEIELC/3152/2012), Threads (ref. PTDC/EEA-ELC/117329/2010), and project PEst-OE/EEI/LA0021/2013.
References 1. Browne, S., Dongarra, J., Garner, N., Ho, G., Mucci, P.: A portable programming interface for performance evaluation on modern processors. International Journal of High Performance Computing Applications 14(3) (2000) 189–204 2. OProfile: About oprofile. (August 2012) http://oprofile.sourceforge.net/ about/. 3. Ilic, A., Pratas, F., Sousa, L.: Cache-aware roofline model: Upgrading the loft. IEEE Computer Architecture Letters (April 2013) 4. Intel: Intel 64 and ia-32 architectures software developer’s manual: Volume 3b. (August 2012) 120 – 251 http://download.intel.com/products/processor/manual/ 253669.pdf. 5. PAPI: Papi: Supported platforms: Currently supported. http://icl.cs.utk.edu/ papi/custom/index.html?lid=62&slid=96. 6. Curtis-Maury, M., Nikolopoulos, D., Antonopoulos, C.: Pacman: A performance counters manager for intel hyperthreaded processors. In: Quantitative Evaluation of Systems, 2006. QEST 2006. Third International Conference on. (2006) 141–144 7. Eranian, S.: Perfmon2: a flexible performance monitoring interface for linux, Citeseer (2006) 8. Intel: Intel performance counter monitor - a better way to measure cpu utilization. (August 2012) http://software.intel.com/en-us/articles/ intel-performance-counter-monitor-a-better-way-to-measure-cpu-utilization. 9. Treibig, J., Hager, G., Wellein, G.: Likwid: A lightweight performance-oriented tool suite for x86 multicore environments. In: Parallel Processing Workshops (ICPPW), 2010 39th International Conference on, IEEE (2010) 207–216 10. LWN.net: Perfcounters added to the mainline. (July 2009) http://lwn.net/ Articles/339361. 11. Molnar, I.: Goals, design and implementation of the completely fair scheduler. https://www.kernel.org/doc/Documentation/scheduler/sched-design-CFS. txt.