Moticons: Detection, Distraction and Task
Lyn Bartram
Colin Ware
Tom Calvert
Colligo Networks, Inc.
Data Visualization Lab University of New Hampshire
Technical University of British Columbia
[email protected]
[email protected]
[email protected]
Abstract In this paper we describe an empirical investigation of the utility of several perceptual properties of motion in information-dense displays applied to notification. Notification relates to awareness and concerns how dynamic information is communicated from the system to the user. The results show that icons with simple motions, termed moticons, are effective coding techniques and in fact outperform colour and shape codes, especially in the periphery. Comparisons of different motion types reveal how different attributes of motion contribute to attention, identification and distraction and provide initial guidelines on how motion codes can be designed to support awareness in information-rich interfaces.
Introduction Users typically function in multi-task environments in which information is distributed across windows and applications and is not necessarily exclusive to the task at hand. For example, a financial analyst may be monitoring stock market quotes while reviewing a client’s portfolio and evaluating performance patterns over time. Simultaneously she may be cued as messages to do with office administration arrive from her colleagues. Alternately, a telecommunications manager may be planning scenarios for equalizing phone traffic across variably-loaded channels while sporadic alarms indicate overloads on current routes. In both cases these users are being made aware of dynamic information outside the specific scope of the data they are using for their current tasks. In some cases certain types of dynamic information are contained in a dedicated display which the user must constantly monitor, such as a stock ticker or message flag. These displays are typically located on the periphery of a screen (McCrickard 2000, Maglio and Campbell 2000, Czerwinski et al. 2000). In other cases the changing information can be located anywhere in the visual field, such as mode information or element state directly tied to data objects in the displays (Sarter and Woods 1995, Mitchell and Sundstrom 1997). Monitoring dynamic information can be a cognitively strenuous task which requires the user to examine the currently displayed information and decide whether it has changed, so it is preferable to explicitly alert the user to a change by a signal. Signals are graphical events which indicate to the user that something has happened in some area in the display. Replacing an “empty mailbox” icon with a “full mailbox” to show email status or animating the transformation of old text into new in a peripheral display (McCrickard 2000) are examples of signals. Signals are incorporated into peripheral awareness tools (McCrickard 2000, Maglio and Campbell 2000), Moticons: Detection, Distraction and Task
1
messaging (Parsowith et al. 1998, Cutrell et al. 2000), state changes, system events, or alarms (Adams et al. 1995). They can also be used as navigation markers or guides to dynamically emphasise relevant points in a display. Current information visualization interfaces rely heavily on graphical coding devices (also termed display dimensions) such as shape, colour, size, texture, orientation and position (Ware 2000). These schemes can be very effective in enabling information analysis because they are mentally economical (Woods 1991, Healey et al. 1995): rapidly and efficiently processed by the preattentive visual system rather than attentive effort. However, only a small amount of information can be encoded in each visual dimension. For example, a typical recommendation is that no more than eight colours be used to define information categories (Gilmore et al. 1989, Shneiderman 1986). For this reason there is a shortage of perceptually efficient codes than can be used in information-rich user interfaces. One promising way of visually coding information is to use simple motion. Motion has a unique ability to attract attention over a large visual field and offers a rich graphical vocabulary. Its use has only recently become feasible due to the advent of fast graphics processors and supporting software technologies. However, compared with the use of colour coding, which is supported by a large literature of design guidelines based on decades of experimental studies, there has been little research relating to the effective design of motion codes. Such work is urgently needed because available technologies such as Javascript and image animation have led to a riot of moving and jiggling icons that compete for our attention. The notification studies described in this paper investigated the effects of moving icons, which we call moticons, as alerting mechanisms in situations where the user is engaged in a primary task and needs to be made aware when an event occurs outside the task area.
Background Research into human perception tells us a great deal that is relevant to the use of icon motion as a coding mechanism. Of special interest is the fact that motion triggers a kind of orienting response, attracting a user’s attention, even when it appears in the periphery of the visual field (Faraday and Sutcliffe 1997). Motion compares very favourably to colour and shape if we are concerned with designing icons to attract a user’s attention at the edge of a computer screen. The human visual system is very non-uniform with respect to our ability to resolve detailed information. For example, we can only resolve about one tenth of the detail about ten degrees of visual angle to the side of the point of fixation (Smith and Atchison 1997). Thus icons that rely on detailed shape to convey their meaning are only effective if directly fixated. Our ability to discriminate colour information is also very non-uniform across the visual field. In fact in the periphery we are almost colour-blind (Wyszecki and Stiles 1982). One of the great potential advantages of motion as an attention-getting device is that our ability to perceive motion falls off much less towards the periphery of the visual field. Peterson and Dugas (Peterson and Dugas 1972) confirmed this in an applied setting that showed static targets to be virtually invisible in the far field whereas moving targets were easily detected. Moticons: Detection, Distraction and Task
2
Our ability to see things at the edge of a computer screen may vary with our level of attention to the task we are performing. A “searchlight metaphor” has been used to model how attention falls off in the visual periphery as a function of the cognitive load or the stress level of an operator (Wickens 1992). A phenomena known as tunnel vision occurs under conditions of very high stress, but even under relatively low stress conditions the focus of attention narrows considerably (Williams 1985). Focusing attention in a visually “noisy” field requires the user to both maintain control of where she is attending and awareness of potentially interesting areas as conditions change. Woods defines several criteria for signals he terms cognitive tools to support control and direction of attention (Woods 1995): accessibility (i.e., the user should be capable of picking them up without losing track of current activities); partial information (the signal should carry enough partial information for the user to pick up whether to shift attention to the signalled area); and mental economy (the representation should be processed without cognitive effort). Because other information can remain on the screen while a user attends to a moving signal, it may provide the required accessibility. Because motion can be registered in the periphery it may be ideal for conveying partial information, and because motion is pre-attentive it may have the required characteristic of mental economy. However, all of these qualities require experimental verification in task-related studies. The human visual system is very good not only at perceiving but also at tracking and predicting movement. We can track up to five moving objects in parallel (Pylyshyn et al. 1993) without effortful context-switching. Hillstrom and Yantis (Hillstrom and Yantis 1994) suggest that it may not be motion per se that attracts attention, but rather the appearance of a new object in the visual field. These findings suggest that introducing extensive motion into user interfaces may be problematic. When a new object gains the attention of the tracking system, another object will typically be lost. This can lead to problems occurring with distracting irrelevant items. In particular the moving banner animations that grace many web pages may be particularly effective in distracting us. Previous studies with moving icons Blinking can be considered to be an elementary form of motion and much use has been made of blinking in user interfaces to attract and direct visual attention. In many systems it is the primary visual cue for alarm conditions. However, anecdotal evidence indicates that people find blinking excessively annoying and visually ineffective when too many items are flashing (who has not cursed the WWW HTML blink function?) In large-scale systems where alarms tend to propagate rapidly, over-flashing not only reduces effective alarm information but also renders the displays visually disturbing, distracting users from effectively perceiving the needed information from other representations (Gilmore et al. 1989,Sarter and Woods 1995,Woods 1995). Ware investigated the use of a simple moving icon as a “human interrupt” signal in the interests of seeing if this would evoke the same direct pull of attention as blinking or flashing without causing the associated irritation (Ware et al. 1992). Subjects performed a primary task and were told to respond by hitting a key when they noticed movement of one of two small icons on either side of the top of the display. The icon was a small bar which grew and shrank vertically in an smooth, oscillatory fashion. Amplitude, side and velocity of the movement were varied. There was no effect for amplitude or side, but increases in velocity led to an increase in the number of quick Moticons: Detection, Distraction and Task
3
responses and a decrease in the number of long ones. The good average response times indicated that subjects had no trouble noticing the interruption without any reported irritation factor. Even the slowest times were acceptable and were reported to be less irritating. One way of using simple animation is in illustrating a simple procedure. Baecker and Small animated icons to identify and explain their function (Baecker and Small 1990). The advantages of animation were particularly noticeable when the small size of icons meant a low resolution of information (i.e., intricate depiction was impossible). Ambiguity was reduced and users remembered the function of the particular icon better. McCrickard and Stasko investigated how animated information could be used to maintain peripheral awareness (McCrickard et al. 2000). While subjects browsed through on-line text, additional information would appear in a secondary window in one of three ways: the words would fade slowly in, would scroll across the window, or would suddenly appear (“blast in”). None of these cues was found sufficiently distracting to impede the primary task, but as might be expected from the theory of perceptual onset (Hillstrom and Yantis 1994) the blast was the most effective in getting attention.
Motivation The experiments in the detection and distraction studies reported here were designed to address a number of questions that relate to the use of motion signals as a cognitive tool (Woods 1995) for managing attention. A dual task design was used to simulate situations common in current desktop environments where the user is engaged on a primary task that takes most of her attention. We are interested in the kind of situation awareness where a change in an icon is used to signal some event, such as the arrival of mail, new users in a conference, or system events like a printer jam. Experiments 1 and 2 dealt with detection; Experiment 3 looked at distraction effects. The first two experiments investigated how moving icons compare to both colour and shape in attracting a user’s attention. A large screen display was used to address the issue of how far in the periphery motion can be effective compared to colour and shape. Large displays are becoming increasingly common as the focus for work-group activities; we believe that most of the results also apply to desktop displays, especially in multiple-monitor configurations. Such peripheral issues arise in interfaces any time users need to see dynamic information outside the foveal area. This happens frequently in several circumstances: multiple monitor configurations, large screens, or small peripheral awareness displays (see (McCrickard 2000) for a review). Indeed, even standard desktop 21” displays where information is located in tool- and menubars along the edges of the screen can result in poor information detection and discrimination due to peripheral effects (Maglio and Campbell 2000). Finally, in any environment in which users are not guaranteed to be looking straight ahead at a display all the time peripheral vision is a factor.
Experiments 1 and 2: Signal Detection and Identification There were two experiments in the detection study. Experiments 1A and 1B compared how well simple motion cues were detected compared to colour and shape cues respectively and Moticons: Detection, Distraction and Task
4
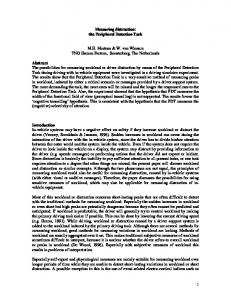
how these varied with distance from the locus of attention (the primary task window). Both detection rates and detection times were measured. Experiment 2 took a more ecological approach: it combined colour, shape and motion cues and investigated how well they performed in a more complex screen in both detection and identification: i.e., how accurately the subject could identify which object in the visual field had changed. The first experiment had the purpose of evaluating the effectiveness of different kinds of motion, relative to colour change, or shape change, in signalling users across a wide visual field populated with icons. A wide field of view was used to investigate both near-field and far-field conditions. The cues were colour change, shape change and two linear motions (up and down) of the same frequency but different amplitudes. The first part (Experiment 1A) compared colour cues to motion cues. The second part (Experiment 1B) compared shape cues to the same motion cues. We measured the error rate and response time for detection (noticing that something had changed). Subjects performed both 1A and 1B in a single session; ordering was counter-balanced. We had five hypotheses for this experiment: H1: Colour icon detection rates fall off as distance increases from the centre of attention and times increase (Experiment 1A). H2: Moving icon detection rates are higher than colour detection rates and detection times are shorter (Experiment 1A). H3: Shape icon detection rates fall off as distance increases from the centre of attention and times increase (Experiment 1B). H4: Moving icon detection rates are higher than shape detection rates and detection times are shorter (Experiment 1B). H5: Motion detection rates and times will not be significantly affected by distance (1A and 1B). H6: Smaller motions lead to lower detection rates and longer detection times (1A and 1B). 116cm
111.3 cm
Figure 1.
95 cm
111.3 cm
Subject position and screen width
Most of the method was the same for 1A and 1B. We describe this common method first.
Moticons: Detection, Distraction and Task
5
Screen layout
Figure 2.
One trial of Experiment 1A. The arcs were not displayed.
A wide rear-projected screen was used. The dimensions of the projector screen were 116 cm x 87 cm. The resolution of the screen was 800 x 600 pixels which translated to approximately 145 mm/pixel. The subject was seated in front of the screen at 95 cm as illustrated in Figure 1. The primary task area of approximately 11.6 cm was placed at either the left or the right of the stimulus window such that it was vertically centred and had a horizontal margin on each side of roughly 2.9 cm. Figure 2 shows one screen layout with the primary task located on the left. The range of stimulus positions subtended a field of view from approximately 7 to 52 degrees of visual angle from the centre of the primary task window. The screen was located in a graduate research lab and the overhead fluorescent lights were dimmed for the experiment. No other special considerations were applied, so that subjects were often doing the experiment while other work was going on the lab with normal (moderately quiet) noise levels. Figure 2 illustrates the screen layout. Primary Task Subjects were asked to carry out a simple editing task in a window which was located either to the left or the right on a larger window (see Figure 2). The small window contained a scrollable table of numbers from 0 to 9 and the subject was instructed to find all the 0s in the table and replace them with 1s. A static counter in the upper left hand corner showed the total number Moticons: Detection, Distraction and Task
6
of 0s in the table; a running counter in the upper right hand corner indicated the number of 0s currently found and replaced by the subject. Subjects could use the arrow keys and/or the mouse and scrollbar to navigate through the table. Secondary Task The larger window contained 15 icons, of which one might change according to one of the cues (motion, colour or shape). In a fifth of the trials nothing would happen. Upon detecting a change subjects were instructed to hit the CONTROL key, thereby ending the trial. Each of the 15 icons was randomly positioned on an arc at fixed radial distance from the centre of the task window, as illustrated in Figure 2. Icons were positioned in near and far conditions such that the NEAR targets were positioned on arcs 1-5 and the FAR targets were positioned on arcs 11-15. The NEAR targets subtended a field from approximately 7 to 20 degrees of visual angle, while the FAR targets subtended a field from approximately 40 to 52 degrees of visual angle. The target was randomly determined for each trial from the respective set of 5 icons. None of the icons on the arc 6 through 10 was ever a target. Each icon was bounded by a rectangle of 2 cm x 2 cm. This corresponded to roughly one degree of visual angle at the viewing distances we used. Cue onset occurred between 5 to 20 seconds after the trial started. Cue onset was randomly selected from this 15 second range for each trial. Each cue lasted 5 seconds. If no detection was indicated the trial timed out after 30 seconds. Experiment Subjects: 12 SFU students in either Computing Science or Psychology participated in the study. There were 6 males and 6 females. None were colour-blind although 5 wore glasses. Subjects were paid to participate. Experiment Conditions The 4 (cue type) x 2 (distance) factor design produced 8 cue conditions. An additional 2 no cue (NO_CUE) control conditions were added resulting in 10 conditions overall. Thus in 20% of the trials nothing happened and the trial timed out. A trial block contained 2 repetitions of each condition for a total of 20 trials. The ordering of conditions was randomized within a block independently for each subject. Trials were combined into 4 blocks of 20 trials each. Blocks were repeated 4 times totalling 80 trials per subject. The task position was counter-balanced for left and right position and changed with each block. An equal number of subjects started with the task in the left position and in the right position. Each block was subject-initiated, so that subjects could pause between blocks if desired. All subjects were given a training block of 10 trials with all cues before each study so that the subject was comfortable with the primary task and had seen all cues before the experiment. Motion cues There were two motion conditions. In the high amplitude condition (HIGH_AMP) the icon moved smoothly up and down along a path its own height (2 cm) with sinusoidal motion, a disMoticons: Detection, Distraction and Task
7
Figure 0-1. Icon shapes used in Experiment 1A
tance which covered approximately one degree of visual angle. In the low amplitude motion (LOW_AMP) the path length was the half the height of the icon (1 cm) or approximately half a degree of visual angle. Frequency was roughly 3 Hz.
Experiment 1A: Colour vs. motion Method In Experiment 1A two colour signals were evaluated together with the two motion signals. 6 icon shapes were used and all were initially coloured black. Icon shapes were randomly assigned on each trial from a set of 6 canonical shapes shown in Figure 0-1. The colour signals were a colour change to RED (RGB 255,0,0) or GREEN (RGB 0,255,0). Results: Experiment 1A The results from experiment 1A are summarized in Figures 3 and 4 showing detection error rates and detection times respectively. Detection times were faster with the moving icons and error rates were lower (H2). A multiway analysis of variance showed both cue and location
error rate 30% 25% 20% 15% 10% 5%
location
0% NEAR
GREEN
Figure 3.
RED
FAR
HIGH AMP
LOW AMP
NONE
Mean detection error rates: colour vs. motion (Experiment 1A)
Moticons: Detection, Distraction and Task
8
msms
6000 5000 4000 3000 2000 1000
0
NEAR GREEN
Figure 4.
FAR RED
HIGH AMP
location
LOW AMP
Mean detection times: colour vs. motion (Experiment 1A)
effects to be highly significant for detection rates: cue was F(4,48)=14.098, p