735-743. [7] J. Engström, “The Tactile Detection Task as a Method for Assessing ... Victor, “Specification of a secondary task to be used in Safety. Assessment of ...
ACHI 2015 : The Eighth International Conference on Advances in Computer-Human Interactions
Implementing the Tactile Detection Task in a Real Road Experiment to Assess a Traffic Light Assistant
Michael Krause, Verena Knott, Klaus Benger Institute of Ergonomics Technische Universität München Garching, Germany emails:{krause, knott, bengler}@ lfe.mw.tum.de Abstract— The tactile detection task (TDT), a vibrating detection response task (DRT), was used to assess the mental demand of an in-vehicle information system (IVIS), which recommends a driving speed to the driver on a smartphone. In the experiment, the TDT was recorded as a single task, with the driving task as a baseline as well as with additional IVIS task, and with a cognitive task as reference and control. Results show that IVIS use did not significantly prolong the TDT reaction times, which can be interpreted as no increase in mental workload caused by the IVIS. The control task increased the reaction times significantly. The data of the real road experiment are analyzed in terms of correlations showing that the TDT was a reliable cognitive workload measurement tool in the experiment. Sideline: Driven speed revealed no correlation with TDT reaction times when the vehicle was in motion. Keywords-IVIS, cognitive workload
detection
I.
response
task;
smartphone;
INTRODUCTION
A traffic light assistant for rural roads was developed on a smartphone in the Bavarian KOLIBRI project. The project involved human factors engineering along the whole project. The development was started in a static driving simulator for safety reasons. Selection of a favored graphical interface was done, related specifically to gaze behavior and assessment of the driving behavior, while using the assistant in the simulator [1][2]. After the system was validated in the simulator, further experiments were carried out on the real road. The mental demand needed to use the system is reviewed in the paper presented here. Pauwelussen et al. [3] assessed their green wave assistant system in a driving simulator with a visual peripheral detection task (PDT), which would now be called (head mounted) detection response task (HDRT). They found for their system a significant increase in the reaction times of participants, which is interpreted as increased mental demand. An interface similar to Pauwelussen et al. [3] was not liked by our participants and was opted out by subjective ratings in an early stage of the development process [4]. The work presented here assesses the mental demand of the developed traffic light assistant, but has a focus on tactile detection task method (TDT) used.
Copyright (c) IARIA, 2015.
ISBN: 978-1-61208-382-7
The TDT is a version of the detection response tasks (DRT), which is currently subject to standardization by ISO TC22 SC13 WG8. Section 2 will describe the methods, used in this experiment. In section 3 the results are presented and discussed; first the subjective ratings from questionnaires, than the objective measurement from the TDT. The TDT results were correlated between different experimental conditions, to the subjective ratings and to the driven speeds. II.
METHODS
A. Test Environment - Test Track A section of federal road 13 (B 13) in the North of Munich was used for the individual test runs of the study. The test section of B 13 has a length of almost 7 km and 7 light signals control the individual intersections. In addition the route has two lanes in each direction. There is a median barrier separating the opposing highway lanes. Under dry conditions the speed limits on the track are usually restricted to 100 km/h and reduced to 70 km/h near intersections. In the individual test runs the test track was driven either from the North (GPS N 48.303477, E 11.572568) to the South (GPS N 48.245692, E 11.602002) or in the opposite direction. During the experiment, two turning points at the end of the track were used for evaluation of the individual test run (questionnaires). The traffic lights were acting on a coordinated scheme (green wave). Rush hours, which have a highly directional traffic load, were avoided for the experiments. The traffic density was about 500 cars/h in each direction. The study was conducted in May/June 2012. B. Test Environment - Test Vehicle The test vehicle used for the study on the real test field was a BMW X5. For the test series of the experiment, the experimental setup was completed with the following systems: A smartphone of the type Samsung GalaxyAce S5830 (3.5-inch display, resolution of 320 x 480 pixels, Android version 2.3.3) was used during the experimental procedure as mobile driver information system. Comparable to the driving simulator studies already carried out, the nomadic device was mounted on the ventilation slots on the right of the steering wheel on the center console of the BMW X5 (Figure 1).
43
ACHI 2015 : The Eighth International Conference on Advances in Computer-Human Interactions
Figure 2 State of displays of the KOLIBRI-traffic light assistant
Figure 1 Experimental setup in the car
Also an instrument for measuring the reaction time (RT) was installed in the test vehicle, because the experiment applied the TDT method. For the test run, in which a cognitive task (CoTa) had to be performed in addition to driving and the detection task, a microphone was mounted behind the driver’s seat and the speakers were fixed in the armrest in the middle area of the vehicle. Two cameras were mounted in the test vehicle to capture the road scene ahead of and behind the car. A self-developed program allowed the synchronous recording of objective data (TDT, camera pictures and GPS from smartphone). C. KOLIBRI Human Machine Interface (HMI) Initial studies in a static simulator resulted in findings regarding the representation of the human-machine interface (HMI) [1][2][4][[5]. Thus the state of the HMI-display of the traffic light assistant on the mobile device, which was used for the experiments in real traffic, includes the favored approach of the previous simulator-based studies. Figure 2 illustrates the display states of the HMI that are offered to assist the driver. The favored concept of the traffic light assistant on the mobile device includes a recommendation in the form of a speed carpet. The green area represents the speed recommendation that supports the driving behavior for a green wave. The shown car position corresponds to the current vehicle speed. The white vehicle indicates that at the present rate the driver is within this recommendation and his driving behavior is optimal for achieving a green wave (Figure 2-1). The black car indicates the contrary (Figure 2-2). The position of the pointer of the Heuer traffic light (on the right upper corner of the HMI) shows the current status of the next traffic light - green or red signal in form of a clock. When the speed limit is exceeded by more than 10 km/h, the speeding display will appear (Figure 2-3). If the vehicle is outside of the calculation criteria for a speed recommendation, “preparing to stop” (“Vorbereiten auf Halt”) appears, which notifies the driver that the next traffic light will display a red signal on arrival (Figure 2-4). The fifth presentation - a combination of the Heuer traffic light and a countdown - appears at a speed less than 5 km/h at a red traffic signal. This function shows the waiting time until the traffic light changes back to green (Figure 2-5).
Copyright (c) IARIA, 2015.
ISBN: 978-1-61208-382-7
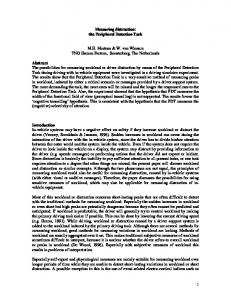
D. Tactile Detection Task (TDT) A tactile detection task is a common method for assessing the mental demand of the driver. All DRTs show sensitivity to cognitive workload [6]. The attentional demands are measured in terms of reaction times and the hit rate [7]. The tactile stimuli are transmitted via a vibration motor. Merat and Jamson [8] propose application of the vibration motor on the left shoulder. The responses are typically given by pressing the button mounted on the left index finger against the steering wheel [7]. Figure 3 illustrates the mounting of the vibrating motor and the button on the test subject.
Figure 3 Attachment of the vibration motor (1) and the button (2) on the test subject
For the TDT realization in this study the test procedure was programmed into an Arduino Uno. The vibration stimulus was triggered every 3-5 seconds with duration of 1 second. The activation was interrupted when a reaction was carried out. This also provided the test subject a feedback to the response. The mental demand can be determined as a result of the reaction times and the hit rate, in which only a response time within 200-2000 milliseconds was counted as a hit [7]. Reactions faster than 200 ms were labeled as cheats. Responses slower than 2000 ms were logged as miss. The metric hit rate is the number of hits divided by the number of stimuli [7][9]. For quality reasons, the hit rate of a data segment should exceed 70% [9]. The TDT-method is usually - as in this study – simultaneously applied to the driving task and additionally other tasks, such as the operation of a vehicle internal system or the processing of a cognitive task (CoTa). Therefore, a combination of up to three tasks (e.g., driving + TDT + CoTa) is performed by the test subjects. The TDT works in these combinations as a measurement task to get the reaction times. The subsequent section deals with the method of the cognitive task. This threefold task condition is compared with a two-fold task
44
ACHI 2015 : The Eighth International Conference on Advances in Computer-Human Interactions
execution, which does not include a secondary task. The difference can be interpreted as a measure of attentional demands; or different experimental conditions with the triple task setting can be compared. E. Cognitive Task (CoTa) The method of performing a cognitive task was used as a reference and control test. Simultaneous to the secondary task, the TDT is again carried out to determine the cognitive demand. Also terms, such as “Sternberg’s memory scanning task” or “Auditory Sternberg task (AUST)” are common in the literature for the here used ”Cognitive Task” [10]. The application Cognitive Task 1.0 from DaimlerChrysler AG (Stefan Mattes, 2005) was used in the experiment. The stimuli in the experiment were presented auditive. The test subject heard a three digit number (e.g., “3 5 2”). This was followed by a pause of 15 seconds for the cognitive processing. After this time interval, a further single digit (e.g., “3”) was announced, after which the subject had to decide whether the check digit was contained in the memorized sequence of digits as quickly as possible. Then, the participant gave a verbal response (“yes” or “no”). F. Test Procedure First, the test subjects explained their consent to study participation. In addition, a demographic questionnaire collected personal data. After that followed both the explanation of the test, which took up to 120 minutes time, and the description of the HMI on the nomadic device. The experiment began with a pre-test study in order to detect the reaction time on the TDT in the stationary vehicle, without any secondary or tertiary task. For this purpose, the vibration motor and the button were attached on the participant with suitable tape. Both vibration motor and button remained on the test person for the further course of the experiment. Afterwards a run on the described road section of the B13 for acclimatization followed while using the traffic light assistant. Four test conditions were then performed in randomized order: A baseline drive (BL), in which only the task of driving had to be fulfilled, and three conditions with execution of the TDT: In addition to a BL+TDT run, there was a TDT-run in conjunction with the cognitive task (CoTa+TDT). In addition, one test run was combined with the KOLIBRItraffic light assistant (KOLIBRI +TDT). In this test run, the smartphone was used to display speed recommendations. All conditions were driven only in one random direction, from North to South (NS), or in the opposite direction (SN). Except the condition BL+TDT, which was carried out in both directions (random first BL+TDT NS or BL+TDT SN) by each participant, to get more data from driving while operating the TDT and to check whether direction has an influence. To sum it up: Pre-test (TDT only, car standing) Driving and IVIS accommodation BL (driving only) KOLIBRI +TDT (driving+IVIS+TDT)
Copyright (c) IARIA, 2015.
ISBN: 978-1-61208-382-7
CoTa+TDT (driving+Cognitive Task+TDT) BL+TDT: o BL+TDT NS (driving +TDT, direction NS) o BL+TDT SN (driving +TDT, direction SN) Post-test (TDT only, car standing) After each of the individual test conditions a (raw) NASA-TLX questionnaire had to be completed by the participants in order to assess the subjective workload during the test run. For the two BL+TDT-conditions the NASATLX [11] was filled in after the first driven direction. After completing the test run with the nomadic device (KOLBRI IVIS), the System Usability Scale (SUS) questionnaire [12] was answered in order to assess the usability of the KOLIBRI-traffic light assistant and the AttrakDiff2 questionnaire was used to measure the quality and attractiveness of the system [13]. To determine correlations, as well as fatigue and learning effects, a study identical to the pre-test study was done at the end (post-test). The subjects were instructed to prioritize the tasks as follows: the driving task should be the highest priority, followed by the tactile detection task. The secondary tasks were in third position. G. Participants The study involved 23 test subjects. With an age range of 24 years for the youngest participant up to 58 years for the oldest subject, the arithmetic mean of the age of the subjects is 30.6 years with a standard deviation of 9.9 years. With 18 men and 5 women more than three-quarters of male subjects participated in the experiment. Two people had a selfreported red/green color weakness, while one person has an eye disease. All test subjects had a normal or corrected to normal visual acuity. 26% of the participants corrected the visual acuity by glasses. All persons were right handed. 48% of people knew the test track and 35% had already participated in one of the KOLIBRI driving simulator experiments. Except for one person, all participants had driven a car with automatic gear before. III.
RESULTS AND DISCUSSION
A. Questionnaires 1) NASA-RTLX (NASA-TLX raw) The average subjective results of the NASA-RTLX shows a value of about 15 (SD: 10) for simple driving on the rural road. To work additionally on the TDT roughly doubles this value to 32 (SD: 13). In the triple task condition of driving, TDT and additionally engaging the CoTa the value is about three-fold: to 49 (SD: 16). The triple task with the KOLIBRI traffic light assistant (NASA-RTLX: 38 SD: 16) is rated in-between 32 and 49. 2) System Usability Scale - SUS The System-Usability-Scale questionnaire used to assess the traffic light assistant in the KOLIBRI test condition resulted in a score of 79 (SD: 16). According to [14], this value can be related in between the adjectives good and excellent.
45
ACHI 2015 : The Eighth International Conference on Advances in Computer-Human Interactions
3) AttrakDiff2 The mean values of hedonic and pragmatic quality are in the “desired” sector, but the confidence rectangle touches “self-oriented”, “neutral” and “task-oriented”. Consequently, there is a tendency (not a full assignment) for “desired”. B. Tactile Detection Task The different experimental conditions resulted in reaction times as shown in Figure 4.
Figure 6 Histogram of reaction times in experimental condition baseline south-north (BL-SN)
Figure 4 TDT reaction times in different experimental conditions
Figure 5 TDT hit rates in different experimental conditions
Associated hit rates for the experimental conditions are shown in Figure 5. T-tests (two sided, paired) detected no statistical difference in the reaction times between normal driving and driving with the KOLIBRI traffic light assistance: BL-SN to KOLIBRI (t: -0.478; df: 22) p= 0.637 BL-NS to KOLIBRI (t: -0.615; df: 22) p = 0.545. In contrast, the experimental condition CoTa prolonged the reaction times significantly. BL-SN to CoTa (t: -6.15; df: 22) p 2000ms). Figure 6 holds the results of experimental condition baseline driving South-North (BL-SN) and shows a typical distribution. During the experimental condition CoTa, the participant answered on average 14 Sternberg sequences (SD 1.7). The answers were to 98 percent correct, which is a clear indication of task engagement.
Copyright (c) IARIA, 2015.
ISBN: 978-1-61208-382-7
For the condition KOLIBRI is no direct measurement of the task engagement available (eye tracking was not involved). From a former experiment in the driving simulator with TDT, the KOLIBRI system and an eye tracker, we know, that even with this combination the KOLIBRI system is very frequently observed [5]. Another study [15] in real traffic with the KOLIBRI system and an eye tracker, revealed an increase in the NASA-RTLX from about 14 to 20 between baseline driving and using the KOLIBRI system. This is similar to the shift from 32 to 38, in the here reported study (with TDT), which still does not indicate a high demanding task. These indications together with the observations from the examiner, led to the assumption that the KOLIBRI system was used by the subjects while driving. C. Tactile Detection Task - Correlations and Repeatability The experimental conditions pre-test and post-test, as well as baseline in direction North-South and South-North (BL-NS, BL-SN) can be seen as test-retest. Thus the correlations are interesting for these conditions. Table 1 holds the correlations of all conditions. TABLE I.
CORRELATION BETWEEN REACTION TIMES IN DIFFERENT EXPERIMENTAL CONDITIONS
Pre BL SN BL NS KOLIBRI
CoTa Post
Pre BL SN BL NS KOLIBRI CoTa Post 1.00 0.61 1.00 0.55 0.71 1.00 0.66 0.70 0.86 1.00 0.66 0.68 0.81 0.80 1.00 0.59 0.65 0.64 0.50 0.75 1.00
The test-retest correlation of pre-test to post-test is r=0.59. The test-retest correlation between the baseline direction North-South to South-North is r=0.71. The time gap between pre-test and post-test is the entire experimental time of about typically two hours. Baseline driving in direction North-South and South-North is carried out directly after one another, but in random order. The pre-and post-test are identical (out of real traffic in a standing car), as in a laboratory. In contrast, the baseline driving can be influenced by uncontrollable circumstances (real traffic, overtaking, stops, etc.). On a larger scale, these microscopic events are
46
ACHI 2015 : The Eighth International Conference on Advances in Computer-Human Interactions
centered out and are not visible (see condition BL+TDT,SN and BL+TDT,NS in Figure 4). The order (SN, NS) was random. In a further analysis the two baseline drivings were correlated, depending on the order of driving (first baseline to second baseline) independent of the direction; the result was again r=0.71. From pre-test to post-test two-thirds (15 participants out of 23) get faster in the reaction times; on average 56ms (SD: 51ms). One-third (8 out of 23 people) gets slower in reacting; on average 32ms (SD: 22ms). The test-retest reliability of pre-test to post-test of r=0.59 is not very high, and perhaps the time gap of about two hours, with car driving and experimental conditions between test and retest, had an influence. For some persons in the form of a fatigue effect, for others in a training effect. The test-retest of driving in North-South and North-South direction of r=0.71 has a higher correlation. This result must be valued against the background of a real road experiment: The participants do not experience exactly the same situations each time while driving. The other real road conditions also have a good correlation of 0.68 to 0.86. The internal consistency (splithalf correlation) in pre-test is r=0.75 and in post-test r=0.83.
only-pretest (car standing) value of 274ms: the data were normalized by 274ms to 0.87, 1.17 and 1.03, to weaken intra-individuality. For the analysis, reactions were only accounted for when the vehicle was moving (faster than 0km/h) and the reaction result was a Hit (no Miss or Cheat). For the resulting N=1955 reaction time values the correlation to the driven speed while reacting revealed no correlation (r= -0.03). The same analysis for the opposite direction North to South revealed r= -0.04 (N=2022) and for the COTA-condition r= -0.04 (N=1975). Figure 8 is a (typical looking) plot of the speed versus the normalized reaction time. On the one hand, it is a positive aspect that the driven speed seems to not influence the reaction times for the TDT. Thus the procedure is more robust against nuisances. On the other hand, it is curious: If the TDT measures mental demand, why does a higher speed seem to not impose more mental demand on the driver? An analysis of absolute speed difference between stimuli (treating accelerations and decelerations the same way) revealed the same result. The correlation between absolute speed difference and reaction time for the South-North-DrivingBaseline (BL SN) is r=0.02. For the CoTa condition it is r=0.03. Therefore, even acceleration or deceleration seems not to influence the reaction time.
Figure 7 Average reaction times in post-test for every single stimulus
In pre-test and post-test, the participants were exposed to 16 stimuli. Figure 7 shows that participants need, even in the post-test (after extensive training on the TDT in different experimental conditions), at least one first “training” stimulus at the start of a condition in order to achieve nearly constant results. NASA-RTLX scores were correlated to the reaction times. The correlation of individual reaction times in baseline driving South-North and North-South to individual NASA-RTLX scores is r=0.14 and r=0.09. In the condition KOLIBRI r=0.34 and in CoTa r=0.33. So, the congruence seems higher in triple task than in double task conditions. D. TDT Dependence on Speed and Acceleration For the following analysis each TDT reaction in the South- North-Driving-Baseline (BL SN) was normalized (divided) by the individual mean reaction in the TDT-onlypretest data. For example, if one test person had data while driving such as 238ms, 320ms and 281ms and a mean TDT-
Copyright (c) IARIA, 2015.
ISBN: 978-1-61208-382-7
Figure 8 Normalized reaction times depending on speed in experimental condition BL SN
The duration of one experiment run was typically around seven minutes (about 100 stimulus onsets). For the experiment in South-North direction (BL SN) the correlation between normalized reaction time and the stimulus count up number (thus, related to experiment time) was r=0.04; for North-South run (BL NS) r=0.08 and for CoTa r= -0.02. It seems like the durations of about seven minutes of an experimental condition is not too long and fatigue effects do not affect the results.
47
ACHI 2015 : The Eighth International Conference on Advances in Computer-Human Interactions
[5]
With the GPS values, we were also able to map the reaction times to road segments of 250m length. The results revealed plausible results (like non-overlapping confidence intervals) for e.g., some long, straight sections with low demand and more demanding sectors. IV.
[6]
CONCLUSION
We could use the TDT in our experiment as an easy to administer and valuable tool. The TDT was able to detect the mental demand of a control task and showed no significant increase in reaction time, while using the carefully designed traffic light assistant.
[7]
[8]
ACKNOWLEDGMENT
[9]
This work was supported by Bayerische Forschungsstiftung (Bavarian Research Foundation). The authors would like to thank the project partners TRANSVER, BMW Group and the Center for Traffic Management of the Bavarian Road Administration.
[10]
REFERENCES [1]
[2]
[3]
[4]
M. Krause and K. Bengler, “Traffic Light Assistant - Driven in a Simulator”, in Proceedings of the 2012 International IEEE Intelligent Vehicles Symposium Workshops: IEEE Intelligent Vehicle Symposioum (IV-2012), Madrid, June 3-7, 2012, pp. 1-6. M. Krause and K. Bengler, “Traffic Light Assistant - Evaluation of Information Presentation”, in Advances in Human Factors and Ergonomics 2012 14 Volume Set: 6 Advances in human aspects of road and rail transportation: Proceedings of the 4th AHFE Conference 21-25 July 2012, G. Salvendy and W. Karwowski, Eds, Boca Raton, FL: CRC Press, Taylor & Francis Group, 2012, pp. 6786–6795 J. Pauwelussen, M. Hoedemaeker, and K. Duivenvoorden, CVIS Cooperative Vehicle-Infrastructure Systems: Deliverable D.DEPN.4.1b Assess user acceptance by small scale driving simulator research, 2008. M. Krause and K. Bengler, “Subjective Ratings in an Ergonomic Engineering Process Using the Example of an In-Vehicle Information System”, in Human-Computer Interaction. Applications and Services: Springer, 2013, pp. 596–605.
Copyright (c) IARIA, 2015.
ISBN: 978-1-61208-382-7
[11]
[12]
[13]
[14]
[15]
M. Krause, A. Rissel, and K. Bengler, “Traffic Light Assistant-What the Users Want”, in ACHI 2014, The Seventh International Conference on Advances in Computer-Human Interactions, 2014, pp. 235–241. A. S. Conti, C. Dlugosch, R. Vilimek, A. Keinath, and K. Bengler, “An assessment of cognitive workload using detection response tasks”, in Advances in Human Factors and Ergonomics Series, Advances in Human Aspects of Road and Rail Transportation: CRC Press, 2012, pp. 735-743. J. Engström, “The Tactile Detection Task as a Method for Assessing Drivers' Cognitive Load”, in Performance metrics for assessing driver distraction: The quest for improved road safety, G. L. Rupp, Ed, Warrendale, Pennsylvania: SAE International, 2010, pp. 90–103. N. Merat and A. H. Jamson, “The Effect of Stimulus Modality on Signal Detection: Implications for Assessing the Safety of In-Vehicle Technology”, Human Factors: The Journal of the Human Factors and Ergonomics Society, vol. 50, no. 1, 2008, pp. 145–158. N. Merat, E. Johansson, J. Engström, E. Chin; F. Nathan and T. Victor, “Specification of a secondary task to be used in Safety Assessment of IVIS”, AIDE Deliverable 2.2.3. http://www.aideeu.org/pdf/sp2_deliv_new/aide_d2_2_3.pdf [retrieved: Jan., 2015]. K. Bengler, S. Mattes, O. Hamm, and M. Hensel, “Lane Change Test: Preliminary Results of a Multi-Laboratory Calibration Study,” in Performance metrics for assessing driver distraction: The quest for improved road safety, G. L. Rupp, Ed, Warrendale, Pennsylvania: SAE International, 2010, pp. 243–253. S. G. Hart, NASA Task Load Index (TLX): Volume 1.0; Paper and Pencil Package. Available: http://ntrs.nasa.gov/archive/nasa/casi.ntrs.nasa.gov/20000021488_200 0015069.pdf [retrieved: Jan., 2015]. J. Brooke, “SUS - A quick and dirty usability scale,” in Usability evaluation in industry, P. W. Jordan, B. Thomas, B. A. Weerdmeester, and I. L. McClelland, Eds, London, Bristol, PA: Taylor & Francis, 1996, pp. 189–194. M. Hassenzahl, M. Burmester, and F. Koller, “AttrakDiff: Ein Fragebogen zur Messung wahrgenommener hedonischer und pragmatischer Qualität,” in vol. 57, Mensch & Computer 2003: Interaktion in Bewegung, G. Szwillus and J. Ziegler, Eds. 1st ed, Stuttgart: Teubner, 2003, pp. 187–196. A. Bangor, P. Kortum, and J. Miller, “Determining What Individual SUS Score Mean: Adding an Adjective Rating Scale,” JUS Journal of Usability Studies, vol. 2009 Volume 4, no. Issue 3, 2009. pp. 114– 123. M. Krause, V. Knott and K. Bengler, “Traffic Light Assistant – Can Take My Eyes Off of You”, Human Factors and Ergonomic Society Europe Chapter Turin 2013.
48