Protein-protein interaction (PPI) networks are a valuable source of information for understand- ... FUSE, another one-to-one global MNA algorithm. FUSE first ...
MPGM: Scalable and Accurate Multiple Network Alignment Ehsan Kazemi1 and Matthias Grossglauser2 1
2
Yale Institute for Network Science, Yale University School of Computer and Communication Sciences, EPFL
Abstract Protein-protein interaction (PPI) network alignment is a canonical operation to transfer biological knowledge among species. The alignment of PPI-networks has many applications, such as the prediction of protein function, detection of conserved network motifs, and the reconstruction of species’ phylogenetic relationships. A good multiple-network alignment (MNA), by considering the data related to several species, provides a deep understanding of biological networks and system-level cellular processes. With the massive amounts of available PPI data and the increasing number of known PPI networks, the problem of MNA is gaining more attention in the systems-biology studies. In this paper, we introduce a new scalable and accurate algorithm, called MPGM, for aligning multiple networks. The MPGM algorithm has two main steps: (i) S EED G EN ERATION and (ii) M ULTIPLE P ERCOLATION . In the first step, to generate an initial set of seed tuples, the S EED G ENERATION algorithm uses only protein sequence similarities. In the second step, to align remaining unmatched nodes, the M ULTIPLE P ERCOLATION algorithm uses network structures and the seed tuples generated from the first step. We show that, with respect to different evaluation criteria, MPGM outperforms the other state-ofthe-art algorithms. In addition, we guarantee the performance of MPGM under certain classes of network models. We introduce a sampling-based stochastic model for generating k correlated networks. We prove that for this model, if a sufficient number of seed tuples are available, the M ULTIPLE P ERCOLATION algorithm correctly aligns almost all the nodes. Our theoretical results are supported by experimental evaluations over synthetic networks.
1
Introduction
Protein-protein interaction (PPI) networks are a valuable source of information for understanding the evolution of protein interactions and system-level cellular processes. Discovering and predicting the interaction patterns, which are related to the functioning of cells, is a fundamental goal in studying the topology of PPI networks. A comparative analysis of PPI networks provides us insight into the evolution of species and can help us to transfer biological knowledge across species. Network alignment is one of the most powerful methods for comparing PPI networks. The main goal of network alignment is to find functionally orthologous proteins and to detect conserved pathways and protein complexes among difference species. Local network-alignment and global network-alignment are the two general classes of network-alignment algorithms. The local network-alignment algorithms search for small but highly conserved sub-networks
1
(e.g., homologous regions of biological pathways or protein complexes) among species by comparing PPI networks locally. The global network-alignment algorithms instead, by maximizing the overall similarity of networks, try to align all (or most of) the proteins to find large subgraphs that are functionally and structurally conserved over all the nodes in the two (or several) networks. The advance of high-throughput methods for detecting protein interactions has made the PPI networks of many organisms available to researchers. With the huge amounts of biological network data and increasing number of known PPI networks, the problem of multiple-network alignment (MNA) is gaining more attention in the systems-biology studies. We believe that a good MNA algorithm leads us to a deeper understanding of biological networks (compared to pairwise-network alignment methods), because they capture the knowledge related to several species. Most of the early works on global PPI-network alignment consider matching only two networks [1, 9, 15, 23, 24, 27, 36, 37]. MNA methods produce alignments consisting of aligned clusters (or tuples) with nodes from several networks. MNA algorithms are classified into two categories of one-to-one and many-to-many algorithms. In the first category, each node from a network can be aligned to at most one node from another network. In the many-to-many category, one or several nodes from a network can be aligned with one or several nodes from another network. Several MNA algorithms were proposed in past few years: NetworkBlast-M, a many-tomany local MNA algorithm, begins the alignment process with a set of high-scoring subnetworks (as seeds). It then expands them in a greedy fashion [14, 35]. Graemlin [7] is a local MNA algorithm that finds alignments by successively performing alignments between pairs of networks, by using information from their phylogenetic relationship. IsoRankN [21] is the first global MNA algorithm that uses both pairwise sequence similarities and network topology, to generate many-to-many alignments. SMETANA [32], another many-to-many global MNA algorithm, tries to find aligned node-clusters by using a semi-Markov random-walk model. This random-walk model is used for computing pairwise similarity scores. CSRW [13], a modified version of SMETANA, uses a context-sensitive random-walk model. NetCoffee [11] uses a triplet approach, similar to T-Coffee [28], to produce a one-to-one global alignment. GEDEVOM [12] is a heuristic one-to-one global MNA algorithm that uses only topological information. To generate multiple alignments, GEDEVO-M minimizes a generalized graph edit distance measure. NH [30] is a many-to-many global MNA heuristic algorithm that uses only network structure. Alkan and Erten [2] designed a many-to-many global heuristic method based on a backbone extraction and merge strategy (BEAMS). The BEAMS algorithm, given k networks, constructs a k-partite pairwise similarity graph. It then builds an alignment, in a greedy manner, by finding a set of disjoint cliques over the k-partite graph. Gligorijevi´c et al. [8] introduced FUSE, another one-to-one global MNA algorithm. FUSE first applies a non-negative matrix tri-factorization method to compute pairwise scores from protein-sequence similarities and network structure. Then it uses an approximate k-partite matching algorithm to produce the final alignment. In this paper, we introduce a new scalable and accurate one-to-one global multiple-network alignment algorithm called MPGM (Multiple Percolation Graph Matching). The MPGM algorithm has two main steps. In the first step, it uses only protein sequence similarities to generate an initial set of seed clusters (or tuples). In the second step, it uses structure of networks and the seed tuples generated from the first step to align remaining unmatched nodes. MPGM is a new member of the general class of percolation graph matching (PGM) algorithms [6, 16, 19, 26, 38]. MPGM is the first algorithm form the powerful class of PGM algorithms that aligns more than two networks. Our MNA algorithm is designed based on ideas inspired by PROPER, a global pairwise-network alignment algorithm [18]. We compare MPGM with several state-of-the-art
2
algorithms. We show that MPGM outperforms the other algorithms, with respect to different evaluation criteria. Also, we provide experimental evidence for the good performance of the S EED G ENERATION algorithm. Finally we study, theoretically and experimentally, the performance of the M ULTIPLE P ERCOLATION algorithm, by using a stochastic graph-sampling model.
2
Algorithms and Methods
The goal of a one-to-one global MNA algorithm is to find an alignment between proteins from k different species (networks), where a protein from one species can be aligned to at most one unique protein from another species, in such a way that (i) the clusters (or tuples) of aligned proteins have similar biological functions, and (ii) the aligned networks are structurally similar, e.g., they share many conserved interactions among different clusters. To be more precise, a one-to-one global alignment π between k networks Gi = (Vi , Ei ), 1 ≤ i ≤ k, is the partition of all (or most of) the nodes V = ∪ki=i Vi into clusters {T1 , T2 , · · · , T|π| }, where each cluster is of size at least two (i.e., they should have nodes from at least two networks), and where each cluster Ti has at most one node from each network. In addition, any two clusters Ti and Tj are disjoint, i.e., Ti ∩ Tj = ∅. In the global MNA problem, to align the proteins from k > 2 species, PPI-networks and protein sequence similarities are used as inputs. Formally, we are given the PPI networks of k different species: the networks are represented by G1 (V1 , E1 ), G2 (V2 , E2 ), �· · · , Gk (Vk , Ek ). Also, the BLAST sequence similarity of the couples of proteins in all the k2 pairs of species is provided as additional side information. The BLAST bits-score similarity for two proteins u and v is represented by BlastBit(u, v). Let S≥` denote the set of all couples with BLAST bit-score similarity of at least `, i.e., S≥` = {[u, v] ∈ ∪1≤i � > 0, assume that n−1 � p ≤ 5 n− 6 −� . For an initial set of seed tuple A, if |Ai,j | > (1 + �)ati,j ,si,j ,r for every 1 ≤ i, j ≤ k, i 6= j, then with high probability the M ULTIPLE P ERCOLATION algorithm percolates and for the final alignment π, we have |πi,j | = nt2i,j ± o(n), where almost all the tuples are completely correctly matched tuples. Theorem 9. For r ≥ 2 and an arbitrarily small but fixed 61 > � > 0, assume that n−1 � 5 p ≤ n− 6 −� . For an initial set of seed tuple A, if for every 1 ≤ i ≤ k there at least c set of Ai,j , 1 ≤ j ≤ k and i 6= j, such that |Ai,j | > (1 + �)ati,j ,si,j ,r , then with high probability the M ULTIPLE P ERCOLATION algorithm percolates and for the final alignment π, we have: • Almost all the tuples T ∈ π are correctly matched tuples. 19
• For a correctly matched tuple T , which contains the node u, if there are at least k − c + 1 networks Gi (Vi , E1 ) such that u ∈ Vi , then T is a completely correctly matched tuple Note that Theorem 8 is the special case of Theorem 9 for c = k − 1. The proofs of Theorems 8 and 9 follow from generalization of the ideas that are used to prove [16, Theorem 1 (Robustness of N OISY S EEDS)]. 5.2.2
Experimental Results: Synthetic Networks
Number of correctly matched tuples
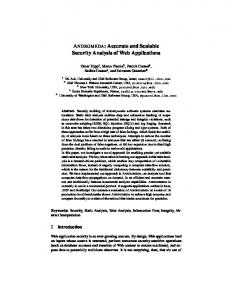
To evaluate the performance of our algorithm by using synthetic networks, we consider k ∈ {3, 4, 5} randomly generated networks from the M ulti(G, t, s, k) model. In these experiments, we assume that a priori a set of seed-tuples A (|A| = a), with nodes from all the k networks, are given and the M ULTIPLE P ERCOLATION algorithm starts the alignment process from these tuples. Figures 13, 14 and 15 show the simulation results for these experiments. We use r = 2 for the M ULTIPLE P ERCOLATION algorithm. For each k ∈ {3, 4, 5}, the total number of correctly aligned tuples is provided. We observe that when there are enough number of tuples in the seed set, M ULTIPLE P ERCOLATION aligns correctly most of the nodes. We also see the sharp phase-transitions predicted in Theorems 8 and 9. According to Equation (2), we need at,s,r = 236 correct seed-tuples to find the complete alignments for the model parameters of n = 105 , p = 20/n, t = 0.9 and s = 0.9. We observe that the phase transitions take place very close to at,s,r = 236. For example, if k = 5, in expectation there are nt5 = 59049 nodes that are present in all the five networks. From Figures 13 (the black curve), it is clear that M ULTIPLE � P ERCOLATION aligns correctly almost all these nodes. Also, in expectation, there are 53 nt3 (1 − t)2 = 7290 nodes that are present in exactly three networks. Again, from Figures 13 (the red curve), we observe that M ULTIPLE P ERCOLATION correctly aligns them . Multiple, |T | = 5
80000
Multiple, |T | = 4 Multiple, |T | = 3
70000
Multiple, |T | = 2 Pairwise
60000 50000 40000 30000 20000 10000 0 180
200
220
240
260
280
300
320
Number of seeds (|A| = a) Figure 13: Multiple network alignment for graphs sampled from M ulti(G, t, s, k) with parameters k = 5, n = 105 , p = 20/n, t = 0.9 and s = 0.9. We set r = 2 for M ULTIPLE P ERCOLA TION .
20
Number of correctly matched tuples
80000
Multiple, |T | = 4 Multiple, |T | = 3
70000
Multiple, |T | = 2 Pairwise
60000 50000 40000 30000 20000 10000 0 180
200
220
240
260
280
300
320
Number of seeds (|A| = a)
Number of correctly matched tuples
Figure 14: Multiple network alignment for graphs sampled from M ulti(G, t, s, k) with parameters k = 4, n = 105 , p = 20/n, t = 0.9 and s = 0.9. We set r = 2 for M ULTIPLE P ERCOLA TION .
Multiple, |T | = 3
80000
Multiple, |T | = 2 Pairwise
70000 60000 50000 40000 30000 20000 10000 0 180
200
220
240
260
280
300
320
Number of seeds (|A| = a) Figure 15: Multiple network alignment for graphs sampled from M ulti(G, t, s, k) with parameters k = 3, n = 105 , p = 20/n, t = 0.9 and s = 0.9. We set r = 2 for M ULTIPLE P ERCOLA TION .
21
6
Conclusion
In this paper, we introduced a new one-to-one global multiple-network alignment algorithm, called MPGM. Our algorithm has two main steps. In the first step (S EED G ENERATION), it uses protein sequence-similarities to generate an initial seed-set of tuples. In the second step, MPGM applies a percolation-based graph-matching algorithm (called M ULTIPLE P ERCOLA TION ) to align the remaining unmatched proteins, by using only the structure of networks and the seed tuples from the first step. We have compared MPGM with several state-of-the-art methods. We observe that MPGM outperforms the other algorithms with respect to several measures. More specifically, MPGM finds many consistent clusters with high d-coverage (mainly for d = k). Also, it outputs alignments with high structural similarity between networks, i.e., many interactions are conserved among aligned clusters. We have studied the transitivity of sequence similarities for real proteins and have found that it is reasonable to assume a pseudotransitive relationship among them. We argue, based on this pseudo-transitivity property, that theS EED G ENERATION heuristic is able to find seed tuples with high functional similarities. In addition, we present a random-sampling model to generate k correlated networks. By using this model, we prove conditions under which M ULTIPLE P ERCOLATION aligns (almost) all the nodes correctly, if initially enough seed tuples are provided. Acknowledgements. The work of Ehsan Kazemi was supported by Swiss National Science Foundation (Early Postdoc.Mobility) under grant number 168574.
References [1] Ahmet Emre Aladag and Cesim Erten. Spinal: scalable protein interaction network alignment. Bioinformatics, 29(7):917–924, 2013. [2] Ferhat Alkan and Cesim Erten. Beams: backbone extraction and merge strategy for the global many-to-many alignment of multiple ppi networks. Bioinformatics, 30(4):531–539, 2014. [3] Stephen F Altschul, Warren Gish, Webb Miller, Eugene W Myers, and David J Lipman. Basic local alignment search tool. Journal of Molecular Biology, 215(3):403–410, 1990. [4] Rolf Apweiler, Amos Bairoch, Cathy H Wu, Brigitte Barker, Winona Cand Boeckmann, Serenella Ferro, Elisabeth Gasteiger, Hongzhan Huang, Rodrigo Lopez, Michele Magrane, et al. UniProt: the universal protein knowledgebase. Nucleic Acids Research, 32(suppl 1):D115–D119, 2004. [5] Carla F. Chiasserini, Michele Garetto, and Emilio Leonardi. De-anonymizing scale-free social networks by percolation graph matching. In Proc. of IEEE INFOCOM 2015, Hong Kong, April 2015. [6] Carla F. Chiasserini, Michele Garetto, and Emilio Leonardi. Impact of Clustering on the Performance of Network De-anonymization. In Proc. of ACM COSN 2015, Palo Alto, CA, USA, November 2015. [7] Jason Flannick, Antal Novak, Balaji S Srinivasan, Harley H McAdams, and Serafim Batzoglou. Graemlin: general and robust alignment of multiple large interaction networks. Genome research, 16(9):1169–1181, 2006.
22
[8] Vladimir Gligorijevi´c, No¨el Malod-Dognin, and Nataˇsa Prˇzulj. Fuse: multiple network alignment via data fusion. Bioinformatics, 2015. [9] Somaye Hashemifar and Jinbo Xu. HubAlign: an accurate and efficient method for global alignment of protein–protein interaction networks. Bioinformatics, 30(17):i438– i444, 2014. [10] Henning Hermjakob, Luisa Montecchi-Palazzi, Chris Lewington, Sugath Mudali, Samuel Kerrien, Sandra Orchard, Martin Vingron, Bernd Roechert, Peter Roepstorff, Alfonso Valencia, et al. IntAct: an open source molecular interaction database. Nucleic Acids Research, 32(suppl 1):D452–D455, 2004. [11] Jialu Hu, Birte Kehr, and Knut Reinert. Netcoffee: a fast and accurate global alignment approach to identify functionally conserved proteins in multiple networks. Bioinformatics, page btt715, 2013. [12] Rashid Ibragimov, Maximilian Malek, Jan Baumbach, and Jiong Guo. Multiple graph edit distance: simultaneous topological alignment of multiple protein-protein interaction networks with an evolutionary algorithm. In Proceedings of the 2014 Annual Conference on Genetic and Evolutionary Computation. ACM, 2014. [13] Hyundoo Jeong and Byung-Jun Yoon. Accurate multiple network alignment through context-sensitive random walk. BMC systems biology, 9(Suppl 1):S7, 2015. [14] Maxim Kalaev, Mike Smoot, Trey Ideker, and Roded Sharan. Networkblast: comparative analysis of protein networks. Bioinformatics, 24(4), 2008. [15] Ehsan Kazemi and Matthias Grossglauser. On the Structure and Efficient Computation of IsoRank Node Similarities. CoRR, abs/1602.00668, 2016. [16] Ehsan Kazemi, S. Hamed Hassani, and Matthias Grossglauser. Growing a Graph Matching from a Handful of Seeds. Proc. of the VLDB Endowment, 8(10):1010–1021, 2015. [17] Ehsan Kazemi, Lyudmila Yartseva, and Matthias Grossglauser. When Can Two Unlabeled Networks Be Aligned Under Partial Overlap? In Allerton, Monticello, IL, USA, October 2015. [18] Ehsan Kazemi, Hamed Hassani, Matthias Grossglauser, and Hassan Pezeshgi Modarres. PROPER: global protein interaction network alignment through percolation matching. BMC Bioinformatics, 17(1):527, 2016. [19] Nitish Korula and Silvio Lattanzi. An efficient reconciliation algorithm for social networks. Proc. of the VLDB Endowment, 7(5):377–388, 2014. [20] Oleksii Kuchaiev, Tijana Milenkovi´c, Vesna Memiˇsevi´c, Wayne Hayes, and Nataˇsa Prˇzulj. Topological network alignment uncovers biological function and phylogeny. Journal of the Royal Society Interface, pages 1341–1354, 2010. [21] Chung-Shou Liao, Kanghao Lu, Michael Baym, Rohit Singh, and Bonnie Berger. IsoRankN: spectral methods for global alignment of multiple protein networks. Bioinformatics, 25(12):i253–i258, 2009. [22] Phillip W. Lord, Robert D. Stevens, Andy Brass, and Carole A. Goble. Investigating semantic similarity measures across the gene ontology: the relationship between sequence and annotation. Bioinformatics, 19(10):1275–1283, 2003. 23
[23] No¨el Malod-Dognin and Nataˇsa Prˇzulj. L-GRAAL: Lagrangian graphlet-based network aligner. Bioinformatics, 31(13):2182–2189, 2015. [24] Lei Meng, Aaron Striegel, and Tijana Milenkovi´c. Local versus global biological network alignment. Bioinformatics, 2016. [25] Meeta Mistry and Paul Pavlidis. Gene ontology term overlap as a measure of gene functional similarity. BMC bioinformatics, 9(1):327, 2008. [26] Arvind Narayanan and Vitaly Shmatikov. De-anonymizing social networks. In Proc. of IEEE Symposium on Security and Privacy 2009, Oakland, CA, USA, May 2009. [27] Behnam Neyshabur, Ahmadreza Khadem, Somaye Hashemifar, and Seyed Shahriar Arab. NETAL: a new graph-based method for global alignment of protein–protein interaction networks. Bioinformatics, 29(13):1654–1662, 2013. [28] C´edric Notredame, Desmond G Higgins, and Jaap Heringa. T-coffee: A novel method for fast and accurate multiple sequence alignment. Journal of molecular biology, 302(1): 205–217, 2000. [29] Rob Patro and Carl Kingsford. Global network alignment using multiscale spectral signatures. Bioinformatics, 28(23):3105–3114, 2012. [30] Alex Radu and Michael Charleston. Node handprinting: a scalable and accurate algorithm for aligning multiple biological networks. Journal of Computational Biology, 22(7):687– 697, 2015. [31] Philip Resnik et al. Semantic similarity in a taxonomy: An information-based measure and its application to problems of ambiguity in natural language. J. Artif. Intell. Res.(JAIR), 11:95–130, 1999. [32] Sayed Mohammad Ebrahim Sahraeian and Byung-Jun Yoon. SMETANA: accurate and scalable algorithm for probabilistic alignment of large-scale biological networks. PLoS One, 8(7):e67995, 2013. [33] Vikram Saraph and Tijana Milenkovi´c. Magna: Maximizing accuracy in global network alignment. Bioinformatics, 30(20):2931–2940, 2014. [34] Andreas Schlicker and Mario Albrecht. Funsimmat: a comprehensive functional similarity database. Nucleic acids research, 36(suppl 1):D434–D439, 2008. [35] Roded Sharan, Silpa Suthram, Ryan M. Kelley, Tanja Kuhn, Scott McCuine, Peter Uetz, Taylor Sittler, Richard M. Karp, and Trey Ideker. Conserved patterns of protein interaction in multiple species. Proceedings of the National Academy of Sciences of the United States of America, 102(6):1974–1979, 2005. [36] Rohit Singh, Jinbo Xu, and Bonnie Berger. Pairwise Global Alignment of Protein Interaction Networks by Matching Neighborhood Topology. In Proc. of Research in Computational Molecular Biology 2007, San Francisco, CA, USA, April 2007. [37] Vipin Vijayan, Vikram Saraph, and Tijana Milenkovi´c. MAGNA++: Maximizing Accuracy in Global Network Alignment via both node and edge conservation. Bioinformatics, 31(14):2409–2411, 2015. [38] Lyudmila Yartseva and Matthias Grossglauser. On the performance of percolation graph matching. In Proc. of ACM COSN 2013, Boston, MA, USA, October 2013. 24
A
Table of Notations Table 3:
Gi (Vi , Ei ) (u, v) Ni (u) BlastBit(u, v) [u, v] T A π |T | V (T ) V (u) S≥` A(u) ETi ,Tj V (ETi ,Tj ) C(π)
B
A network with vertex set Vi and edge set Ei . An edge between nodes u and v. The set of neighbors of node u in Gi . BLAST bit-score similarity of two proteins u and v A couple of proteins u and v. A cluster or tuple. Initial seed-tuples. The final alignment. Number of nodes in cluster (tuple) T . The set of networks such that have a node in the tuple T . The network Vi such that u ∈ Vi . The set of all couples with BLAST bit-score similarities at least `. Returns the tuple T ∈ A such that u ∈ T . If there is no such tuple, we define A(u) = ∅. The set of all the interactions between nodes from the two tuples Ti and Tj , i.e., ETi ,Tj = {e = (u, v)|u ∈ Ti , v ∈ Tj }. The set of networks such that have an edge in ETi ,Tj . The set of consistent clusters in an alignment π.
Detailed Comparisons
Tables 4, 5, 6 and 7 provide detailed comparisons for clusters with different coverages. Table 4 compares algorithms over clusters with nodes from five networks. The second step of MPGM (i.e., M ULTIPLE P ERCOLATION) uses PPI networks to generate 3076 clusters out of initial seed-tuples. We observe that MPGM (for ` = 40) finds an alignment with the maximum d-coverage, #CC5 , #CP5 and SSp (π). In addition, the first step of MPGM (i.e., S EED G EN ERATION ) has the best performance on Spec5 , SSp (π) and MNE. This was expected, because M ULTIPLE P ERCOLATION uses only network structure, a less reliable source of information for functional similarity in comparison to sequence similarities, to align new nodes. From this table, it is clear that MPGM outperforms the other algorithms with respect to all the measures.
25
26
d-coverage #CC4 #CP4 Spec4 SSp (π) SSp (π) MNE
d-coverage #CC5 #CP5 Spec5 SSp (π) SSp (π) MNE 2233 449 2245 0.21 7078 3.22 3.014
867 187 1082 0.22 2788 3.239 3.162
1132 209 1279 0.187 3315 2.944 3.312
1104 200 1234 0.185 3097 2.818 3.071
For MPGM we set r = 1. F B S C
Table 5: Comparison results for clusters of size four. For MPGM we set r = 1. SeedGeneration (`) MPGM (`) F B S C 40 80 150 40 80 150 1933 1591 1133 2719 2520 2321 3527 1663 1547 1670 580 532 392 631 534 435 834 510 414 474 2320 2128 1568 2524 2136 1740 3336 2398 1903 2272 0.339 0.366 0.369 0.277 0.256 0.224 0.299 0.329 0.291 0.306 8309 7335 5465 10449 9087 7902 12829 7043 5863 6522 4.591 4.814 4.982 4.213 3.984 3.726 4.095 4.34 3.922 4.044 2.565 2.648 2.717 2.571 2.621 2.668 2.597 2.733 2.664 2.73
Table 4: Comparison results for clusters of size five. SeedGeneration (`) MPGM (`) 40 80 150 40 80 150 1366 880 568 3076 3062 3068 386 248 159 707 647 541 1930 1240 795 3535 3235 2705 0.291 0.286 0.284 0.244 0.222 0.184 5294 3519 2251 10659 10002 9285 3.928 4.018 3.993 3.55 3.326 3.074 2.927 2.943 3.049 3.008 3.071 3.144
1475 118 560 0.092 2953 2.156 3.168
I
379 23 126 0.063 554 1.482 3.469
I
27
d-coverage #CC2 #CP2 Spec2 SSp (π) SSp (π) MNE
d-coverage #CC3 #CP3 Spec3 SSp (π) SSp (π) MNE
Table 7: Comparison results for clusters of size two. SeedGeneration (`) MPGM (`) 40 80 150 40 80 150 3510 4013 4411 3402 3675 3825 859 1088 1357 579 645 703 1718 2176 2714 1158 1290 1406 0.611 0.619 0.646 0.527 0.519 0.529 15049 18777 22849 10664 12032 12918 8.157 8.286 8.551 7.025 7.153 7.161 1.946 1.944 1.968 2.01 2.03 2.002
3118 495 990 0.462 9035 6.118 2.163
3265 900 2309 0.557 14749 7.375 1.987
2820 702 1644 0.558 12003 7.378 1.951
For MPGM we set r = 1. F B S
2988 905 2073 0.618 14898 8.124 1.987
C
Table 6: Comparison results for clusters of size three. For MPGM we set r = 1. SeedGeneration (`) MPGM (`) F B S C 40 80 150 40 80 150 2342 2227 1842 2502 2522 2523 2180 2320 1951 1981 775 794 692 603 598 545 472 801 617 662 2325 2382 2076 1809 1794 1635 1416 2886 2132 2352 0.462 0.486 0.5 0.384 0.382 0.349 0.35 0.437 0.417 0.436 11509 11672 9988 10040 10070 9430 8197 11509 9064 9526 6.007 6.319 6.394 5.263 5.348 4.995 4.956 5.706 5.441 5.587 2.239 2.29 2.372 2.312 2.336 2.35 2.348 2.276 2.31 2.264
5620 541 1224 0.231 12853 4.21 2.464
I
2869 308 1027 0.153 7463 3.224 2.83
I
C
GO Annotation: Statistics
In this appendix, we look at a few statistics regarding GO annotations. GO annotations comprises three orthogonal taxonomies for a gene product: molecular-function, biological-process and cellular-component. This information is captured in three different directed acyclic graphs (DAGs). The roots (the most general annotations for each category) of these DAGs are: • GO:0003674 for molecular function annotations • GO:0008150 for biological process annotations • GO:0005575 for cellular component annotations For information content of each GO term, we use the SWISS-PROT-Human proteins, and counted the number of times each concept occurs. Information content is calculated based on the following information: • Number of GO terms in the dataset is 26831. • Number of annotated proteins in the dataset is 38264085. • Number of experimental GO terms in the dataset is 24017. • Number of experimentally annotated proteins in the dataset is 102499. Table 8 provides information related to different categories of GO annotations for the five networks we used in our experiments. Table 8: Statistics for experimental GO annotations. GO type #GO #proteins Avg. #GO All 20738 28896 49.47 Biological process 14876 20723 48.21 Molecular function 3938 21670 7.84 Cellular component 1924 21099 12.35
Next we report the number of experimentally annotated proteins (at the cut-off level 5 of DAGs) in each network: • C. elegans: 1544 out of 4950 proteins (31.2 %). • D. melanogaster: 4653 out of 8532 proteins (54.5 %). • H. sapiens: 10929 out of 19141 proteins (57.1 %). • M. musculus: 7150 out of 10765 proteins (66.4 %). • S. cerevisiae: 4819 out of 6283 proteins (76.7 %). The probabilities of sharing at least one GO term (at the cut-off level 5) for clusters of size two to five, when all the proteins of a cluster are annotated, are as follows: • clusters of size 2: 0.215 • clusters of size 3: 0.042 28
• clusters of size 4: 0.009 • clusters of size 5: 0.002 Also, the probabilities of sharing at least one GO term (at the cut-off level 5) for clusters of size two to five, when at least two proteins from each cluster are annotated, are as follows: • clusters of size 2: 0.215 • clusters of size 3: 0.167 • clusters of size 4: 0.120 • clusters of size 5: 0.081 In Figure 16, the total number of annotated proteins, at different cut-off levels, are shown. Also, the number of GO terms and the average number of GO terms for each annotated protein, at different cut-off levels, are shown in Figures 17 and 18, receptively.
Number of annotated proteins
30000 All Biological process Molecular function Cellular component
25000
20000
15000
10000
5000
0
3
4
5
6
7
8
Cut-off level Figure 16: Number of annotated proteins for different cut-off levels
29
9
Number of different GO terms
6000 All Biological process Molecular function Cellular component
5000
4000
3000
2000
1000
0
3
4
5
6
7
8
9
Cut-off level
Average number of GO terms for each protein
Figure 17: Number of different GO terms for different cut-off levels
12 All Biological process Molecular function Cellular component
10
8
6
4
2
0
3
4
5
6
7
8
9
Cut-off level Figure 18: Average number of GO terms for each annotated protein for different cut-off levels
30