MS2DB: An Algorithmic Approach to Determine Disulfide Linkage Patterns in Proteins by Utilizing Tandem Mass Spectrometric Data
1
Timothy Lee1, Rahul Singh1, Ten-Yang Yen2, and Bruce Macher2 Department of Computer Science, 2Department of Chemistry and Biochemistry San Francisco State University
[email protected],
[email protected],
[email protected],
[email protected] Abstract
Determining the number and location of disulfide bonds within a protein provide valuable insight into the protein’s three-dimensional structure. Purely computational methods that predict the bonded cysteine pairings given a protein’s primary structure have limitations in both prediction correctness and the number of bonds that can be predicted. Our approach utilizes tandem mass spectrometric (MS/MS) experimental procedures that produce spectra of protein fragments joined by a disulfide bond. This allows the limitations in correctness and scaling to be overcome. The algorithmic problem then becomes how to match a theoretical mass space of all possible bonded fragments against the MS/MS data. In our algorithm, which we call the Indexed approach, the regions of the mass space that contain masses comparable to the MS/MS spectrum masses are located before the match is determined. We have developed a software package, MS2DB, which implements this approach. A performance study shows that the Indexed approach determines disulfide bond linkage patterns both correctly and efficiently.
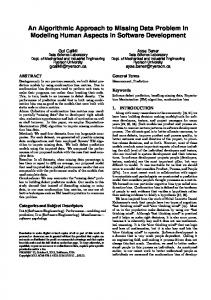
1. Introduction Cysteine residues have a property unique among the 20 naturally occurring amino acids, in that they can pair to form disulfide bonds in proteins. As depicted in Figure 1, this reaction occurs when the sulfhydryl (-SH) groups of cysteine residues become oxidized as they come into proximity. As a result, residues that may be far removed from one another in the primary structure of the protein are physically cross-linked. Because disulfide bonds impose length and angle constraints on the backbone of a protein, knowledge of the location of these bonds significantly constrains the possible conformational space Which needs to be considered when determining how the protein folds into its tertiary structure. The tertiary structure of a protein has an important effect on its function. For
example, in [5], it is shown that the disulfide bond structures of ST8Sia IV are necessary for its polysialyation activity.
Figure 1. The formation of disulfide bonds
2. Related Work Various computational methods have been developed to predict disulfide bonds based on the location of the cysteine residues in the protein’s primary structure. The computational formulation of the generic prediction algorithm was made by Vullo and Frasconi in [2]. Their analysis concluded that a prediction algorithm must have a computational time complexity of θ ( n( n / 2) ) where n is the number of cysteines in the protein. This limits the application of such an algorithm to proteins with only a few disulfide bonds. Current connectivity prediction approaches use stochastic global optimization [7], combinatorial optimization [6] and machine learning techniques [2]. The prediction accuracies of these methods are limited to ~50%. In general, these prediction algorithms rely on the principle of homology; assuming homologous proteins (in either a global or local sense) have similar disulfide bridge structures. However, there are cases in which homologous proteins are known to have different disulfide bond structures, the polysialytransferases described in [5] being one example. Pure predictive methods must ultimately be complemented by an experimental methodology. The approach used in this paper is to use the mass n
spectrometric methods described in the next section to detect the locations of disulfide bonded peptides and then apply a computational algorithm to confirm their presence. Unlike pure computational prediction techniques, our approach is distinguished by the following advantages: 1. Our experimental method is not limit by the number of cysteines present in the protein. 2. No requirement of homology is needed to determine the disulfide bonding as our approach uses actual data. 3. The algorithms used to confirm the presence of disulfide bonds have at worst a quadratic time complexity in the most common case of one cysteine per peptide.
3. Disulfide bond identification procedure Our approach to disulfide bond identification involves two steps. The first is to make an initial identification of bonded peptides as peaks in the MS spectra, and the second is to confirm this identification using the MS/MS spectra of these peaks. The methods and applications of mass spectroscopy are reviewed in [4]. The experimental procedure we used to obtain the MS spectra and MS/MS spectra for a protein is described in [3]. The initial identification step is usually straightforward. First, an MS mass table of possible disulfide pairs is generated. This table is calculated by summing the mass of each peptide, minus 2 Daltons (since two S-H become an S-S bond) for each peptide pair. When a match for one of the theoretically calculated masses of disulfide bonded peptide pairs is found, an initial identification of the disulfide bond is made. The remainder of this paper focuses on the problem of using the corresponding MS/MS spectrum to confirm this identification.
4. Computational formulation Let A denote the set of twenty amino acid residues, each with mass m(a), a ∈ A. Each amino acid is represented by a unique letter. For example, the letter for cysteine is C. A peptide P = {pi } is a string of amino acids with mass m(P) = ∑m(pi). A peptide fragment Frs ⊂ P is a substring of P with mass m(Frs) = ∑r≤i≤s m(pi). A disulfide bonded fragment F12 is a pair of peptide fragments F1 and F2, with mass m(F12) = m(F1) + m(F2) - 2. For there to be a disulfide bond between F1 and F2, each fragment must contain at least one cysteine.
The disulfide bond mass space D12 for two cysteinecontaining peptides P1 and P2 is the set of every disulfide bonded fragment mass that can be obtained from these two peptides. A disulfide bond spectrum S12 is the set of MS/MS fragment masses. The match between D12 and S12 is the intersection of these two sets, D12 ∩ S12 . The MS2DB identification problem can then be formulated as follows: given a mass space D12 and a spectrum S12, the disulfide bond is identified if their match is greater than a threshold value t.
5. Exploring the problem structure To provide the motivation for the approach proposed in this paper, we first explore the inherent characteristics of the problem. To do so, we utilize an enumerative strategy that systematically constructs the entire mass space corresponding to all possible disulfide linkage patterns for a specific bonded pair of peptides. This space is then searched using an MS/MS spectrum to confirm the identification of the disulfide bond. While this strategy can accurately determine disulfide linkage patterns, it is ultimately handicapped by its computational complexity. However, this Enumerated approach identifies attributes of the problem that are utilized to develop a significantly more efficient indexing-based approach that only generates and explores regions of the mass-space that are most relevant for a specific mass spectrum. This Indexed approach constitutes the key contribution of our research. In the following, we introduce the reader to the problem structure by systematically describing the Enumerated strategy to construct the mass space. This is followed by a description of the proposed index-based strategy.
5.1. Basic Model for creating disulfide bond mass space We wish to compute all the possible masses for two peptide fragments that linked by a disulfide bond. For this analysis, we assume that the disulfide bond remains intact when the peptides undergo collisioninduced dissociation, and that each fragment is either a b- or y-ion. Further, we assume that each peptide has only one cysteine, and thus the bond can only form in one way between the two peptide fragments. A way to relax this assumption is described at the end of this section. We begin with a simple example. Let the amino acid sequence of the first peptide p1 = NVNCTK, and the second peptide p2 = AIQCLDEH. Table 1 shows all of the possible y- and b-ions that contain cysteine, as well as the mass of each ion. For y ions, another 18
Daltons are added to the sum of the residue masses to account for the carboxylic acid group. The most convenient way to compute and display the disulfide bonded pair mass space is to generate four tables in which each row represents the mass of an ion of the first peptide and each column represents the mass of an ion of the second peptide. Then, each entry in this MS/MS mass table (subsequently referred to as mass table) is the sum of its row and column, minus two. For this example, we create four mass tables, the first showing all the combinations of b1 with b2, the second b1 with y2, the third y1 with b2, and the fourth y1 with y2. Table 2 shows the possible masses for the b1+y2 combination of a disulfide bonded peptide pair.
Peptide 1
Ion type y
b
2
y
b
Sequence
Mass (Da)
CTK NCTK VNCTK NVNCTK NVNC NVNCT NVNCTK CLDEH QCLDEH IQCLDEH AIQCLDEH AIQC AIQCL AIQCLD AIQCLDE AIQCLDEH
351 446 564 678 431 532 660 501 639 752 813 316 429 544 673 810
5.2. Algorithm for computation of mass space
Table 1. Example of Enumerated approach
Let the first peptide p1 consist of m amino acid residues, and the second peptide p2 consist of n amino acid residues. The first step is to identify the set of all possible b- and y-ions that can be generated by fragmenting each peptide containing a cysteine. If the cysteine occurs at location i within the peptide (counting from the N-terminal), then there will be mi+1 b-ions and i y-ions. In the second step, the mass of each ion is computed as described in the example in the previous subsection. In the third step, four Cartesian products (matrices) are formed for each of the combinations y1+b2, y1+y2, b1+y2, and b1+b2, and each element is computed, as described earlier. Clearly, the total number of elements to compute is (n+1)(m+1). If the ions used to form the mass tables are arranged in order of increasing mass, the matrices will be sorted as in Table 2.
Thus the time complexity of the algorithm as a whole is O(1+ n + n2) = O(n2). Although this complexity is a vast improvement over the purely predictive approaches, it is inadequate for large peptides.
b1+y2-2 431 NVNC 532 NVNCT 660 NVNCTK
501 CLDEH
639 QCLDEH
752 IQCLDEH
813 AIQCLDEH
930
1068
1181
1242
1031
1169
1282
1343
1159
1297
1410
1471
Table 2. Example mass table
5.3. Time complexity of Basic Model The computational complexity of step 1 (i.e., finding the number of b and y ions in each peptide) is O(1) since the identification of the individual ion can be left until step 2. In step 2, the mass of an ion can be obtained by adding the mass of the next amino acid residue to the mass of the ion in the row or column previous to it. Thus, for a peptide of length O(n), the complexity of this step is O(n). If both peptides are of length O(n) then the complexity of step 3 is O(n2).
5.4. Extending the Basic Model to Multiple Cysteine occurrences Now, we consider the case of peptides that contain more than one cysteine. First, we consider the case in which there are no intramolecular bonded cysteines, (i.e., no disulfide bonds form within a single peptide). Thus, only one cysteine forms a disulfide bond with another peptide. Then, a peptide that has p cysteines can be considered to be logically p different peptides. It follows that the number of logical peptide pairs is p(p-1)/2. Thus, if the length of each candidate peptide is approximately n, then the overall complexity of this problem is O(p2*n2). For the case in which there are intramolecular bonded cysteines, first consider a peptide with two of its cysteines forming a disulfide bond. The mass of this intramolecular bonded peptide is two Daltons less than the same peptide with no disulfide bond, and should be included as part of the total mass space. A simple calculation shows that in the general case of a peptide with c cysteines, there can be up to c/2 disulfide bonds formed, leading to c/2 different masses for the peptide. In this case, there can be many mass degeneracies (i.e., combinations of bonds that result in the same mass). For example, if a peptide has cysteines c1, c2, and c3, bonds can form between c1c2, c1-c3, and c2-c3. Thus, it may not be possible to determine the actual location of these bonds by MS/MS methods alone. Either another round of
collision-induced disassociation is needed to reduce the number of cysteines in any one fragment, or one of the bond prediction methods discussed in Section I must be employed. It is more difficult to derive a general computational formulation to apply to the analysis of peptides with multiple cysteines that form disulfide bonds. Here we briefly outline the factors to consider. It follows from the two peptide case that the mass space is an n-dimensional Cartesian product for n peptides. However, many ions will not contain all of the peptides’ cysteines, reducing the size of the disulfide bond mass space. Still, it can be shown that the complexity of the d-disulfide bond problem is bounded by Ω (pd*nd), where again we assume |p1| ≈ |p2| = p. As in the intramolecular disulfide case, mass degeneracies are likely to exist, making the unambiguous determination of the location of the disulfide bonds difficult by MS/MS methods alone.
6. Indexed approach 6.1. Motivation One approach to improving the performance of the process of making a correlation between an ion fragment in an MS/MS spectrum and values in a theoretical mass table is to generate only those portions of the mass tables that are likely to match the MS/MS spectra. By computing the minimum and maximum values of each mass table, we can first filter out those tables that lie outside of the range of the masses within the MS/MS spectrum. Also, because the dynamic range of amino acid residue masses is relatively small (about 3.3:1 in the extreme case of W:G), the increase in mass is approximately linear as the values are read “diagonally” from the lowest to the highest value. Thus, given an MS/MS fragment ion mass, it is possible to make an initial estimate of the location of the diagonal band of theoretical table masses that are most likely to match this fragment ion mass. In the example depicted in Table 2, one band would consist of the masses 1297, 1282, and 1242 Da. By using the MS/MS spectrum mass as an index, only these three masses would need to be computed and compared, instead of computing all 12 elements of this mass table.
6.2. Algorithm Let peptides p1 and p2 consist of m and n amino acid residues, respectively. The first step is to compute the lowest and highest masses mmin and mmax in the mass table. The former is the first row and first
column of the mass table, and the latter is its last row and last column. Let s be an MS/MS fragment ion mass peak value. If s < mmin or s > mmax, the algorithm returns no value. Otherwise, the second step is to compute the average amino acid residue mass m = (m ( p1) + m( p 2)) /( n + m) . This is the approximate mass difference between an element and the (up to) four elements that are a “step” away from it. A step is defined to be the movement of an index that points from an element to a neighboring element, either vertically or horizontally, in a mass table. Thus, the estimate of the number of steps used to index into the table to locate the band for a particular mass peak is nsteps = s / m . While any continuous path of steps from mmin to mmax can be used to locate the band, it is simplest to step along the perimeter of the mass table. In this algorithm, we start by stepping “down” along the first column, and then “across” along the last row. Since this initial estimate may not index into the actual location of the band, an algorithm to get there from the location of the estimate must be employed. For relatively short peptides of under a hundred amino acid residues (much longer than usually encountered in tryptic digests), the algorithm can be to simply generate neighboring mass table elements along the path used to index into the table until the band is reached. The location of the band is identified as the index of the element that has the mass closest to s. Because the amount of experimental variation a spectrum mass is allowed to have to determine the match, denoted the mass window mw, is much less than
m ≈ 100 Da, there is little ambiguity in making this identification. Once the location of the band is identified, the remaining elements of the band are generated and compared to s. The second element will be found either directly above, or above and to the right (row=row-1, column=column+k, where k depends on the relative sizes of the peptides) of the first element. 6.3. Illustrative example Consider the example used in the Enumerated approach. Also suppose that s = 1281 Da, and mw = 2.0 Da. We want to find the match of s with the b1+y2 table (Table 2). Since mmin < s < mmax, there is a band in this table. The average amino acid residue mass
m = (660 + 813)/(6 + 8) = 105 Da. The nsteps = 1281/105 ≈12. We begin to count from nine at Table 2’s first row and first column because this element is the mass for nine amino acid residues. Counting down the first column and then across the last row until twelve is reached, we arrive at the band. This is
confirmed by comparing s to the mass table elements that are adjacent to the indexed element on the same row. Because 6 ≈ 8, we set k = 1. Eight mass table elements are generated (the three elements in the band, plus their adjacent elements in each row), and the element at b1 = NVNCT and y2 = IQCLDEH is identified as a match.
outputs a list of the mass table elements (in the same notation as [1]) that constitute the match. y9Y
y10Y
y11Y
y12Y
y13Y
y14Y
y15Y
y16Y
y17Y
2466.8 2581.9 2696.9 2754.0 2825.1 2938.2 3067.4 3180.5 3317.7 2581.9 2696.9 2812.0 2869.1 2940.2 3053.3 3182.4 3295.6 3432.7 2681.0 2796.1 2911.2 2968.2 3039.3 3152.5 3281.6 3394.7 3531.9 2796.1 2911.2 3026.3 3083.3 3154.4 3267.5 3396.7 3509.8 3647.0
6.4. Time complexity The algorithm described by the Indexed approach has a worst case time complexity of O(n + m) to locate the band. However, because the Indexed approach usually indexes into the mass table just a few elements away from the band, the time complexity can be estimated by a constant. Because the band is in general a diagonal along the mass table, generating the band This elements has a complexity of O( nm ). compares favorably with the O(n2) complexity of the Enumerated approach.
7. Implementation We have developed software that implements both the Enumerated and Indexed approaches, with all of the assumptions of the Basic Model in place. The software was written in the Java programming language. The program that implements the Enumerated approach (enumID) accepts the input of two peptides in the form of their amino acid sequences, and outputs a file that consists of five components. All mass values are computed for singly charged ions. The first four columns display the computed masses of all of the possible b1, y1, b2, and y2 ions, respectively. Each of the remaining four components corresponds to the mass table for b1+b2, b1+y2, y1+y2, and y1+b2, respectively. The columns are labeled according to the notation used by [1], where the lowercase y and b ions are equivalent to y1 and b1, and the uppercase Y and B ions are equivalent to y2 and b2. For example, the element in the upper left corner of Table 3 is the mass obtained by adding the masses of the y9 ion to that of the Y7 ion, minus two Daltons. The Y ion below this element is Y8, and so on to Y18 at the bottom. The mass values are comma delimited, which allows the file to be imported into a spreadsheet for easier manipulation and analysis. Researchers can then determine the match with the MS/MS spectrum of the two peptides. The program that implements the Indexed approach (indexID) accepts the input of two peptides in the form of their amino acid sequences, followed by a value for mw. Finally, the number of spectrum masses followed by the spectrum mass values is input. The program
2927.3 3042.4 3157.4 3214.5 3285.6 3398.7 3527.9 3641.0 3778.2 3042.4 3157.4 3272.5 3329.6 3400.7 3513.8 3642.9 3756.1 3893.2 3189.5 3304.6 3419.7 3476.8 3547.8 3661.0 3790.1 3903.3 4040.4
Table 3. Excerpt of enumID output
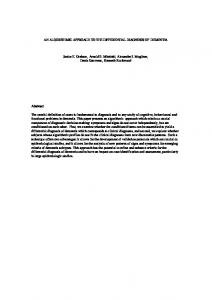
8. Experimental results The software was tested using the peptide and MS/MS data described in [1], reproduced here as Fig.2. Here, p1 = HLELAGDDPYSNVDCTK, and p2 = FDMDVDPFAIQCLDEHLR. Using the program enumID, we generated the output mass space, a portion of which is excerpted as Table 3. We then were able to identify the same disulfide bonded fragments that are identified in Fig.2. For example, the element in the last row of the first column corresponds to the ion combination y9+Y18. This is identified as the peak in Fig. 2 at m/z = 1594.5. Since this peak is identified as a doubly charged ion, the molecular mass of a singly charged ion is 1594.5 × 2 = 3189.0 Da. EnumID also created the mass spaces for the other disulfide bonded peptides in [1] (Figs. 8-11), and the match with the MS/MS spectrum confirmed their identification. We repeated these tests with the indexID program, inputting the nine “Y+y” peaks, with mw= 2.0 Da. IndexID successfully identified all nine peaks. (The peak at m/z = 1106.3 was incorrectly identified as Y17y12 in [1], when it is actually Y12y17. This was discovered during testing of indexID.) IndexID identified the peak at m/z = 1233.4 as either Y12y9 or Y16y5, both of which are in the same band for this mass peak. To investigate the performance characteristics of the Indexed vs. the Enumerated approaches, we compared the computational efficiency of the Indexed approach with that of the Enumerated approach. Fig. 4 shows the results we obtained for the number of mass table elements that need to be dynamically generated by this approach relative to the entire mass table. The software was designed to save mass table entries across searches so that the same element is not recomputed. We also measured the execution speed of creating the mass table using EnumID as well as the execution times of finding a match using IndexID. The input peaks for the Indexed approach were the nine doubly ionized y1+y2 ion combinations shown in Fig.2. Our
results, which are summarized in Fig.3, show that IndexID performs markedly better than the EnumID. These measurements were made using a PC system with a 1.8 GHz CPU. A significant factor in this performance differential is that EnumID must use system I/O to write the mass tables to disk, while IndexID does not. Note that the performance of the Enumerated approach does not vary with the number of queries, since the time to find the match in not included.
1594.5 x 2=3189
9. Conclusion This paper describes our research in developing techniques for the determination of disulfide linkage patterns in proteins. The proposed approach is characterized by the development of an efficient indexing-based search step that utilizes actual experimental data from tandem mass spectrometry to identify the disulfide bond locations. Our methodology is not only data driven, but also does not require assumptions about sequence homology. Thus, it can be applied to cases in which information regarding homology is either unavailable or not applicable.
10. Acknowledgement
1233.4 x 2=2466.8
1659.1 x 2=3318.2
This research was funded in part by a grant from the Center for Computing for Life Sciences at San Francisco State University.
11. References [1] T.Y. Yen, B.A. Macher, S. Bryson, X. Chang, I. Tvaroska, R. Tse, S. Takeshita, A.M. Lew, and A. Datti, “Highly Conserved Cysteines of Mouse Core 2 1,6-N-Acetyl glucosaminyltransferase I Form a Network of Disulfide Bonds and Include a Thiol That Affects Enzyme Activity,” J Biol Chem., 2003, Nov 14;278(46):45864-81.
Figure 2. Tandem MS spectra (Fig. 7 of [1])
Execution Time (ms)
Figure 3. Performance of Enumerated vs. Indexed Approaches
[2] A. Vullo and P. Frasconi, “Disulfide connectivity prediction using recursive neural networks and evolutionary information”, Bioinformatics, 2004. 20(5): p. 653-9.
100 80 60
Enumerated
40
Indexed
20 0 0
2
4
6
8
10
[4] M. Mann and R. Aebersold, “Mass spectrometry-based proteomics”, Nature, 2003, 422(6928):198-207.
Number of MS/MS Peaks
Figure 4. Efficiency of Indexed Approach Percentage of Mass Table Generated
[3] T.Y. Yen and B.A. Macher, "Determination of glycosylation sites and disulfide bond structures using LC/ESI-MS/MS analysis", Methods in Enzymology (in press), 2006.
[5] K. Angata, T. Yen, A. El-Battari, B.A. Macher, and M. Fukuda, “Unique disulfide bond structures found in ST8Sia IV polysialyltransferase are required for its activity”, J Biol Chem., 2001, May 4;276(18):15369-7.
50 40 30
[6] J.L. Klepeis and C.A. Floudas. “Prediction of β-sheet topology and disulfide bridges in polypeptides”, J. Comput. Chem., 2003, 24:191–208.
20 10 0 0
2
4
6
Number of MS/MS Peaks
8
10
[7] F. Ferre and P. Clote, “Disulfide connectivity prediction using secondary structure information and diresidue frequencies”, Bioinformatics, 2005 May 15;21(10):2336-46.