Multi-agent Modeling and Simulation Approach for Design and Analysis of MER Mission Operations Chin Seah Science Applications International Corporation
[email protected] Maarten Sierhuis Research Institute for Advanced Computer Science
[email protected]
William J. Clancey NASA Ames Research Center and Institute for Human and Machine Cognition
[email protected]
Keywords: Work Practice, Multi-Agent Systems, Mission Operations, Business Process Simulation.
reaction to experiences with work process modeling and simulation in the T1-order process redesign project at the NYNEX Corporation [Sachs 1995]. The workflow modeling-paradigm environment (Sparks™ from Coopers & Lybrand) was unable to represent social systems that played a role in how work actually got done in the NYNEX organizations so Brahms was developed to not only incorporate all benefits of work process modeling and simulation, but to distinctively relate people, locations, systems, artifacts, communications and information content. Brahms comprises of an agent-based modeling language and simulation environment based on an agent modeling language [van Hoof and Sierhuis 2000]. People, robots and systems are modeled as agents and objects with behaviors as conditional activities. Agent behaviors are dynamic, responsive to changes in the environment. Conditional activities within ‘workframes’ allow experimentation with different work scenarios by modifying the agents’ environment or ‘beliefs’. The state of the world in Brahms is modeled as ‘facts’. Agents become aware of these facts through ‘detectables’ which results in agent belief about the environment. Changed beliefs then activate workframes. The conditionality of activities is defined by ‘preconditions’ which are matched against agent beliefs. Therefore, behaviors are data-driven. The activities performed by an agent can change its beliefs as well as facts in the world. Multiple activities within an agent can be active concurrently but are either in an interrupted or impasse state. An agent performs only one activity at a time. The simulation work selector determines, based on the priorities, which activity an agent performs at every state change. The Brahms Virtual Machine (VM) (Figure 1), schedules and manages state changes and the initiation, interruption, impasse, resumption and termination of activities through a discrete event engine that coordinates simulated time between all agents with a centralized
INTRODUCTION A space mission operations system is a complex network of human organizations, information and deepspace network systems and spacecraft hardware. As in other organizations, one of the problems in mission operations is managing the relationship of the mission information systems related to how people actually work (practices). Brahms, a multi-agent modeling and simulation tool, was used to model and simulate NASA’s Mars Exploration Rover (MER) mission work practice. The objective was to investigate the value of work practice modeling for mission operations design. From spring 2002 until winter 2003, a Brahms modeler participated in mission systems design sessions and operations testing for the MER mission held at Jet Propulsion Laboratory (JPL). He observed how designers interacted with the Brahms tool. This paper discusses mission system designers’ reactions to the simulation output during model validation and the presentation of generated work procedures. This project spurred JPL’s interest in the Brahms model, but it was never included as part of the formal mission design process. We discuss why this occurred. Subsequently, we used the MER model to develop a future mission operations concept. Team members were reluctant to use the MER model, even though it appeared to be highly relevant to their effort. We describe some of the tool issues we encountered. BRAHMS Brahms was conceived as a business process modeling and simulation tool that incorporates the social systems of work, thus illuminating how formal process flow descriptions relate to people’s actual located activities in the work place [Clancey, Sachs, Sierhuis and van Hoof 1998] [Sierhuis and Clancey 2002]. Research for developing Brahms started in the early nineties as a
scheduler. The Brahms VM captures all agent behaviors in a file for later analysis.
Thoughtframes
Beliefs and Facts Workframes
Groups and Agents Geography
Classes and Objects Activities
Figure 2. Brahms Composer
Figure 1. Brahms Environment The Brahms Integrated Development Environment (IDE) includes the Brahms Composer (Figure 2). The Brahms Composer offers various connected design views that are based on the World Modeling Framework [Selvin 1999], including: organization/people, artifact/system, data/information, geography/location, communications, activity/task and timing/flow. These design views present modeled concepts, such as agent groups, objects and geography, hierarchically for convenient access. The Composer’s multiple views also allow a modeler to graphically create and edit concepts; these are automatically converted into a simulation model for input to the Brahms VM.
If so desired, a designer could manually update the generated simulation model outside of the design views by manipulating code; changes are automatically reflected in the design views. The Brahms Agent Viewer (Figure 3), another part of the Brahms IDE, parses a file generated by the Brahms VM into a database and provides the simulation visualization of the agent behaviors, collaborations and state changes. The visualization shows a chronological history of what activities are performed by people or robots, who works with whom, where and when. The visualization also shows tools or systems in use by particular people or robots and when information is communicated between them as time progresses.
Figure 3. Brahms Agent Viewer
MARS EXPLORATION ROVER (MER) MISSION The Mars Exploration Rover (MER) mission to the surface of Mars is a dual-robot mission with unprecedented operational capabilities and provided new operational challenges. With a complement of remote sensing and in-situ science instruments, and the ability to traverse a distance in one day roughly equivalent to the distant traversed by Pathfinder’s Sojourner Rover over its entire mission lifetime, the scientists seek to determine the history of climate and water at a site on Mars where conditions may once have been favorable to life. The first rover, Spirit, was launched during the summer of 2003 followed a month later by its twin, Opportunity. Both rovers landed safely on Mars in the early part of 2004. The Jet Propulsion Laboratory (JPL) in Pasadena, CA, started twenty-four hours, round-the-clock mission operations when the rovers landed. Scientists and engineers worked together at JPL to plan and operate the science instruments on the rovers. After the first three months of surface operations, JPL scaled back its operations to a roughly eight hours a day schedule. BRAHMS MODEL OF MER The task of the MER mission designers was to integrate legacy systems with newly developed systems plus to set up work processes for scientists and engineers in three shifts during a twenty-four hour period. Their challenge was to create a seamless workflow that would get the most productivity out of the rover on Mars. In late 2002, the first author, Chin, participated in JPL’s mission operations design meetings and researched the mission operations design documentation. He interviewed key MER team members, asking them to describe their future MER mission operations job activities, information needs, interfaces and tools. From this data, we created an initial MER mission operations model and simulation in Brahms. As a heuristic for completeness, we chose a scenario that covered a complete sol (Martian day) of mission operations. Contents of Model The main activities within a sol were to receive data from the rover, convert data for analysis, discussions and archival by the Earth-based team, make decisions on what the rover should do next, and send command data to the rover (Figure 4). In the simulation scenario, scientists and
engineers work together to create in computer systems artifacts, such as the Uplink and Downlink Reports and Rover Activity Plans which are the focus of their discussions everyday. Following JPL’s design of the MER mission operations organization, people were modeled as groups of Brahms agents. For example, we included Brahms agents representing discipline-specific scientists within the Science Operation Working Group (SOWG). The Mars rovers were also modeled as agents because they had activities including movements and communications that changed their environment. UHF Communications
UHF Communications
X-Band Communications
Data Acquisition & Command Subsystems
Mission Control Real-Time Operations Team
Spacecraft Engineering Team Engineering Analysis Subsystems Science Operations Working Group Data Management & Archival Subsystems
Integrated Sequencing Team NASA, JPL Pasadena, CA
Science Operations Support Team
Science Activity Planning & Sequencing Subsystems
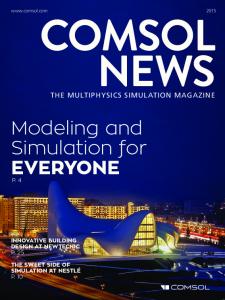
Figure 4. MER Mission Operations System Physical objects, such as science instruments, the instrument deployment device on the rover, communication devices and software systems were modeled as Brahms objects. Similarly, artifacts including data, reports and plans were also modeled as Brahms objects. The mission operations timeline (Figure 5) for a single sol stated the time and duration of each work process at a high-level. For example, during the SOWG meeting, scientists and engineers come together to decide what science experiments the rover should perform. We modeled a ‘SOWG Meeting’ as a conditional activity that states that when the clock in the agent’s office is 7:00pm, the activity becomes active. Depending on priority of other activities, the agent will interrupt what it is doing to engage in the ‘SOWG Meeting’ activity.
A c t i v it y N a m e U H F P a ss e s DT E N i g h t T i m e R o v e r O p e r at io n s
D u ra t i on 0 .1 0 0 .1 0 4 .5 0 0 .7 5 1 6 .9 7
10
11
12
13
14
15
16
MGS
17
18
19
20
21
22
23
0
1
2
O d ys se y
3
4
5
6
7
8
9
O d y s se y
MGS
D T E p e r io d
DFE N ig h t T im e R o v e r O p e r a t i o ns
S le e p
W ak e u p
P r e - C o m m S e s s io n S e q u e n c e P la n R e v ie w C u r r e n t S o l S e q u e n c e P la n R e v ie w P r io r S o l S e q u e n c e P la n R e v i e w R e a l- T Im e M o n i to r in g D o w nl in k P r o d uc t G e n e r a t io n . ..
1 .5 0 1 .5 0 2 .0 0
T a c t ic a l S c ien c e A s s e s s m e nt /O b s e r v a t ion P l a nn i n g
5 .0 0
S c ie n c e D L A s s e s s m e n t M e e t in g
1 .0 0
P a y lo a d D L / U L H a n d o ff s
0 .5 0
T a c t ic a l E n d - o f- S o l E n g r . A s s e s s m e nt
P r io r S o l S e q u e n c e P la n R e v i e w R e a l- T Im e M o n ito r in g
R e a l - T Im e M o n i to r in g D o w n li n k P r o d u c t G e n e r a t io n T ac t ic a l S c ien c e A s s e s s m e n t /O b s e r v a t i on P la n n in g S c ie n c e D L A s s e s s m e n t M e e t in g P a y l o a d D L / U L H a n d o ff s
7 .0 0
D L / U L H a n d o v e r M e e tin g
0 .5 0
E n g ine e r in g S k e le t o n A c t iv i t y P la n U p d a te ( p r e lim in a r y ) E n g ine e r in g S k e le t o n A c t iv i t y P la n U p d a te ( f in a l)
2 .5 0
S O W G M e e t in g
2 .0 0
U p l in k K i c k o ff M e e t in g
0 .2 5
A c t iv it y P la n I n te g r a t io n & V a lida t io n
C u r r e n t S o l S e q u e n c e P l an R e v ie w
4 .5 0 0 .7 5 2 .7 5
T a c t ic a l E n d - o f-S o l E n g r . A s s e s s m e nt D L / U L H a n d o v e r M e e tin g E n g ine e r in g S k e le t o n A c t iv it y P la n U p d a te ( pr e li m in a r y )
2 .5 0
E n g in e e r in g S k e le t o n A c t iv it y P l a n U p d a te ( fin a l) S O W G M e e t in g U p li n k K ic k o ff M e e t in g
3 .0 0
A c t iv it y P la n A p p r o v a l M e e tin g
0 .5 0
B u il d & V a lid a t e S e q u e n c e s
1 .5 0
U L 1 / U L 2 H a nd o v e r
1 .0 0
B u il d & V a lid a t e C o m m a n d L o a d
2 .0 0
M a r g in 1
0 .7 5
C o m m a n d & R a d i a tio n A p p r o v al
0 .5 0
M a r g in 2
1 .2 5
R a d ia tio n
0 .5 0
A c t i v it y P la n I n te g ra t io n & V a lid a t i o n A c t iv it y P la n A p p r o v a l M e e ti n g B u ild & V a l id at e S e q u e n c e s U L 1 / U L 2 H a nd o v e r B u ild & V a l id a t e C o m m a n d L o a d M a rg in 1 C o m m a n d & R a d i a tio n A p p r o v al M a r g in 2 R a d ia ti o n 10
11
12
13
14
15
16
17
18
19
20
21
22
23
0
1
2
3
4
5
6
7
8
9
Figure 5. MER Mission Operations Timeline VALIDATION OF MER MODEL We approached the mission operations designers for validation and verification. Validation Using Brahms Composer At the time, the Brahms Composer was still being developed so we did not have design views to present the model to the designers. To show the designers what was contained in the model, we used simple class-object diagrams (Figure 6).
Gossweiler 2002], for the MER mission and we were able to display the model’s simulation visualization on it. Observation of User Validation Using the MERBoard as a platform, we could get the mission designers to interact with the model. We trained them on how to use the Brahms Agent Viewer and discovered that they had very little trouble navigating the simulation visualization. We believe that because the designer’s ‘mental model’ [Norman and Draper 1986] of the MER mission operations timeline (Figure 5) was very close to Brahms Agent Viewer’s presentation of the simulation (Figure 3), the designers were able to quickly start analyzing the simulation output.
Figure 6. MER Mission Operations Agent Group Hierarchy Validation Using Brahms Agent Viewer We could not install the Brahms Agent Viewer on JPL’s predominantly Apple computers because of operating system incompatibility. However, we collaborated with another group developing a large computer-based white board, called the MERBoard (Figure 7) [Trimble, Wales and
Figure 7. Brahms Agent Viewer on MERBoard We presented to the mission designers a problematic exchange of information between agents on the MER mission operations timeline that we had discovered in the simulation output. We listened to the designers’ discussions
about this issue and observed how they interacted with the Brahms Agent Viewer. From their discussions, we understood that the designers were looking in the work system design for someone who would be available to receive the information during the problematic period on the timeline. This person would need to pass the information along at a later time to someone else who required the information but was unavailable during the earlier time period. We observed the designers looking at multiple agents’ activities on the timeline displayed by the Brahms Agent Viewer. The designers were constantly ‘scrolling up and down’ within the Brahms Agent Viewer because it could only display three agents or objects on the screen (Figure 3). For the same reason, we noticed the designers were ‘closing’ and ‘opening’ different agent’s timeline for display. Other Validation Output The mission designers requested for us to generate a listing of the activities that each agent performs within a timeline period. They wanted to use the listings to develop operational procedures for mission operations personnel. We believe that because the designers could not install the Brahms Agent Viewer on their personal computers, they asked for paper copies of the output and mentioned that they would like to annotate on paper for their own use and to provide us with additional feedback. We generated a very large paper poster by capturing screen-shots of the Brahms Agent Viewer; we posted it on a large wall in their office area. We saw no annotations on the poster when we returned to inspect it when the mission started. We did get feedback from the mission designers about desirable simulation visualizations. The designers wanted to be able to easily see where the agents were geographically located for a given period on the timeline, especially during meetings. They also wanted to easily see what information is put on a rover activity plan as the plan is progressively modified during daily operations. In addition, they suggested it would be helpful to show communication networks that get created and grow as information gets communicated between agents as the day progresses. USE OF MER MODEL IN MISSION After developing the initial MER work practices model, the first author, Chin continued to participate in mission operations design sessions and observed field tests that JPL conducted to validate the mission operations design. With experience gained from the field tests, the designers modified their designs. We found that due to the highfidelity of our Brahms model, we were unable to keep up with the fast-paced changes that were occurring to the mission operations designs. Even when the Brahms Composer became available, we were unable to incorporate the changes in the mission operations designs to provide timely and useful feedback to the mission designers.
JPL designers felt that we did not provide timely modifications and analysis from the model and did not fulfill their requests for additional simulation output. Consequently, Brahms was never included as part of JPL’s formal design tool for the MER mission. NEW USE OF MER MODEL In summer 2004, a group at NASA Ames Research Center was formed to collaborate with JPL to research and develop new architectures and technologies for operating future autonomous robots on planetary missions. Most of the people in the group had been involved with the MER mission as developers of applications used by the mission operations team. We were asked to participate in the group to share the broader workflow and mission operations knowledge we had gained from the MER mission. We were keen on working with the group to modify the MER mission model, based on the new architectures and technologies discussed for future robotic missions. We presented the MER mission operations model and simulation developed using the Brahms Composer and Brahms Agent Viewer. After our presentation, we were surprised that the group decided to study and evaluate other modeling tools and environments. MER MODEL IN UML We were told by the group that they preferred to utilize a modeling technique with which they were all familiar. The majority of the people in the group were familiar with the Unified Modeling Language (UML) [Booch, Jacobson and Rumbaugh 1999]. They wanted a modeling tool that used UML and could produce printouts and be exportable into other graphical modeling or ontology tools. The group learned about a standard, called XML Metadata Interface (XMI) [Object Management Group, Inc. 2002], currently being used by several UML tool vendors for importing and exporting models. Consequently, the group chose a tool that was able to export and import XMI files. We investigated whether Brahms models could be exported based on the XMI specifications. We were able to develop an interface to our current agent modeling language and output XMI compliant files. We were then able to import the model into the chosen UML tool and display the MER mission operations model within the tool (Figure 8). As a benefit of importing to a UML tool, we could now print out our models, instead of manually drawing diagrams (Figure 6) using another tool. Currently, the group is extracting information from the UML models that we generated from the MER model to prepare for a pilot demonstration of their technology architecture at the end of 2005.
Figure 8. MER Science Team modeled in UML CONCLUSION We have learned that researching and developing a tool, like Brahms, for modeling and simulating complex humanrobot work processes is both technically and organizationally complex. From our experience of modeling the MER mission operations work processes and then using the model for another project where the model is relevant, we have realized that we still need to improve our Brahms environment for ease of use and compatibility with other tools. We continue to research and develop user interfaces for modeling and visualizations for simulations. When we have users who are not trained in modeling, yet are able to interact with the models and understand simulation results in our Brahms environment, then we will say that we have a ‘user friendly’ and ‘easy to use’ tool. References Clancey, W. J., Sachs, P., Sierhuis M. and van Hoof, R. 1998. "Brahms: Simulating practice for work systems design," International Journal on Human-Computer Studies, vol. 49, pp. 831-865, 1998. Sierhuis, M. and Clancey, W. J. 2002. "Modeling and Simulating Work Practice: A human-centered method for work systems design", IEEE Intelligent Systems, vol. 17(5)(Special Issue on Human-Centered Computing). Sachs, P. 1995. "Transforming Work: Collaboration, Learning, and Design", Communications of the ACM, vol. 38, pp. 36-44, 1995. Selvin, A. 1999. "Supporting Collaborative Analysis and Design with Hypertext Functionality", Journal of Digital Information, (Special Issue on Hypertext Functionality) January 1999.
Trimble, J., Wales, R. and Gossweiler, R. 2002. NASA Position Paper for the CSCW 2002 Workshop on Public, Community and Situated Displays: MERBoard. Norman, D.A. and Draper, S.W. 1986. User Centered System Design, Lawrence Erlbaum. Booch G., Jacobson I. and Rumbaugh J. 1999. The Unified Language User Guide, Addison-Wesley, Reading, MA. Object Management Group, Inc. 2002. OMG XML Metadata Interchange (XMI) Specification. Object Management Group, Inc. version 1.2, Needham, MA, Jan.