Merauke Papua â Indonesia. Azhari ... This research is devided into five parts. The first part is an .... 4) electricity, gas and clean water, 5) building, 6) commerce,.
International Journal of Computer Applications (0975 – 8887) Volume 117 – No. 7, May 2015
Multi Attribute Decision Making Method for Determination of Regional Development Plan Priority in Papua Province based on the Indicator of Gross Regional Domestic Product (GRDP) Heru Ismanto
Azhari
Information Systems Dept. Musamus University Merauke Papua – Indonesia
Computer Science and Electronic Dept. Gajah Mada University Yogyakarta - Indonesia
ABSTRACT Development as ongoing activity needs certain planning in order to be zero in on and has clear direction. Therefore, it is needed a model for the analysis medium in determining regional priority to development implementation in the future. This research applied multi attribute decision making (MADM) concept for analyzing data of GRDP of Papua Province. Two methods of MADM have been used in this research, those are wighted product (WP) and Technique of Order Preference by Similarity to Ideal Solution (TOPSIS). Twenty nine regencies were analyzed based on the data of GRDP to observe which region will be the development priority later. Result of the research by comparing the two methods are obtained six regencies which need special attention, those are Central Mamberamo Regency, Yalimo, Nduga, Intan Jaya, Mamberamo Raya and Deiyai. The research is expected can be the supporting material of decision in development planning field for the policy implementer, so that able to determine regional priority for development activities in the future.
Keywords Development Plan, MADM, GRDP, Weighted Product, TOPSIS.
1. INTRODUCTION Process of development is the activity conducted in order to improve the standard of public life to reach prosperity and welfare of life by utilizing the resources owned by each region (Mursidah et al, 2013). The development certainly needs planning from clear direction so that the objectives of the development itself will be reached. The development plannings, one of them can be conducted by reobserving the regional development attainment to observe how far the development successfully conducted. Many methods are used to analyze development result such as Klassen Typology, shift share analysis, Williomson Index, location quotient, Theil Index, Lorenz Curve, Gini Ratio and L Index which are used to measure the attainment of a regional development based on certain indicators (Yunisti, 2012; Dyatmika,2013). The result of measurement is then used as a reference to implement the development in the future. Information technology development especially the theory about supporting decision making gives special space to regional development planning activity. Regional planning in this case is related to development priority determination which will be implemented later. Some regions will be made as the development priority alternative appropriate to various criteria used. Therefore, this research is important to study because selection of the regions as the priority to regional
development plan can be conducted using MADM concept. This concept offers selection methods which appropriate to the problem related to determination of regional priority which is going to build based on the ranking. There are many methods of MDAM which can be used, two of them are Weighted Product (WP) and Technique of Order Preference by Similarity to Ideal Solution (TOPSIS). Some researches show that both of the methods can be used for ranking tecknique in selecting an option of some available alternatives. WP method is more used such as for the need of employee candidat selection at a business (Lestari, 2013), the Equilibrium bargaining strategy at auction business (Wang et al, 2010), for the field of health, the WP is used as the breast cancer detector medium (Azar, 2000) also used for the need of priority determination of superior product of a territory (Alfita, 2011). While TOPSIS, more used for the analysis medium in solving problem of alternative selection with many criteria, some of them are for solving problem related to group’s belief in decision making done by many decision makers (Jiang et al, 2010), the decision supporting system for laptop selection according to the need and budgeting (Kurniasih, 2013), the supporting anaylis of goup decision in knowledge management concept (Chu et al, 2007), the development of information system with decision supporting features (Imbar and Hartanto, 2011) and the credible nircable network selection (Savitha and Chandrasekar, 2011). Remembering the capability of both methods which able to conduct an alternative selection analysis by multi criteria, so this research discusses about regional determination analysis which will be prioritized for the development plan in the future. Data of GRDP indicator which consist of nine components, are become the determiner attribute to determine some of amount regencies which will be prioritized for the development later. The data of GRDP of Papua Province with twenty nine regencies were used in this research. Both methods were used as the analysis medium to observe which regencies need priority on development activities later. The result of research is expected to give suggestion for the policy implementer to implement the development based on analysis result which conducted by the assistance of WP method and TOPSIS, although it is possible to conduct by other methods. This research is devided into five parts. The first part is an introduction which consists of the background of problem, the second part consists of the theorical base which is used related to the research topic. The third part explains the research steps, the fourth part discusses the analysis result using method of WP and TOPSIS. The research is then finished by the fifth part that is the conclusion.
21
International Journal of Computer Applications (0975 – 8887) Volume 117 – No. 7, May 2015
2. MULTI ATTRIBUTE DECISION MAKING (MADM) MADM is an analysis method which reduces the use of mathematic and used for the selection of an alternative with some criteria. MADM is also used to solve problem in discrete space with alternative selection number is limited (Ermatita et al, 2010). In this research it was used two methods of MADM, those are Weighted Product (WP) and Technique of Order Preference by Similarity to Ideal Solution (TOPSIS). The explanation of both methods is as follows.
2.1 Weighted Product (WP) method
𝑟𝑖𝑗 =
𝑛 2 𝑖=1 𝑋𝑖𝑗
For i = 1, 2, 3 ... m and j = 1, 2 , 3 ... n b.
Making decision matrix which is in weight normalizied of (Vij), with the equation :
𝑉𝑖𝑗 = 𝑊𝑗 ∗ 𝑟𝑖𝑗 c.
Method of WP is a solving method which is offered to solve the problem of Multi Attribute Decision Making (MADM) and is similar to method of Meighted Sum (WS), but WP method contains multiplication in the mathematical calculation. This method is also called as an analysis and does not conduct the data normalization process. Below is the steps to analyze WP method (Alfita, 2011): a.
Determining positive ideal solution value (A*) and negative ideal solution (A’) with stipulation as follows : 1)
𝑉𝑖∗
2)
𝑊_𝐼𝑛𝑖𝑡𝑗 𝑊𝑗 = 𝑛 𝑗 =1 𝑊_𝐼𝑛𝑖𝑡𝑗 Making table of weight of criteria that will be selected.
c.
Calculating the vector of Si, where each data (Xij) will be multiplied but before that it is done the degreeing with the weight of its criteria, with the equation as follows:
Negative ideal solution value (A’)
𝑉𝑖′ d.
𝑘𝑊 𝑗
𝑋𝑖𝑗
1)
The gap between the alternative and positif ideal solution 1/2
Where j = 1, 2, 3 ... m, k =1 for profit attribute and k = -1 for cost attribute.
𝑆𝑖∗ =
Calculating vector of Vi and then choosing the highest value as the best alternative in decision making, with equation as follows:
𝑉𝑖 =
𝑀𝑎𝑥 𝑉𝑖𝑗 𝑖𝑓 𝑗 𝑖𝑠 𝑎𝑡𝑡𝑟𝑖𝑏𝑢𝑡𝑒 𝑝𝑟𝑜𝑓𝑖𝑡𝑠 𝑀𝑎𝑥 𝑉𝑖𝑗 𝑖𝑓 𝑗 𝑖𝑠 𝑐𝑜𝑠𝑡 𝑎𝑡𝑡𝑟𝑖𝑏𝑢𝑡𝑒
Determining the gap between each alternative value with the positive ideal solution matrix and negative ideal solution matrix, with equation :
𝑗 =1
d.
𝑀𝑎𝑥 𝑉𝑖𝑗 𝑖𝑓 𝑗 𝑖𝑠 𝑎𝑡𝑡𝑟𝑖𝑏𝑢𝑡𝑒 𝑝𝑟𝑜𝑓𝑖𝑡𝑠 𝑀𝑎𝑥 𝑉𝑖𝑗 𝑖𝑓 𝑗 𝑖𝑠 𝑐𝑜𝑠𝑡 𝑎𝑡𝑡𝑟𝑖𝑏𝑢𝑡𝑒
A’ = {V1*, V2*,....,Vn*) where
𝑛
𝑆𝑖 =
Positive ideal solution value (A*) A* = {V1*, V2*,....,Vn*) where
Determining the priority level of the weight of each criteria (W_Initj) then it is done the improvement of the weight (Wj) using equation as follows :
b.
𝑋𝑖𝑗
𝑉𝑗∗ − 𝑉𝑖𝑗
2
𝑗
𝑆𝑖 𝑛 𝑗 =1 𝑆𝑗
2)
The gap between alternative and negative ideal solution 1/2
Where j = 1, 2, 3 ... m.
2.2 Technique of Order Preference by Similarity to Ideal Solution (TOPSIS) method This method selects an alternative based on the gap of the nearest or farthest ideal solutions from the value of the negative ideal solution alternative. Many reasons of the use of TOPSIS as the decision supporting analysis medium are because the concept is simple and easily understood, the computation is efficient and has capability to measure relatively form the decision alternatives in simple mathematical form. Below is the steps for TOPSIS analysis (Behzadian et al, 2012) : a.
Making decision matrix which is normalizied (rij). This step is started by forming the first decision matrix, then the normalization is conducted with the equation as follows :
𝑆𝑖′ =
𝑉𝑗′ − 𝑉𝑖𝑗
2
𝑗
e.
Calculating the relative closeness value to ideal solution value Ci*, with equation :
𝐶𝑖∗ =
2.3 Gross (GRDP)
Regional
𝑆𝑖′ 𝑆𝑖∗ + 𝑆𝑖"
Domestic
Product
GRDP is the result of total value plus all units of business which are owned by certain region and calculated on the applied price also constant price (Indonesian Bank Real Sector Statistic Division, 2014). GRDP with the applied price is used to find out the economic resource ability, the economic displacement and structure of a region. While the
22
International Journal of Computer Applications (0975 – 8887) Volume 117 – No. 7, May 2015 GRDP with the constant price is used to find out the economic growth in real over the years by no influence of the price factor. GRDI is classified based on nine supporting indicators, those are 1) agriculture, animal husbandry, forestry and fishery, 2) mining and excavation, 3) manufacturing industry, 4) electricity, gas and clean water, 5) building, 6) commerce, hotel and restaurant, 7) transportation and communication, 8) finance, real estate and business service, and 9)services (included government service). In this research, the resource of GRDP of Papua Province of the year 2012 which used is based on the constant price, as assumption that the analysis result is used to find out the rank of development based on real growth owned by a certain region.
3. RESEARCH METHODOLOGY
every regency/city in Papua Province from the official site of National Central Bureau of Statistics, either province or regency. The nine indicators which become the data in this research are, agriculture (V1), mining and excavation (V2), manufacturing industry (V3), electricity and clean water (V4), building (V5), commerce, hotel and restaurant (V6), transportation and communication (V7), finance, real estate and business service (V8), and services (V9). Twenty nine regencies/cities were analyzed in this research using method of Weighted Product (WP) and Technique of Order Preference by Similarity to Ideal Solution (TOPSIS). In this research, it used the data of GRDP of regencies of the year 2012. The analysis result of both methods were compared to know which regency that must be prioritized for development plan in the future.
This part discusses about the steps of the research conducted. This had been begun by data collecting of GRDP indicator of Table 1. The Beginning Decision Matrix V1
V2
V3
V4
V5
V6
V7
V8
V9
K01
730.285,85
30.192,02
54.377,31
7.878,56
150.869,31
187.006,01
199.508,22
72.551,55
292.499,75
K02
202.753,31
5.665,84
2.097,24
1.893,73
71.294,72
86.831,08
85.834,55
25.032,14
124.544,40
K03
324.380,32
29.081,17
74.920,73
1.790,52
129.907,12
130.544,34
186.147,31
47.387,62
167.163,68
K04
307.850,76
138.896,28
7.933,00
4.114,96
150.807,94
156.437,10
72.964,27
40.386,93
123.144,36
K05
74.461,54
4.562,27
5.858,32
2.575,36
58.884,81
61.100,11
34.795,96
35.699,03
123.991,33
K06
184.412,90
15.021,44
69.344,06
13.506,06
116.586,38
182.847,72
198.854,04
72.355,96
136.653,85
K07
97.845,30
4.592,92
497,79
69,83
36.917,65
16.188,48
7.131,27
3.222,56
38.503,05
K08
102.720,22
1.904,31
154,28
43.793,39
22.706,56
6.375,26
1.767,31
49.599,46
K09
163.839,62
5.555.631,81
8.594,88
9.292,32
302.233,14
412.581,98
401.527,34
104.176,53
99.054,14
K10
106.710,21
4.059,88
225.657,35
40,56
120.718,19
29.377,14
13.166,09
10.418,63
42.634,50
K11
124.690,08
1.755,53
1.445,01
10,46
86.664,26
24.858,19
12.843,59
5.147,84
102.469,19
K12
101.877,80
249,59
3.324,08
18,65
39.769,29
18.202,62
9.591,11
4.985,62
118.219,20
K13
111.774,91
730,16
1.229,07
-
19.167,34
8.659,11
10.738,40
2.797,34
54.381,95
K14
138.756,47
2.343,32
176,03
-
64.783,84
21.576,09
16.566,49
5.444,16
52.984,28
K15
123.123,36
1.093,57
862,54
42,27
33.441,60
11.502,11
10.630,30
1.430,17
44.120,85
K16
122.771,65
5.201,19
7.824,00
574,02
45.726,90
22.895,14
34.139,38
9.548,40
38.404,20
K17
113.062,53
6.488,85
37.387,45
489,52
118.837,27
44.769,37
13.876,41
10.981,12
73.201,17
K18
49.677,63
2.216,28
889,12
328,81
36.220,31
12.059,69
6.781,01
6.254,25
62.412,78
K19
60.681,80
1.989,77
3.410,04
38,13
15.572,61
26.897,16
11.015,36
5.196,29
13.651,88
K20
43.863,99
1.794,68
446,58
-
23.825,42
20.957,32
5.992,96
5.092,79
74.262,11
K21
44.499,44
967,19
-
-
17.000,22
1.537,47
3.183,81
1.707,88
36.224,44
K22
45.194,65
363,09
-
-
15.715,42
615,65
791,36
1.151,73
34.602,26
K23
1241.68,26
2.017,46
-
-
58.168,66
1.206,67
1.796,30
1.337,14
58.385,78
K24
40.685,67
357,46
-
-
22.322,41
585,18
1.022,86
K25
101.570,11
110,56
-
63,96
41.571,16
17.456,65
K26
180.854,63
5.063,36
151,70
-
16.638,85
42.155,47
K27
78.893,58
1.972,21
215,20
-
19.602,91
K28
50.353,46
601,49
373,34
-
12.874,56
4.518,51
3.215,31
621,85
44.855,11
1.148,16
76.422,19
1.487,21
4.704,99
40.024,17
6.811,13
1.044,61
297,85
31.644,53
5.498,22
1.292,11
440,88
45.106,25
23
International Journal of Computer Applications (0975 – 8887) Volume 117 – No. 7, May 2015 K29
249.829,87
21.104,12
134.988,98
23.101,14
4. RESULT AND DISCUSSION Result of data collecting of GRDP of regencies is as the data of beginning decision matrix that contain preferency values of result of double comparison between twenty nine alternatives and nine attributes. Table 1 above shows the data of beginning decision matrix which would be used to analyze development priority level using method of WP and TOPSIS. Where K01–K029 shows the name of regencies serially as follows, Merauke, Jayawijaya, Jayapura, Nabire, Kepulauan Yapen, Biak Numfor, Paniai, Puncak Jaya, Mimika, Boven Digoel, Mappi, Asmat, Yahukimo, Pegunungan Bintang, Tolikara, Sarmi, Keerom, Waropen, Supiori, Mamberamo Raya, Mamberamo Tengah, Yalimo, Lanny Jaya, Nduga, Puncak, Dogiyai, Deiyai, Intan Jaya Regency and Jayapura City. Table 2. Attribute Weight Attribute
Weight
V1
0,191
V2
0,266
V3
0,029
V4
0,003
V5
0,130
V6
0,099
V7
0,099
V8
0,043
V9
0,140
Before being analyzed using both methods, firstly it had been held weight determination for each attribute. The determination of weight value was carried out by deviding total values of each attribute with total number of the attributes, so it was obtained the weight value for each attribute as follows (look at table 2). It is necessary to note that the ranking which conducted on the last step of method analysis, was conducted by putting the data in order from the smallest value to the hihghet one. The analysis result towards steps of each method shows that the preferency value on double comparison matrix did not influence to the final result of ranking for TOPSIS method although there was value of beginning decision matrix that had no value. This was caused by on the calculation step of either positif or negative ideal solution was done by calculating quadrate root to difference adding from either negative or positive ideal solution values with in weight normalizied matrix which was being in quadrate, for each alternative towards the attributes. Therefore, each alternative had its own ideal solution value. Different from WP method, the calculation of each step on WP was extremely influenced by the completeness of value on beginning decision matrix. So the last value of vector of each alternative would depend on values calculated on the previous step. Below is the description of analysis result of both methods.
980.092,85
612.385,39
813.903,40
458.220,43
887.309,83
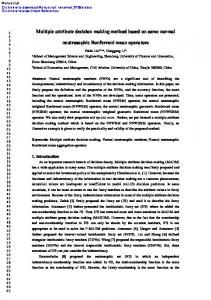
Puncak, Dogiyai, Deiyai and Intan Jaya. Table 3 below shows the ranking result towards value of vector Vi to select the lowest value as the best alternative to determination development priority level. Figure 1 below shows the rangking result of WP method in the pie chart. Table 3. Ranking result of WP method No
Regency
Vi
Rank
1
K01
0,098
26
2
K02
0,034
22
3
K03
0,072
25
4
K04
0,110
27
5
K05
0,029
20
6
K06
0,054
24
7
K07
0,020
16
8
K08
0,023
19
9
K09
0,269
29
10
K10
0,030
21
11
K11
0,022
17
12
K12
0,012
12
13
K13
0
1
14
K14
0
1
15
K15
0,013
14
16
K16
0,023
18
17
K17
0,037
23
18
K18
0,016
15
19
K19
0,012
13
20
K20
0
1
21
K21
0
1
22
K22
0
1
23
K23
0
1
24
K24
0
1
25
K25
0
1
26
K26
0
1
27
K27
0
1
28
K28
0
1
29
K29
0,118
28
The first analysis had been conducted using WP method and showed that eleven regencies/cities which must obtain special attention in development plan in the future. The eleven regencies are Yahukimo, Pegunungan Bintang, Mamberamo Raya, Mamberamo Tengah, Yalimo, Lanny Jaya, Nduga,
24
International Journal of Computer Applications (0975 – 8887) Volume 117 – No. 7, May 2015 26
K26
0,203
24
K13 0
27
K27
0,192
10
K14 0
28
K28
0,191
7
K20 0
29
K29
0,395
28
K21 0 K22 0 K23 0
K05 0,193
K24 0
K06 0,186
K25 0
K16 0,190
K26 0
K18 0,191
K27 0
K19 0,189 K20 0,192
Figure 1. Rangking result of WP method in the pie chart
K21 0,190
Table 4. Ranking result of TOPSIS method No.
Regency
K22 0,191
C Ideal Solution
Rank
K24 0,191 K27 0,192
1
K01
0,328
27
2
K02
0,198
20
3
K03
0,215
25
4
K04
0,230
26
5
K05
0,193
11
6
K06
0,186
1
7
K07
0,193
12
8
K08
0,194
14
9
K09
0,606
29
10
K10
0,203
23
11
K11
0,199
22
12
K12
0,197
18
13
K13
0,194
13
14
K14
0,196
17
15
K15
0,194
15
16
K16
0,190
4
17
K17
0,199
21
18
K18
0,191
8
19
K19
0,189
2
20
K20
0,192
9
21
K21
0,190
3
22
K22
0,191
5
23
K23
0,197
19
24
K24
0,191
6
25
K25
0,196
16
Figure 2. Ranking result of TOPSIS method In the pie chart The second analysis was conducted by the medium of TOPSIS and showed the eleven regencies which need special priority to future development planning. The eleven regencies are Biak Numfor, Supiori, Mamberamo Tengah, Sarmi, Yalimo, Nduga, Intan Jaya, Waropen, Mamberamo Raya, Deiyai dan Kepulauan Yapen. Table 4 above is the ranking result based on ideal solution value on the last step of TOPSIS calculation. Figure 2 below shows the rangking result of Topsis method in the pie chart. Based on the analysis comparison result of both methods, it can be seen that from the eleven regencies which need priority to development plan according to both methods, the six regencies that have the same result when both methods were compared. The six regencies are Mamberamo Tengah, Yalimo, Nduga, Intan Jaya, Mamberamo Raya dan Deiyai.
5. CONCLUSION This research indicates some regencies which still need priority towards the development plan in the future. The analysis result from both methods shows from twenty nine regencies observed, there are six regencies needing special attention those are Mamberamo Tengah, Yalimo, Nduga, Intan Jaya, Mamberami Raya dan Deiyai. This research also shows that the last step of calculation of preferency value for WP method was extremely influenced by completeness of beginning decision matrix value. The result is expected can be decision supporting item in the field of development planning for policy implementer, so it is able to determine the regional priority for development activities in the future. The coming research will be directed how to develop FMADM method combined with various methods of using other indicators.
6. REFERENCES
25
International Journal of Computer Applications (0975 – 8887) Volume 117 – No. 7, May 2015 [1] Alfita, Riza, 2011, Perancangan Sistem Pendukung Keputusan Penentuan Prioritas Produk Unggulan Daerah Menggunakan Metode Weighted Product (WP), Prosiding Seminas Competitive Advantage, Vol 1, No 1 (2011) [2]
[3]
[4]
[5]
[6]
Azar, Fred S., 2000, " Multiattribute Decision-Making: Use of Three Scoring Methods to Compare the Performance of Imaging Techniques for Breast Cancer Detection", Technical Reports (CIS). Paper 119. http://repository.upenn.edu/cis_reports/119 Behzadian, M., Otaghsara, S. K., Yazdani, M., dan Ignatius, J., 2012, A state-of the-art survey of TOPSIS applications, Expert Systems with Applications 39 (2012) 13051–13069, ELSEVIER Chu, Mei-Tai, Joseph Shyu, Gwo-Hshiung Tzeng dan Rajiv Khosla, 2007, Comparison among three analytical methods for knowledge communities group-decision analysis, Expert Systems with Applications 33 (2007) 1011–1024 Dhyatmika, Ketut Wahyu, 2013, Analisis Ketimpangan Pembangunan Provinsi Banten Pasca Pemekaran, Skripsi Fakultas Ekonomi dan Bisnis Universitas Diponegori, Semarang. Divisi Statistik Sektor Riil Bank Indonesia, Produk Domestik Regional Bruto, METADATA - Divisi Statistik Sektor Riil Bank Indonesia, Jakarta. Available at http:// www.bi.go.id /id/ statistik/ metadata/ sekda/ Documents/ 8PDRBSEKDA1.pdf
[7] Ermatita, Hartati, S., Wardoyo R., dan Harjoko, A., 2010, MADM methods in solving group decision support system on gene mutations detection simulation ,2010 International Conference on Distributed Framework and Applications (DFmA). [8]
Imbar, R.V., dan Hartanto, B.S., 2011, Aplikasi Sistem Informasi Sumber Daya Manusia dengan Fitur DSS
Menggunakan Metode Topsis pada PT. X, Jurnal Informatika, Vol. 7, No. 2, Desember 2011: 125 – 144 [9]
Jiang, J., Ying-Wu Chen, Da-Wei Tang dan Yu-Wang Chen, 2010, TOPSIS with Belief Structure for Group Belief Multiple Criteria Decision Making, International Journal of Automation and Computing 7(3), August 2010, 359-364
[10] Kurniasih, D.L., 2013, Sistem Pendukung Keputusan Pemilihan Laptop Dengan Metode TOPSIS, Pelita Informatika Budi Darma, Volume III Nomor : 2 Pelita Informatika Budi Darma, Volume III Nomor : 2 II Nomor : 2, April April April 2013 [11] Lestari, Sri, 2013, Penerapan Metode Weighted Product Model Untuk Seleksi Calon Karyawan, Jurnal Sistem Informasi (JSI), VOL. 5, NO. 1, April 2013, Halaman 540-545 [12] Mursidah., Hamzah, A., dan Sofyan, 2013, Analisis Pengembangan Kawasan Andalan Di Kabupaten Aceh Besar, Jurnal Ilmu Ekonomi, Volume 1, No. 1, Februari 2013, pp. 43- 55 [13] Perencanaan dan Kebijakan Publik Fakultas Ekonomi Universitas Indonesia, Jakarta [14]
Savitha, K. dan Chandrasekar, C., 2011, Trusted Network Selection using SAW and TOPSIS Algorithms for Heterogeneous Wireless Networks, International Journal of Computer Applications, Volume 26– No.8, July 2011
[15] Wang, M., Liu, S., Wang, S., dan Lai, K.K., 2010, A Weighted Product Method For Bidding Strategies In Multi-Attribute Auctions, J Syst Sci Complex (2010) 23: 194–208 [16] Yunisti, Trias Dewi, 2012, Analisis Ketimpangan Pembangunan Antar Kabupaten/Kota Di Provinsi Banten, Tesis Program Magister
IJCATM : www.ijcaonline.org 26