facilities (i.e., distribution centers, shelters and meeting points), ... and minimize the worst-case scenario to perform people evacuation and distribution of relief.
Multi-criteria optimization approach to deploy humanitarian logistic operations integrally during floods Mejía-Argueta, Christopher - MIT Center for Transportation and Logistics Gaytán, Juan – Facultad de Ingeniería, UAEM Caballero, Rafael – Universidad de Málaga Molina, Julián – Universidad de Málaga Vitoriano, Begoña - – Universidad Complutense de Madrid
Abstract This work addresses frequent and foreseeable floods in the short-term preparedness of an imminent event using a multi-criteria optimization model integrated with a Geographic Information System to simulate flood levels, determine the best strategies and update information. The proposed model takes into account the four main relief operations: location of emergency facilities (i.e., distribution centers, shelters and meeting points), pre-positioning of humanitarian aid, evacuation and distribution of humanitarian aid. Three criteria are considered in the formulation to minimize: the maximum evacuation flow-time, the maximum distribution flowtime and total cost of relief operations. The approximation to the efficient frontier is built using multi-objective programming through the use of commercial software. The usefulness and the robustness of the model are verified using data from one of the worst Mexican floods considering various flood levels created from three key elements in humanitarian logistics. The strategies provided by the proposed methodology are compared with those implemented by the Mexican authorities during the studied disaster. Keywords: Multiple objective programming; Efficient solution; Weighted-sum method; Epsilonconstraint; Humanitarian operations
1
1. Introduction Natural disasters have impacted the world's population throughout the history of humanity with terrible consequences for inhabitants and their environment, as observed in several disasters over the past decade reported in AON BENFIELD (2016). According to the International Database of Disasters EM-DAT (2016), the number of disasters affecting countries around the world is apparently increasing, as well as the number of people affected by them (approximately 4.8 billion people were affected by natural disasters between 1970 and 2003 compared with around two billion people in the last decade). However, the number of victims is decreasing, showing the ability of the community to protect itself and increase its resilience. Among natural disasters, the maximum percentage increase is shown by hydrometeorological disasters, which constituted a share of 82% during the last decade (23% more than in the period 1970-2003) and affected almost one billion people. These disasters are closely related to seasonal weather events and can be accurately simulated in time, location and magnitude, allowing for the growth of more effective plans to address their consequences (Díaz-Delgado and Gaytán 2014). Disaster management is related to planning, implementing and controlling effective strategies to alleviate human suffering and reduce negative effects of disasters. The so-called disaster management cycle is divided into four phases (Tomasini and Van Wassenhove 2009): mitigation, preparedness, response and recovery/reconstruction. Despite the knowledge gained during the last two decades, disaster management remains a major challenge, creating important research opportunities in the analysis of integrated humanitarian operations and the application of multiple criteria decision-making (see Ortuño et al. 2013; Leiras et al. 2014; Gutjahr and Nolz 2016). Multi-objective optimization is a research field that has grown since the end of last century and it is gaining more traction given the opportunities to analyze tradeoffs of multiple criteria in the same model (Ehrgott 2005). In general, the related techniques provide a decision maker the opportunity to identify and evaluate various alternative high-quality approximations to optimal solutions (non-dominated or Pareto optima) in order to support her final decision. This is particularly useful for decision makers in humanitarian contexts where there are diverse
2
conflicting criteria in the operations. Furthermore, stakeholders assess the scarce resources or try to meet specific values, then they need to find the most suitable solution and multi-criteria optimization provides them this. The aim of our approach is to introduce a methodology to make better decisions during the disaster preparedness phase, when the event is about to occur and becomes an emergency. This methodology involves two phases: 1) a geographical information system (GIS) that is used to simulate flood maps and evaluate damage in the available infrastructure (i.e., road network and potential emergency buildings) and 2) a multi-objective optimization model to determine the number and location of emergency facilities to be opened and the flow of evacuees and humanitarian aid through the available network using multiple vehicles, taking into account several criteria: evacuation and distribution flow-time, budget usage in various flood cases. Therefore, the main contribution of this work with regard to similar studies (e.g., RodriguezEspindola and Gaytan, 2015) is the formulation of a multi-criteria optimization model that contemplates a novel approach in evacuation by using a two-tiered strategy via meeting points, considers infrastructure saturation and availability of resources (i.e., vehicles, budget, facilities), and minimize the worst-case scenario to perform people evacuation and distribution of relief products under diverse circumstances in the short term after the disaster occurs. The paper is organized as follows: In Section 2, a brief literature review is presented. In Section 3, the framework of the proposed methodology is described together with the mathematical formulation of the problem under study. Once the methodology and the model are described, the results of a real Mexican case study related to a large flood in 2007 and a set of test instances are discussed in Section 4. Finally, Section 5 presents the study’s conclusions and a number of suggestions for future work. 2. Literature Review In the last decade, a large amount of literature has been published regarding humanitarian logistics and mathematical modelling. Among them, a number of review articles have been published in the last few years (see Ortuño et al. 2013; Leiras et al. 2014; Saafer et al. 2014;
3
Özdamar and Ertem 2015) underlining the importance of multicriteria optimization in the disasters relief field. Humanitarian logistics is one important area of focus for multiple criteria. In this research field, cost is not a central criterion but rather other criteria, such as effectiveness, unmet demand, response time, flexibility, reliability and equity, have become more relevant to alleviate human suffering (see Balcik et al. 2008; Campbell et al. 2008; Vitoriano et al. 2011; Ortuño et al. 2011; Huang et al. 2012; Liberatore et al. 2014; Huang et al. 2015). The review of Gutjahr and Nolz (2016) is a complete work on relevant criteria and methodologies for multi-criteria optimization in the field. Other authors have avoided addressing several criteria at the same time through the use of tradeoff functions as the deprivation cost (see Holguín-Veras et al. 2013). Furthermore, important efforts have been made to create risk maps through Geographic Information Systems (GIS) to feed mathematical models with updated information from natural disasters (Coutinho-Rodrigues et al. 2012; Rodríguez-Espíndola and Gaytán 2015; Esmaelian et al. 2015), there are still opportunities to be addressed in their combined use. On the other hand, research has focused on either addressing humanitarian operations like evacuation and inventory management (see Beamon & Kotleba 2006; Huang et al. 2012), distribution operations (see Barbarosoğlu and Arda 2004; Özdamar et al. 2004; Chang et al. 2007; Tzeng et al. 2007; Vitoriano et al. 2011; Liberatore et al. 2014; Garrido et al. 2015) and location of emergency facilities separately or combining only a few of them: - Location of shelters and evacuation operations (see Barbarosoğlu et al. 2002; Sakakibara et al. 2004; Balcik et al. 2008; Coutinho-Rodrigues et al. 2012; Esmaelian et al. 2015). - Location of distribution centers and distribution operations (see Nolz et al. 2010; Mete and Zabinsky 2010; Yushimito et al. 2012; Rodríguez-Espíndola and Gaytán 2015). In summary, there is a lack of an integrated formulation for humanitarian logistics operations to evaluate preparedness during emergencies taking into account future easily-updated operations to be used in the response phase in the following pair of critical days from the disaster aftermath. This gap has been overlooked due to the scarcity of countries that have a unique inter-agency
4
decision maker for coordination, assignment of responsibilities regarding disaster management (see United Nations Development Programme 2014). However, a few exceptions can be found (Chang et al. 2007; Huang et al. 2015; Rodríguez-Espíndola and Gaytán 2015). Chang et al. (2007) focused on simultaneous location of distribution and evacuation facilities, as well as in the intra-zonal distribution and inter-zonal backup. Multiple locations, echelons and levels in the network to ease the decision-making process in the preparedness and response phases of a flood are considered. Flood cases are forecasted/simulated via GIS. The model determines pre-positioning of supplies and vehicles, as well as the flows of material over a transportation network to reach the affected areas at minimum time and cost. Meanwhile, Huang et al. (2015) proposed a dynamic multi-objective optimization model that combines resource allocation with emergency distribution during the response phase. A timespace network is used to incorporate information and decision updates in a rolling horizon approach. The authors used life-saving utility, delay cost and fairness as criteria. Despite considering the dynamism of this complex decision (a feature of the scope of our research), the model does not integrate evacuation and distribution operations or takes advantage of GIS. Finally, Rodríguez-Espíndola and Gaytán (2015) proposed a multi-commodity, multi-modal, multi-criteria model addressing the location of emergency facilities and pre-positioned relief items focused on distribution operations. This approach is initially concerned with the preparedness phase because we address integrally the location of emergency facilities and pre-positioning of humanitarian aid, taking into account the evacuated people and their immediate needs of humanitarian aid among demandsupply pairs in the humanitarian network (see Figure 1). The latter guarantees providing the critical resources in less than 48 hours after a disaster occurs, and avoids causing chaos in the shelters and reduces human suffering. Diverse vehicle types are used to move people or humanitarian aid. Furthermore, additional replenishment operations of humanitarian aid will be repeatedly performed in the period after the first 48 hours.
5
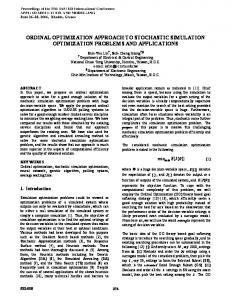
Figure 1. Connections among humanitarian logistics operations and their resources. Figure 2 illustrates our approach in terms of how multiple relief items are carried from open distribution centers to active shelters while the evacuation of the affected population is performed in a two-tiered process from affected areas to shelters (via meeting points). This chart is helpful to understand how humanitarian operations are deployed in the field by the stakeholders. This chart shows the relief operations that are typically performed in case of severe floods and provides a brief scheme of the problem description.
Figure 2. Scheme of humanitarian operations activities included in the model This study partially overlaps Rodríguez-Espíndola and Gaytan’s (2015) work by considering the use of a GIS procedure, distribution of humanitarian aid and location of facilities and a similar
6
solution approach. However, our proposal integrates GIS as the basic tool to create different instances, not only based on different water levels, but also to gain flexibility on integrated evacuation and distribution strategies that a unique decision maker needs to perform in a coordinated way with its diverse active members during emergencies. This work also extends previous approaches to: 1) contemplate two-tiered evacuation operations via meeting points that allow for gaining flexibility, efficiency in the evacuation of nearby affected areas and the effective utilization of vehicles transferring evacuees to shelters; 2) consider road saturation under distinct flood cases to study the impact of road capacity using a congestion multiplier in the chosen humanitarian strategies; 3) take into account availability of vehicles for the humanitarian logistics operations to analyze how scarcity of resources affects both operations of a global humanitarian decision maker (inter-agency group); and 4) minimize a worst-case scenario to evacuate people and distribute relief products respecting evacuation and distribution flow-time under diverse circumstances. 3. Integrated Methodology This research combines the use of GIS with an optimization model for the analysis of frequent flood cases with short response time, underlining the integration of location of emergency facilities together with the allocation of humanitarian operations. The GIS procedure uses public data to simulate flood levels and define remaining road networks, non-isolated candidate facilities and damage in the affected areas. The outcome is used to feed a mathematical programming model able to determine which facilities should be opened, how to evacuate people and how to supply humanitarian aid to open shelters. The model includes time and cost, and a multi-objective programming approach is performed to obtain an approximation to the efficient frontier. To develop this methodology, the following assumptions were made with the stakeholders: i)
Affected areas are classified as in isolated (un-reachable by ground transport) and nonisolated areas to let the stakeholders decide the type of vehicles to be used in the operations;
7
ii)
The GIS procedure is able to determine locations of meeting points (i.e., transfer points) for different flood levels to link isolated areas with the connected network to facilitate evacuation under dynamic conditions (see Esmaelian et al. 2015);
iii) Available resources (i.e., emergency facilities and vehicles) and their capacities, locations and costs are known in advance at every node of the proposed graph; iv) Vehicles belong to different types (i.e., helicopters, buses, trucks, cars and boats), are sufficient for the operations or can be quickly allocated by the unique inter-agency decision maker, regardless if they belong to humanitarian organizations. They can work on specific humanitarian operations and within the chosen operation, these vehicles compete for the same space (i.e., ground vehicles compete for the same road infrastructure); v)
Two types of available budget are considered and allocated in advance as part of an annual financial plan by authorities: Preparation budget is used for conditioning and preparation costs of facilities, while response budget is used for evacuation and distribution operations;
vi) Authorities recognize mainly the use of five types of relief kits: A) food/water, B) drugs, C) personal hygiene items, such as toilet paper, D) cleaning items and E) miscellaneous items, such as linens, fuel and equipment (see Garrido et al. 2015 for further details); and vii) Facilities’ construction costs are mainly considered as structural disaster risk reduction strategies in the mitigation phase of disasters. This stage is left out of the scope of this research, therefore, we do not model these costs. Whereas, we consider that the decision maker must prepare existing buildings as shelters and distribution centers. Thus, we use fixed costs to adapt facilities. These costs rely on a cost of opportunity and a cost depending on the capacity of the facilities (i.e., number of evacuees per shelter or volume of goods per distribution center). 3.1 GIS procedure The topography must be addressed during the choice of potential facilities to reduce flood risk, and the possibility of locating facilities in isolated areas must be carefully considered (see Sakakibara et al. 2004; Chang et al. 2007; Díaz-Delgado and Gaytán 2014). Therefore, an efficient
8
tool, such as a GIS, is needed to perform sensitivity analysis for different highly probable water levels and quickly update information during the emergency.
Use digital elevation model and urban network
Generate layers for potential facilities
Create the altitude reference level for the studied area
Determine water levels to simulate various flood cases
Define flooded and nonflooded areas
Combine flood maps with other layers to identify available facilities/roads and affected areas
Generate a list of eligible facilities and affected areas; obtain shortest time and connectivity via Floyd-Warshall algorithm
Figure 3. Overview of the GIS procedure based on Rodríguez-Espíndola and Gaytán (2015) After applying these steps for multiple flood analyses, decision makers can obtain input data for the mathematical formulation via flood maps (i.e., affected areas), undamaged infrastructure (i.e., roads and eligible facilities), connectivity among facilities and travel time between the locations. Further details can be found in Rodríguez-Espíndola and Gaytán (2015). 3.2 Mathematical programming model The proposed formulation can be interpreted as a multi-commodity, multi-modal, multicriteria location-allocation model that considers, on one hand, the distribution of multiple products from distribution centers to shelters and, on the other hand, the evacuation of people in two tiers: first from affected areas to meeting points and then from meeting points to shelters (see Figure 2). First, this model guarantees the flow of affected people and second, humanitarian aid to shelters to meet demand using multiple vehicles and respecting capacity and availability of resources. The mathematical model uses data from the GIS process to define eligible facilities to perform evacuation and distribution operations. Actually, distribution incorporates connectivity among locations via an adjacency-based matrix to represent the status of the road network.
9
Given that the unique decision maker needs to identify various alternatives, we build an approximation to a Pareto frontier in order to support the final decision. Furthermore, this model is centered on the preparation phase but derives a plan to execute evacuation and distribution operations in the immediate disaster aftermath. Our argument to propose an integral plan is based on the fact that we performed operational planning to respond effectively to a specific forecasted scenario with meteorological and GIS data. As other papers, we gather data from the operations but our contribution stands out in how we treat them integrally to resemble the tasks that a unique, coordinated inter-agency develops on its decision making process. This approach seeks to guarantee closely coordinated humanitarian logistics plans and implementations among various stakeholders (i.e., Non-governmental organizations – NGOs -, army, public and private sector, society) that deploy strategies using their available resources in an efficient way. Part of these resources includes how the national inter-agency group coordinates the availability of vehicles for diverse transportation modes. According to Pedraza-Martinez et al. (2011), the availability of vehicles becomes a critical factor for field vehicle performance, scheduling and routing during the response phase of a disaster. Hence, it is crucial to understand the implications of limited vehicle fleet availability in various modes as we model in constraint (1). Additionally, due to rising flood levels and congestion, road saturation constrains the performance of humanitarian operations (Lambert et al. 2012), especially in highly affected areas and in analyzing worst-case scenario. In our case, this is done for ground vehicles performing the same operation (evacuation first, second tier or distribution).
10
Figure 4. Proposed multi-criteria model with its elements The problem can be visualized as a graph with nodes and arcs denoted by G ,R where is the set of nodes and R is the set of arcs linking (i, j) nodes. Henceforth, the sets will be
described by bold letters, parameters (scalars, vectors and matrices) by lowercase letters and variables by uppercase letters. Figure 4 summarizes the main elements of the formulation. 3.2.1
Sets
According to the graph definition, the set of nodes is defined by D S M A where d ϵ D describes the set of candidate distribution centers, s ϵ S the potential shelters, m ϵ M the eligible meeting points that serve as transshipments points in the network and a ϵ A the affected areas. Other important sets of nodes are the vehicle types v ϵ V and the relief products p ϵ P. Meanwhile, a subset R v determines available arcs for every vehicle v, characterizes feasible distribution paths and describes feasible evacuation paths from affected areas to shelters. Finally, NodTimea m M, v V | evtime1amv max _ time is the set of meeting points that cover affected areas in at most a maximum time (defined by the authorities). These points are idle before a flood occurs but are crucial for easing evacuation operations during the disaster. 3.2.2
Parameters
Parameters of the model, their brief description, units and sources are given below in Table 1. 11
Table 1. Parameters of the optimization model Parameter
arc _ capij
pop a
Description Maximum number of vehicles v that are able to traverse arc (i, j) R v before reaching road saturation Congestion multiplier for the different flood levels. A remaining capacity of 40% in the road network increases the saturation by 300% Population to be evacuated from affected area a
Units
Source
Vehicles / arc or road
Ministry of Transport
-
Inhabitants
max_ time l b _ shel l b _ dc
ngo
ndc capveh _ p v capveh _ t v
cap _ shelps cap _ dcd
avai _ veh v
est _ d p
Maximum time to reach a meeting point from an affected area Minimum percentage of shelter occupancy to avoid additional costs (e.g., staff, equipment) Minimum level of joint usage in distribution centers to avoid additional costs (e.g., staff, equipment) Percentage of vehicles owned by NGOs that supplement authorities’ fleet to carry relief goods to shelters Number of distribution centers to be chosen (8-10 to guarantee feasibility in worst-case scenario) Maximum number of evacuees that can be transported by vehicle type v Maximum number of relief tons that can be carried by vehicle type v Maximum number of evacuees assigned to shelter s Volumetric capacity to store humanitarian aid in distribution center d, which is critical due to the handling of goods such as toilet paper, blankets and other voluminous items Availability of vehicles type v Estimated demand of how many evacuees are served by each kit containing relief products type p
wp
Weight per kit of relief products p
volp
Volume per kit of relief products p
dsv
Connectivity matrix to control trips from d to s with vehicle type v only if geographic paths connecting two points exist Expected evacuation time from affected area a to meeting point m for vehicle v
ev _ time1amv
ev _ time2msv
Predicted evacuation time from meeting point m to shelter s for vehicle v
dis _ timedsv
Supply time estimated from distribution center d to shelter s for vehicle v 12
Minutes
Lambert et al. (2012) method Census per Zip Code Area Defined by authorities
[0,1] Defined by authorities
Distribution centers People / Vehicle Tons / Vehicle People / Shelter m3 / Distribution Center
Databases and protocols
Vehicles
Kilograms / Kit 3 m / Kit
Based on the number of affected people Databases and protocols
-
GIS
Min/Vehicles
GIS via FloydWarshall distance and the average urban speed (km/hr) and varied by
Person / Kit
congestion factor ev _ co1amv ev _ co2msv dis _ co dsv fuel _ co v
pc _ oshels
pc _ omp m
pc _ odcd
pro _ cop pb rb 3.2.3
Evacuation cost from affected area a to meeting point m using vehicle v Evacuation cost from meeting point m to shelter s using vehicle v Transportation cost to supply shelter s from distribution center d using vehicle v Fuel cost per time unit for the vehicle type v, computed multiplying energy consumption (liters/km) by average urban speed (km/hr) Preparation cost to open shelter s linked to the setup cost to receive people (not related to construction) Preparation cost to open meeting point m linked to protecting people during short time periods (not related to construction) Preparation cost to open distribution center d linked to handling goods (not related to construction) Procurement cost for each kit of relief items p
Preparedness budget to locate facilities and preposition supplies in affected areas Response budget to evacuate people and distribute relief items
$ MXP/ Vehicle
Databases and protocols
$ MXP / Min-vehicle
Databases and protocols
$ MXP/ Facility
Databases and protocols
$ MXP/ Kit
Databases and protocols
$ MXP / Year
Defined by authorities
Variables
Decision variables regarding humanitarian operations in the optimization model comprise: Table 2. Decision variables related to humanitarian operations included in the model
SHIP _ EV1amv EV _ PEO1am SHIP _ EV2msv EV _ PEO2ms SHIP _ SUPdsv
QPdsp TQ _ GOVdsv TQ _ NGOdsv
OSHELs ODCd OMPm
Evacuation Number of vehicles type v going from affected area a to meeting point m People transported from affected area a to meeting point m Quantity of vehicles type v moving people from meeting point m to shelter s People transported from meeting point m to shelter s Distribution of humanitarian aid Number of freight vehicles type v going from distribution center d to shelter s Quantity of kits with relief product p shipped from distribution center d to shelter s Tons of humanitarian aid transported by authorities and army in vehicle type v from distribution center d to shelter s Tons of humanitarian aid moved by NGOs in vehicle type v from distribution center d to shelter s Location of emergency facilities (binary variables) 1 if shelter s is open, 0 otherwise 1 if distribution center d is open, 0 otherwise 1 if meeting point m is open, 0 otherwise
13
3.2.4
Constraints
Limit the availability of vehicles for the relief operations (1) a m SHIP_EV1amv + m s SHIP_EV2msv + d s SHIP_SUPdsv avai_veh v
vV
Ensure capacity of vehicles for evacuation operations (2)
v
capveh _ p v SHIP _ EV1amv EV _ PEO1am
a A,m M
(3)
v
capveh _ p v SHIP _ EV2msv EV _ PEO2ms
m M,s S
Guarantee arc capacity in a period only if the facility of origin or destination in the traversed arc is open (4)
SHIP _ SUP
arc _ capds ODCd
(5)
SHIP _ EV1
arc _ capam OMPm
(6)
SHIP _ EV2
dsv
v
amv
v
v
msv
d D,s S
a A,m M
arc _ cap ms OSHELs
m M,s S
Evacuate all the population from each affected area to the meeting points (7)
m
EV _ PEO1am popa
a A
Flow conservation of evacuees at the meeting points (8)
EV _ PEO2 s
ms
a EV _ PEO1am 0 m M
Consider maximum capacity and the number of evacuated people only if shelter s is open (9)
m
EV _ PEO2ms cap _ shelps OSHELs
s S
Ensure a minimum occupancy level in the open shelters (10) lb _ shel cap _ shelps OSHELs m EV _ PEO2ms
s S
Guarantee that at least one meeting point is reachable from each lashed area (11)
mNodTimea
OMPm 1 a A
Meet the demand for kits with relief products for the evacuees
14
(12)
d
QPdsp est _ d p m EV _ PEO2ms
s S,p P
Determine the weight of relief products to be carried by NGOs and/or by authorities (13) ngo p w p QPdsp 1000 v TQ _ NGOdsv
d D,s S
(14) (1 ngo) p w p QPdsp 1000 v TQ _ GOVdsv
d D,s S
Guarantee that tons of relief products carried by all the actors respect the capacity of freight vehicles and transportation meets connection among origins and destinations via available modes (15)
v
capveh _ t v SHIP _ SUPdsv v dsv TQ _ NGOdsv TQ _ GOVdsv d D,s S
Limit the volumetric capacity of distribution centers (16)
vol p
s
p
QPdsp cap _ dcd ODCd
dD
Define the number of distribution centers to be opened (17)
d
ODCd ndc
Minimum usage level of capacity in distribution centers (18) l b _ dc d cap _ dcd ODCd d s p QPdsp Respect preparedness budget for the location of facilities and pre-positioning relief goods
(19)
pc _ odc d
d
s
d
ODCd s pc _ oshels OSHELs m pc _ omp m OMPm
p
pro _ co p QPdsp pb
Consider response budget for evacuation and distribution of humanitarian aid
ev _ co1 (20) ev _ co2 dis _ co a
m
v
amv
fuel _ c v ev _ time1amv SHIP _ EV1amv
m
s
v
msv
fuel _ c v ev _ time2msv SHIP _ EV2msv
dsv
fuel _ c v dis _ timedsv SHIP _ SUPdsv rb
d
s
v
Type of Variables (21) TQ _ GOVdsv , TQ _ NGOdsv 0 d D,s S, v V
(22)
EV _ PEO1am ,SHIP _ EV1amv , EV _ PEO2ms ,SHIP _ EV2msv ,SHIP _ SUPdsv ,QPdsp a A, m M,s S,d D, p P, v V
15
(23) ODCd ,OMPm ,OSHELs 0,1 d D,m M,s S 3.2.5
Criteria
Regarding the criteria, several authors have analyzed the importance of choosing accurate criteria to measure the performance of humanitarian operations. Beamon and Balcik (2008) analyze criteria based on the resource, output performance and flexibility while Huang et al. (2012) consider efficiency, efficacy and equity. Based on various studies, we proposed the use of: 1) Maximum evacuation flow-time (Output performance from Beamon and Balcik 2008 and efficacy from Huang et al. 2012); 2) Maximum distribution flow-time (Output performance from Beamon and Balcik 2008 and efficacy from Huang et al. 2012); and 3) Total cost (Resource performance from Beamon and Balcik 2008 and efficiency from Huang et al. 2012). Furthermore, a minimizing worst-case strategy (i.e., min-max functions) has been chosen to address the flow-time of the operations. According to Campbell et al. (2008), the combination of min-max and min-sum functions guarantees the equity. Therefore, this proposal considers a series of supplementary criteria that guarantee a better performance measurement of the operations for each flood level. Minimizing the maximum evacuation flow-time (24) min z1 1 * max
ev _ time1 a
m
amv
v
SHIP _ EV1amv m s v ev _ time2msv SHIP _ EV2msv
Minimizing the maximum flow-time of humanitarian aid distribution (25) min z 2 1 * max
d
s
v
dis _ timedsv SHIP _ SUPdsv
Minimizing the total cost related to location, pre-positioning, evacuation and distribution
min z3 d pc _ odcd ODCd s pc _ oshels OSHELs m pc _ omp m OMPm (26)
d s p pro _ co p QPdsp a m v ev _ co1amv fuel _ c v ev _ time1amv SHIP _ EV1amv m s v ev _ co2msv fuel _ c v ev _ time2msv SHIP _ EV2msv d s v dis _ codsv fuel _ c v dis _ timedsv SHIP _ SUPdsv
16
Note that min-sum of flow-time is implicitly considered by the criterion (26) and together with min-max functions in the criteria (24)-(25), this model measures equity (Campbell et al. 2008; Huang et al. 2012). To ease the computation, min-max functions in the criteria (24)-(25) are linearized by defining: min , s.t. 1 ,..., n where is the value being minimized in the maximization functions o o 1,..., n , where o refers to the vector of values acquired when evacuation paths in (24) and distribution paths in (25) are evaluated. 3.3 Multi-objective programming model Addressing several criteria at the same time requires specific methodologies of multi-criteria decision making. For humanitarian logistics, in addition to the different criteria that could be proposed, different approaches can be implemented (see Gutjahr and Nolz 2016). In this case, the approach chosen to build the efficient frontier is multi-objective programming. Definition 1. Let be the feasible set of a multi-criteria optimization problem in
n
and
fi x the criterion i evaluated in solution x. Assuming minimization, a solution * is called
Pareto optimum if there is no such that fi fi * i , being one of the inequalities strict. If * is Pareto optimum, then
f , *
1
, f n * is called the efficient point. The set of
all the efficient solutions is called Pareto/efficient frontier in the space of decisions. The set of all the efficient points is called the efficient set in the space of objectives. Because the disaster phase being addressed is preparedness, there is no time limit to compute efficient solutions; consequently, specialized algorithms were not applied (see Mavrotas 2009; Laummans et al. 2006). However, two exact methods were used to build a better efficient frontier (i.e., solution space) and some prioritization of the criteria is possible using the first method. In a first step, the weighted-sum method is applied to solve the proposed multi-criteria model. This method builds an approximate efficient frontier using weighted linear convex combinations of the proposed criteria by formulating: Min u fu , s.t. u 1, u 0 , where u is the u
u
weight of criteria fu and u 1,...,3 . These values are normalized by dividing them by their
17
individual optimum, and weights are variated to obtain the efficient frontier. However, this technique does not guarantee finding all efficient solutions (Koski 1985) because numerically it is solved for a limited set of weights. Thus, in a second step, the application of ε-constraints allows finding other supplementary efficient solutions (Ehrgott 2005) by defining: Min ' f h , s.t. f u u u 1,..., m; u h , where f h is a primary objective function being minimized while other criteria are expressed as
inequality constraints. After the approximation to the efficient frontier is obtained, it can be analyzed by the decision makers. They will use it for estimation purposes and to choose the efficient solution (that is also a comprehensive strategy) that best fits their expectations on the proposed criteria or that best responds to their available resources. 4. Results and Discussion In this section, a description of the case study based on the worst-case flood scenario (i.e., 4meter level) and additional analyses varying parameters such as time, costs and available resources, are introduced together with a discussion of the main findings. Results from a couple of additional flood levels are summarized to describe further insights. However, the worst-case scenario is particularly important for the unique decision maker that must perform effective strategies and avoid being surpassed by any disaster. 4.1 Mexican case study: Floods in Villahermosa in 2007 According to the International Database of Disasters EM-DAT (2016), Mexico is considered one of the most affected countries by natural disasters, especially because hydrometeorological disasters constitute 65% of the total natural disasters in Mexico and have the potential to affect at least 30% of the population that is currently living in areas exposed to this type of disaster. However, Mexican authorities lack access to efficient mechanisms, such as the proposed in this research, to locate emergency facilities and protocols to supply humanitarian aid in a coordinated way (Rodríguez-Espíndola and Gaytán 2015) and to evacuate people efficiently. This case study is based on one of the most severe floods that took place in Villahermosa in 2007 due to intense rain and problems with the “Peñitas” local dam. Villahermosa is a city that 18
belongs to the municipality Centro in the State of Tabasco, Mexico. It has approximately 347,000 inhabitants spread over 62 km2 and with a median age of 27 years old. Villahermosa has been continually hit by floods; however, the flood of 2007 affected 65% of the territory, with water levels reaching four meters, challenging authorities by the magnitude of the humanitarian logistics required in the first couple of days. This disaster affected 1.6 million people and caused economic losses of three billion dollars (CENAPRED 2009; EM-DAT 2016). Given the magnitude, stakeholders’ local capacity was surpassed to manage the emergency; thus the Mexican inter-agency forum for coordination and allocation of responsibilities regarding disaster management called the National Civil Protection System (SINAPROC) was convened to reach agreements on how to attend the disaster (United Nations Development Programme 2014) using highly trained armed forces (i.e., the army and navy) and special staff (e.g., Red Cross). Decision-making and deployment of humanitarian strategies from stakeholders in Villahermosa’s flood are compared with our multi-criteria optimization solutions, that are built from similar data. 4.1.1
Data gathering
The developed model is strongly supported by gathered data via interviews, surveys and access to databases and protocols, or they were computable through our GIS procedure. The data were available beforehand to the authorities but spread over various specialized sources (e.g. Defense Department, Interior Department, Coast and Seas Department, SINAPROC, as well as humanitarian organizations such as the UN, International Red Cross, Caritas, and OXFAM). Therefore, the authorities were able to use data regarding facilities’ and vehicles’ capacities, forecasted demand for different kits with products that must be located rapidly into the shelters to respond to immediate needs and avoid robbery and chaos, expected number of evacuees and proxy cost functions. Unfortunately, authorities did not know how to integrate these elements to make better decisions at that time. Most of the parameters are obtained from the GIS procedure (evacuation and distribution time, connectivity matrix and capacity of emergency facilities). Other parameters are provided by the decision makers (minimum levels of occupancy are fixed at 20%; number of facilities to open;
19
maximum coverage time per meeting point – 20 mins; congestion multiplier depending on the water level; percentage of humanitarian aid carried by NGO vehicles – 22%; preparedness budget - $135.7 Million Mexican Pesos (M MXP) = $8 M US dollars; response budget - 426.2 M MXP = $25.1 M US dollars; and road capacity – 630 vehicles per hour). Others are collected via the inventory of available vehicles (acquired from media, databases and protocols and validated through interviews), the census of immediately affected population (in total 160,352 people from Villahermosa were evacuated), and the physical limitations defined by SINAPROC (vehicle capacity, weight and volume occupied by kits). All the eligible facilities respect international standards and welfare in infrastructure and services (CENAPRED 2009; Sphere Project 2012). Other estimations, such as the demand for products per evacuee, are computed by the government, which creates kits to fulfill the needs of an average family of four. The case of drug kits differs because their content (e.g., vaccines, drugs) is computed by the Ministry of Health for every 100 inhabitants considering the age range and number of people. To conclude, the preparation costs were calculated depending on the number of people or kits in each facility, while the procurement costs for products are defined as market price; evacuation and distribution costs are calculated depending on the opportunity cost to use the vehicle in other activities. Thus, decision makers are “renting” vehicles, and set-up and overhead costs (e.g., maintenance, spare parts) are considered when carrying products or moving people; but no construction costs are linked to the any of the parameters. Furthermore, all the parameters are reliable since they were gotten from protocols and databases that documented the real disaster and they were also validated by stakeholders. The data used for this research were provided by the research group Modelación de la Cadena de Suministro y Sistemas de Transporte (MOSILTRA). The values and estimations used for the parameters in the instances are available upon request to ease the replicability of the tests. 4.1.2
Results of the case study for the worst-case scenario
Flood cases are chosen by Mexican authorities based on critical moments to perform humanitarian operations (CENAPRED 2009). We test our model taking into account a network
20
of 504 nodes, 45,849 arcs (without considering multiple transport modes) and collected information for the case study. For the sake of space, we only present in detail the results from the worst-case flood corresponding to a 4-meter-level scenario but our methodology can consider other cases. The network for this scenario is composed of 109 affected areas, 270 shelters (from 549 eligible locations, such as public buildings, and schools), 111 meeting points (from 150 eligible locations, such as intersections, small spots and temporary stations) and 14 distribution centers (from 22 locations, such as warehouses and public buildings) that are opened. The numbers of affected areas and shelters differ from Rodríguez-Espíndola and Gaytán (2015) due to a higher level of resolution in the areas. This higher resolution procedure let the authors propose 111 meeting points in locations nearby affected areas to leverage the evacuation, eliminate more than 50% of the shelters and around 40% of the eligible distribution centers due to the water level in the flood simulation and maintain a low level of road connectivity. In this study, GIS IDRISI™ from Clark Labs was used for the GIS procedure. Moreover, the weighted-sum and ε-constraint methods were programmed in GAMS™ v22.6 and solved via CPLEX™ v11.0 on an Intel Xeon CPU with 9.75GB of RAM. We obtain an approximate efficient frontier for the case study and another ten test instances that were used for sensitivity analyses. Approximation to the Pareto frontier was obtained using a standard step-size of 1% (that is normalized by dividing every value by its individual optimum) in the weighted-sum method for the three criteria and only use strictly positive weights (e.g., 1 0.01, 2 0.01, 3 0.98 ;
1 0.02, 2 0.01, 3 0.97 ; and so on). This strategy avoids getting weakly efficient solutions, which might be an extreme case if we include the zero as part of the evaluated weights for the criteria. After constructing a set of non-dominated solutions with the latter method, the ε-constraint method is added to seek other non-dominated solutions and to obtain a better approximation of the efficient frontier. The payoff matrix of this problem is shown in Table 3, where rows correspond to the achieved solutions for the considered objective functions from monocriterion optimization, with the main diagonal the ideal point (unreachable) for this problem. The
21
difference in the cost regarding Rodríguez-Espíndola and Gaytán (2015) is mainly derived from the inclusion of preparation costs for the meeting points. Table 3. Payoff matrix for the four-meter water level in the case study
Max. evacuation flow-time Max. distribution flow-time Total cost ($ Million pesos)
Max. Evac. flow-time 48,860 flow-minutes 49,212 flow-minutes 250,656 flow-minutes
Max. Dist. flow-time 9,617 flow-minutes 9,219 flow-minutes 37,121 flow-minutes
Cost $85.643 $82.586 $65.947
A set of non-dominated points is obtained for the four-meter water level flood (Table 4). Table 4. Set of efficient points obtained for the four-meter water level in the case study Efficient solution
Max. Dist. Flow-Time (flow-min) 9,617
Total cost ($M MXP) 85.643
Efficient solution
1
Max. Evac. Flow-Time (flow-min) 48,860
33
Max. Evac. Flow-Time (flow-min) 57,256
Max. Dist. Flow-Time (flow-min) 13,590
Total cost ($M MXP) 66.001
2
49,212
9,219
3
82.586
34
57,720
13,905
66
49,560
4
9,869
80.706
35
57,740
14,049
65.999
5
49,812
10,044
78.337
36
57,912
14,220
65.998
49,960
10,498
75.099
37
58,216
14,590
65.9973
6
50,280
10,624
74.441
38
58,272
14,695
65.9971
7
50,528
10,676
74.21
39
58,312
14,909
65.996
8
50,912
10,757
69.538
40
58,488
15,697
65.995
9
51,048
10,790
67.942
41
58,804
15,992
65.994
10
53,212
10,825
66.131
42
59,420
16,132
65.991
11
53,524
10,861
66.125
43
59,544
16,208
65.9905
12
53,856
10,920
66.108
44
59,612
16,441
65.9904
13
53,860
11,077
66.1
45
59,760
16,711
65.9903
14
53,928
11,133
66.096
46
59,944
16,830
65.9902
15
54,048
11,180
66.092
47
60,064
17,123
65.9901
16
54,712
11,183
66.079
48
60,676
18,062
65.988
17
54,864
11,269
66.064
49
60,892
18,467
65.9873
18
55,152
11,495
66.063
50
62,316
18,578
65.9872
19
55,440
11,743
66.055
51
62,572
18,899
65.984
20
55,448
11,768
66.021
52
63,312
19,438
65.983
21
56,124
11,987
66.015
53
63,856
21,033
65.9814
22
56,184
12,006
66.0146
54
63,916
23,706
65.9812
23
56,188
12,417
66.0145
55
63,996
23,890
65.977
24
56,200
12,728
66.0143
56
64,192
25,906
65.975
25
56,384
12,835
66.0094
57
64,380
26,906
65.973
26
56,416
12,862
66.0093
58
65,004
28,848
65.971
27
56,536
12,886
66.0092
59
65,580
29,160
65.968
28
56,652
13,053
66.005
60
66,044
29,346
65.966
29
56,672
13,354
66.004
61
66,496
29,769
65.965
30
56,768
13,378
66.0034
62
66,668
31,438
65.958
22
31
56,952
13,427
66.0032
32
57,204 63,491
13,456 24,982
66.0031 69.574
Record of facts
63
250,656
37,121
65.947
All these results can provide a wide variety of strategies to the inter-agency decision maker, and their trade-offs should be analyzed carefully to acquire advantages from any criteria regarding available resources and most suitable strategies during the emergency. For example, an increase of 0.9% in the total cost can provide savings of approximately 1.2% for the worst-case scenario in the distribution flow-time and savings of 0.6% for the worst-case scenario in evacuation flowtime when comparing the fifth and the sixth efficient solutions. In general terms from these efficient solutions, the number of shelters maintained by the authorities was 256 with a median occupancy of 85%, while the open meeting points varied from 44 to 103 and the distribution centers varied from 8 to 14 open locations with a median usage of 50%. Evacuation operations consume on average 70% of the available budget, while distribution of humanitarian aid consumes only 10%. Procurement costs constitute on average 5%, and the preparation costs of the facilities consume the remaining 15%. Comparing these efficient solutions results in Table 4 with the actions taken by the authorities during the 2007 Villahermosa floods, it is clear that the set of efficient points dominate this solution in any of the criteria. This finding is not surprising because the authorities were not prepared in advance for a disaster of this magnitude. However, this comparison is useful to show the benefits of using any of the non-dominated solutions. It is worth to mention that authorities agree that solutions achieved with the integrated methodology are creditable. Because efficient solutions are difficult to visualize in a three-dimensional chart, an analysis of every pair of criteria is performed. Due to space constraints, only the approximate efficient frontiers for maximum evacuation flow-time versus total cost and maximum evacuation flowtime versus maximum distribution flow-time are presented in Figure 5 and Figure 6, respectively.
23
Millions
Total Cost ($ MXN)
Approximate efficient frontier Max. Evacuation Flow-Time vs. Total Cost $69.580 $69.560 $69.540 Weighted-sum Eps-constraint Record of facts
$69.520 $69.500 $69.480 $69.460 500.00
550.00
650.00 Hundreds
600.00
Maximum Evacuation Flow-Time (Flow-min)
Hundreds
Maximum Distribution FlowTime (Flow-min)
Figure 5. Approximate efficient frontier for criteria 1 and 3 in the worst-case scenario
Approximate efficient frontier Max. Evacuation Flow-Time vs. Max. Distribution Flow-Time 265.00 245.00 225.00 205.00 185.00 Weighted-sum 165.00 Eps-constraint 145.00 Record of facts 125.00 105.00 Hundreds 85.00 480.00 500.00 520.00 540.00 560.00 580.00 600.00 620.00 640.00 660.00
Maximum Evacuation Flow-Time (Flow-min)
Figure 6. Approximate efficient frontier for criteria 1 and 2 in the worst-case scenario Table 5 shows an example of the partial strategy of the fourth non-dominated solution corresponding to pair (53,928 maximum evacuation flow-mins, $69.511 M MXP) in the space of decisions from Figure 5. This solution uses 256 shelters, 101 meeting points and eight distribution centers. Table 5. Partial humanitarian logistics strategy for an efficient solution (worst-case scenario) Shelter ID
1
2
3-5
6
7-18
19
20
21
22-41
% occupancy
22%
20%
100%
91%
100%
97%
63%
84%
100%
Shelter ID
116
117
118-119
120
121-126
127
128-131
132
133-134
% occupancy
98%
97%
100%
20%
100%
93%
100%
99%
100%
24
Shelter ID
210
211
212
213
214
215-217
218-219
220
221-222
% occupancy
20%
21%
20%
99%
20%
21%
100%
20%
100%
Shelter ID
241
242
243
244
245
246
247
248
249
100%
100%
99%
100%
100%
74%
90%
100%
68%
% occupancy Product kits Quantity
A – Foods/Water
B-Drugs
C-Hygiene items
D – Cleaning items
E- Miscellaneous
40,169
2,448
40,786
40,140
40,175
Helicopter
Truck/bus
Car
Boat
Share of vehicles in distribution:
30%
6%
1%
NA
Distribution center – shelter Share of vehicles in evacuation 1st
70%
39%
49%
95%
0%
50%
39%
NA
tier: Affected area – meeting point Share of vehicles in evacuation 2nd tier: Meeting point - shelter
From the first part of Table 5, the average shelters’ occupation is 89% and the utilization rate of distribution centers is 73%. In the case of evacuation, the solutions also fulfill the predefined authorities’ evacuation time window during floods (less than or equal to 30 mins). Furthermore, evacuation flow-time presents some savings, due to the flexibility to relocate evacuees in various shelters, although the benefits obtained are small (between 2 and 6%). Finally, the maximum distribution flow-time is also improved, giving the opportunity to easily reach larger quantity of shelters via the eight opened distribution centers. Regarding the computational time, efficient solutions are on average acquired in 1.5 hours with a gap (computed regarding the best possible bound) of 5%, and the worst computational time is nine hours due to the combinations and the competitive trade-off between the first two criteria. 4.2 Validation of efficient solutions: Worst-case instance The configuration of the humanitarian operations used by the authorities in the record of facts should be compared with the proposed efficient solutions. Thus, this subsection shows how the authorities attended Villahermosa’s flood in 2007 and presents a brief discussion about the validation of results compared with Table 5 from the fourth non-dominated solution of Figure 5.
25
Table 6. Partial humanitarian logistics strategy deployed by authorities in the record of facts Shelter ID
1
2
3-5
6
7-18
19
20
21
22-41
% occupancy
0%
100%
80%
75%
100%
90%
89%
20%
100%
Shelter ID
116
117
118-119
120
121-126
127
128-131
132
133-134
% occupancy
90%
100%
100%
50%
100%
Shelter ID
210
211
212
213
214
215-217
218-219
220
221-222
% occupancy
20%
40%
20%
80%
20%
20%
20%
20%
100%
Shelter ID
241
242
243
244
245
246
247
248
249
% occupancy
80%
100%
100%
100%
100%
80%
100%
100%
40%
A – Foods/Water
B-Drugs
C-Hygiene items
D – Cleaning items
E- Miscellaneous
38,312
1,623
38,312
38,312
38,312
Product kits Quantity
Share of vehicles in distribution: Distribution center – shelter Share of vehicles in evacuation 1st tier: Affected area – safer location or shelter
0%
100%
100%
Helicopter 25%
Truck/bus 15%
Car 0%
Boat NA
75%
85%
52%
100%
Regarding shelters’ occupation, shows that the median of occupation of our approach is around 90%, while the occupation during the disaster was 76% considering the complete set of shelters. Furthermore, authorities originally used 370 shelters compared with about 250 shelters used by our approach. This fact helps to explain why in Figures 5 and 6 the total cost of any of our efficient solutions are more distant to the record of facts (i.e., implemented solution). The latter also makes evident the improved usage of resources brought by our solutions and the change of the humanitarian network given the fewer number of used facilities. With regard to the humanitarian kits, in average there is a 14% more of the different product types in our approach, particularly in the case of drugs, showing 50% more supply than in the real case. This increase in our analyzed solution is explained by the known large quantity of people (i.e., known demand) that were affected during the disaster. Authorities might not have predicted this huge impact. Furthermore, their lack of resources and centralized data to respond in advance to the disaster, cause them to have huge shortage of drugs and food during the disaster response. Also, 200 helicopter trips delivered around 150 tons of humanitarian aid and a few evacuation trips where used to move sick people directly from flooded to shelters. The difference in the analyzed solution arises because of the use of the land transportation and the existence of meeting 26
100%
points that had not been used by the authorities before this proposal. During the disaster in 2007, authorities sought safer places (e.g., streets) to leave evacuees and continue performing evacuation operations. The usage of helicopters and boats was the most demanded and it was due to the scarce availability of those vehicles. Trucks and buses were completely used and cars helping evacuees were quantified around 52% of the total available quantity. Comparing with the analyzed solution in Table 5, the difference in the usage of cars arises due to the assumed control of authorities to use any kind of vehicle in case of a disaster, the small decrease in the usage of boats is given by the opportunity that population has to evacuate a future affected area before the flood level increases and, consequently the use of other vehicle types as trucks/buses is impacted to move the evacuees to the assigned shelter. Finally, the eight opened distribution centers of analyzed solution save on average 50% of the maximum flow-time criterion (20,200 vs. 51,000 flow-min from the record of facts) and sometimes more than 75% due to their greater proximity and coverage (Yushimito et al. 2012). Despite the lower utilization rate of 73% compared to 91% of the only distribution center used by authorities in 2007, the new distribution network let user minimize undesired effects on lack of equality and reduce worst case. On average 20% of the worst-case distribution flow-time is saved by any of the efficient solutions in relation to the implemented solution by the authorities. 4.3 Discussion about other flood cases respect to the worst-case scenario Previous results are based on the worst-case flood scenario, but our multi-objective model might be applied to optimize other flood cases. By reducing flood level to 1 meter, an increase of 18% in the traveling time is expected in the network due to the congestion caused by road and focal areas’ damage, while by reducing the flood level to 2 meters worsens the traveling time in 83%. Both cases enable larger number of candidate facilities due to lower damage. The 1-meter flood enables 458 candidate shelters, 185 meeting points and 22 distribution centers to attend 72 affected areas. This case resembles a case with higher availability of infrastructure and resources (i.e., facilities, resources) to evacuate around 72,000 people. On the
27
other hand, the 2-meter flood enables 352 candidate shelters, 140 meeting points and 18 distribution centers to evacuate 96 affected areas. Naturally, this case resembles the worst case to evacuate around 133,000 people but having a few more available resources. Table 7 shows the results for the studied cases. In summary, lower the flood level carries higher availability of resources, higher dispersion of facilities and preference for longer, consolidated routes, as well as higher utilization of cars to traverse the less damaged roads. This table allows for understanding how strategies vary depending on the flood level in terms of usage and availability of resources (i.e., vehicles, facilities) and performance (i.e., cost, time). Table 7. Summary of results for diverse flood levels Features\Flood level Availability and dispersion of facilities Average evacuation and distribution times Maximum evacuation time
Maximum distribution time
Transportation Costs Type of strategy for humanitarian operations (evacuation and distribution) Utilization of distribution centers
1-meter
2-meter
4-meter
Higher
Intermediate
Lower
Higher
Intermediate
Lower
Lower due to higher dispersion and availability Higher due to more decentralization in the road network Higher due to few longer routes (more consolidation) Longer routes, high consolidation for a few facilities due to dispersion
Higher due to lower dispersion and availability. Intermediate
Higher due to bigger number of shorter routes and vehicles in the system
Intermediate routes
Intermediate due to larger number of DCs
Utilization of shelters
Intermediate
High
Use of meeting points (MP)
Intermediate
Intermediate
Use of boats
Low
Use of cars
High due to infrastructure availability
Use of helicopters
Intermediate (distribution)
Use of buses and trucks
Intermediate
Intermediate Low between affected areas and MP, intermediate between MP and shelters Intermediate (distribution and evacuation) High
28
Lower due to more centralization in the road network
Shorter routes, high consolidation for multiple facilities due to centralization High Extremely high due to decreasing number of shelters High to guarantee higher utilization of larger vehicles from MP to shelters Extremely high Extremely low between affected areas, intermediate between MP and shelters Extremely high (distribution and evacuation) Extremely high
4.4 Discussion about factor analyses and sensitivity results The case study has been adapted to evaluate the model performance when its variables or assumptions are altered. The consideration of additional instances enables to determine better strategies. Such instances are generated depending on three critical elements: - Geographical dispersion of the facilities (Apte 2010; Esmaelian et al. 2015) because it impacts the quantity of resources, coverage of the facilities and total cost. - The quantity of available resources, since it strongly determines the actions that can be taken in humanitarian logistics and it is related to shortage situations (van Wassenhove 2006). - Variations in cost structure since logistics costs are based on local economic conditions and budget, causing dramatic differences in humanitarian operations (van Wassenhove 2006). With the aim of creating a set of test instances from the previous elements and determining the ability of the model to define useful solutions and operate successfully (i.e., robustness), factor-analysis combinations from scattered or scarce resources, cost variations and other changes in the humanitarian network are considered. Table 8 shows the procedure to create these instances. Table 8. Main characteristics of the analyzed instances
FACILITIES
VEHICLES
GEOGRAPHICAL DISPERSION 20% facilities keep original location + 80% facilities change their location, randomly increasing their distribution and evacuation time in the range [50%, 300%] for shelters, [10%, 150%] for meeting points and [30%, 500%] for distribution centers
AVAILABILITY OF RESOURCES Available shelters are [180, 210] to reduce idle capacity to only 0.5% guaranteeing feasibility Available distribution centers [8,12] because a solution with fewer than eight distribution centers is not feasible Available meeting points [60, 70] to guarantee enough coverage of flooded areas
Location of vehicles in Ciudad Deportiva Stadium, as well as active shelters and distribution centers
Restrict number of cars to remove 40% excess capacity and limit the number of available buses: Buses/trucks [6200, 10000], cars [1,200, 6,634], helicopters [2, 5] and boats [100, 300]
29
VARIATIONS IN COST Remove advantages of economies of scale in larger facilities, increasing costs randomly in [10%, 500%] Vary the procurement costs of the products to be prepositioned in the facilities [10%, 500%] Remove advantages of economies of scale in buses/trucks, increasing costs randomly in [10%, 500%]
From our analyses some general insights can be derived to be used in other floods. Our proposed model shows that the geographical proximity of the distribution centers to the shelters strongly determines the frequency and probability of opening the facilities, since there is a strong link between the use of facilities and vehicles in evacuation and distribution operations. Consequently, any change in the vehicles will have an impact on the facilities’ use. We summarized the main results in Table 9. Table 9 Main insights and tradeoffs from the factor analyses in the worst-case flood
Scarce vehicles and facilities Dispersed facilities Variation in procurement cost Variation in transportation costs Use of helicopters and cars Use of buses and trucks Pre-positioning stock Lower minimum occupancy level Limited (preparedness and response) budget
Utilization rates
Cost
Time
Well-being of the affected people
Higher
Lower
Shorter
Guaranteed
Higher
Higher
Longer
Guaranteed
-
Higher
-
Threatened
Higher
Higher
Longer
Threatened
Higher
Higher
Shorter
Quickly guaranteed
Lower
Longer
Guaranteed
Higher
Shorter
Guaranteed
Lower
Higher
Shorter
Guaranteed
Higher
Lower
Longer
Threatened
Higher (with huge demand variation) Higher (especially in distribution centers)
From table 9 budget is a key parameter determining a balance in the deployment of humanitarian logistics operations and to choose the best strategies regarding variation of the criteria and covered population (Garrido et al. 2015). It is clear that budget variations generate a tradeoff among the strategies to prepare for and respond to the flood considering the supplementary costs of these strategies. This tradeoff compares strategies locating few emergency facilities closer to large affected areas with strategies with more dispersed facilities leading to longer evacuation and distribution routes. 5. Conclusions This research presents a methodology for effectively addressing integrated humanitarian logistic operations in short-term disaster preparedness. The proposed methodology includes a
30
model that considers the location of emergency facilities (e.g., distribution centers, shelters and meeting points), pre-positioning of humanitarian aid, and evacuation and distribution allocation during frequent and predictable floods. The model is supported by Geographical Information System (GIS) and demographic information to develop flood simulation and understand damage in the studied area. These data are used to feed a multi-criteria location-allocation model that guarantees the flow of people from vulnerable areas to shelters and of multiple humanitarian aid kits from distribution centers to shelters using multiple vehicles and taking into account capacity, demand, availability of resources (e.g., vehicles, budget, roads and buildings) and other side constraints. The optimization model is composed of three criteria to minimize i) maximum evacuation flow-time, ii) maximum supply flow-time and iii) total cost. This formulation is solved to build the approximate efficient frontier via weighted-sum method and ε-constraint techniques. With the adoption of these techniques, the unique Mexican inter-agency decision maker is able to identify non-dominated solutions in a reasonable time during the preparedness phase of the second worst Mexican flood. Any of the efficient solutions obtained surpass the authorities’ performance during the real case study, generating average savings of approximately 20% due to better resources’ utilization and more effective strategies. Furthermore, sensitivity analyses for the three key elements—i) spatial distribution of emergency facilities, ii) number of resources and iii) variations in cost structure—are studied to prove the usefulness and robustness of the model’s performance. Flood cases show how to plan and execute humanitarian operations considering fleet management, usage of resources and allocation/routing strategies to guarantee high performance. However, since we focus on solving the case study and related instances using an exact approach; it is possible to extend this study in order to: a) get efficient strategies via heuristic algorithms, b) address uncertainty, and c) incorporate location-routing formulations. Acknowledgments Authors are grateful with three anonymous referees and the editorial team for their insightful comments that improve this paper. This research has been partially supported by the Government of Madrid, grant
31
S2013/ICE-2845 (CASI-CAM), by the Spanish Government grants MTM2015-65803-R, ECO201347129-C4-2-R and ECO2016-76567-C4-4-R, by the Regional Government of Andalusia SEJ 417; and by the Government of Mexico, grant PROMEP/103.5/12/4586. We are thankful to our colleagues and friends for their insightful recommendations. In memory of Dr. S. Rueda-Cerna (RIP 2012) and Maxi (RIP 2016).
References AON BENFIELD, 2016. Impact forecasting: February 2016 global catastrophe recap. Available from:
http://thoughtleadership.aonbenfield.com/Documents/20160308-ab-analytics-if-february-
global-recap.pdf. [14 March 2016]. Apte, A., 2009. Humanitarian Logistics: A new field of research and action, foundations and trends. Technol., Inf. and Oper. Manag. 3, 1, 1-100. Balcik, B., Beamon, B. M., Smilowitz, K., 2008. Last mile distribution in humanitarian relief. J. Intell. Transport. S. 12, 2, 51–63. Barbarosoğlu, G., Özdamar, L., Çevik, A., 2002. An interactive approach for hierarchical analysis of helicopter logistics in disaster relief operations. Eur. J. Oper. Res. 140, 118 – 133. Barbarosoğlu, G., Arda, Y., 2004. A two-stage stochastic programming framework for transportation planning in disaster response. J. Oper. Res. Soc. 55, 1, 43–53. Beamon, B.M., Kotleba, S.A., 2006. Inventory management support systems for emergency humanitarian relief operations in South Sudan. Int. J. Logist. Manag. 17, 2, 187-212. Beamon, B.M., Balcik, B., 2008. Performance measurements in humanitarian relief chains. Int. J. of Pub. S. Manag. 21, 1, 4-25. Campbell, A. M., Vandenbussche, D., Hermann, W., 2008. Routing for relief efforts. Transport. Sci. 42, 2, 127-145. Centro Nacional de Prevención de Desastres (CENAPRED), 2009. Social and economic impact of disasters in Mexico: Characteristics and economic impact of the main disasters ocurred in Mexico during 2008. Sistema Nacional de Protección Civil, México. Chang, M.S., Tseng, Y.L., Chen, J.W., 2007. A scenario planning approach for the flood emergency logistics preparation problem under uncertainty. Transp. Res. Part E 43, 6, 737 – 754. Coutinho-Rodrigues, J., Tralhão, L., Alçada-Almeida, L., 2012. Solving a location-routing problem with a multiobjective approach: the design of urban evacuation plans. J. Transp. Geogr. 22, 206–218. Díaz-Delgado, C., Gaytán, J., 2014. Flood Risk Assessment in Humanitarian Logistics Process Design. J. Appl. Res. Technol. 12, 5, 976 – 984. Ehrgott, M., 2005. Multicriteria Optimization. Springer, Berlin, Heidelberg. Esmaelian, M., Tavana, M., Santos-Arteaga, F.J., Mohammadi, S., 2015. A multicriteria spatial decision support system for solving emergency service station location problems, Int. J. Geogr. Inf. Sci. 29, 7, 1187-1213.
32
Garrido, R.A., Lamas, P., Pino, F.J., 2015. A stochastic programming approach for floods emergency logistics. Transp. Res. Part E 75, 18-31. Gutjhar, W., Nolz, P., 2016. Multicriteria optimization in humanitarian aid. Eur. J. Oper. Res. 252, 2, 351-366. Holguín-Veras, J., Pérez, N., Jaller, M., Van Wassenhove, L.N., Aros-Vera, F., 2013. On the appropriate objective function for post-disaster humanitarian logistics models. J. Oper. Manag. 31, 262–280. Huang, M., Smilowitz, K., Balcik, B., 2012. Models for relief routing: Equity, efficiency and efficacy. Transp. Res. Part E 48, 2-18. Huang, K., Jiang, Y., Yuan, Y., Zhao, L., 2015. Modeling multiple humanitarian objectives in emergency response to large-scale disasters. Transp. Res. Part E 75, 1-17. International Database of disasters EM-DAT 2016. Interactive graphs on disaster trends. Available from: http://www.emdat.be/disaster_trends/index.html. [14 March 2016]. Koski, J., 1985. Defectiveness of weighting method in multicriterion optimization of structures. Commun. appl. numer. methods 1, 6, 333-337. Lambert, J.H., Parlak, A.I., Zhoub, Q., Miller, J.S., Fontainec, M.D., Guterbock, T.M., Clement, J.L., Thekdi, S.A., 2013. Understanding and managing disaster evacuation on a transportation network, Accident Anal. Prev. 50, 645-658. Laummans, M., Thiele, L., Zitzler, E., 2006. An efficient, adaptive parameter variation scheme for metaheuristics based on the epsilon-constraint method. Eur. J. Oper. Res. 169, 932 - 942. Leiras, A., Brito, I., Peres, E.Q., Bertazzo, T.R., Yoshizaki, H.T.Y., 2014. Literature review of humanitarian logistics research: trends and challenges. J. Human. Logist. Supply Chain Manag. 4, 1, 95 - 130 Liberatore, F., Pizarro, C., Blas, C., Ortuño, M., Vitoriano, B., 2013. Uncertainty in humanitarian logistics for disaster management: a review. In Vitoriano, B., Montero, J., Ruan, D. (Eds) Decision Aid Models for Disaster Management and Emergencies, Atlantis Computational Intelligence Systems, Vol. 7. Atlantis Press, Paris, pp. 45–74 Liberatore, F., Ortuño, M.T., Tirado, G., Vitoriano, B., Scaparra, M.P., 2014. A hierarchical compromise model for the joint optimization of recovery operations and distribution of emergency goods in humanitarian logistics. Comput. Oper. Res. 42, 3–13. Mavrotas, G., 2009. Effective implementation of the 𝜀-constraint method in Multi-Objective Mathematical Programming problems. Appl. Math. Comput. 213, 455–465. Mete, H.O., Zabinsky, Z.B., 2010. Stochastic optimization of medical supply location and distribution in disaster management. Int. J. Prod. Econ. 126, 1, 76–84. Nolz, P.C., Doerner, K.F., Gutjahr, W.J., Hartl, R.F., 2010. A biobjective metaheuristic for disaster relief operation planning”. In Coello Coello, C. A., Dhaenes, C., Jourdan, L. (Eds.) Advances in Multi-
33
Objective Nature Inspired Computing, Studies in Computational Intelligence. Springer, Berlin, pp. 157-177. Ortuño, M.T., Tirado, G.,Vitoriano, B. 2011. A lexicographical goal programming based decision support system for logistics of Humanitarian Aid. TOP 19, 464-479. Ortuño, M.T., Cristóbal, P., Ferrer, J.M., Martín-Campo, F.J., Muñoz, S., Tirado, G., Vitoriano, B., 2013. Decision aid models and systems for humanitarian logistics. A survey. In Vitoriano, B., Montero, J., Ruan, D. (Eds.). Decision Aid Models for Disaster Management and Emergencies, Vol. 7. Atlantis Press, Paris, pp. 17-44. Özdamar, L., Ekinci, E., Küçükyazici, B., 2004. Emergency logistics planning in natural disasters, Ann. Oper. Res. 129, 217–245. Özdamar, L., Ertem, M.A., 2015. Models, solutions and enabling technologies in humanitarian logistics. Eur. J. Oper. Res. 244, 1, 55-65. Pedraza-Martinez, A.J., Stapleton, O., van Wassenhove, L.N., 2011. Field vehicle fleet management in humanitarian operations: A case-based approach. J. Oper. Manag. 29, 5, 404-421 Rodríguez-Espíndola, O., Gaytán, J., 2015. Scenario-based preparedness plan for floods. Nat. Hazard 76, 1241–1262. Saafer, M., Anbuudayasankar, S.P., Balkumar, K., Ganesh, K., 2014. Analyzing transportation and distribution in emergency humanitarian logistics. Procedia Eng. 97, 2248 – 2258. Sakakibara, H., Kajitani, Y., Okada, N., 2004. Road network robustness for avoiding functional isolation in disasters. J. Transp. Eng.-ASCE 130, 560–567. Sphere Project, 2012. The Sphere Handbook: Humanitarian charter and minimum standards in humanitarian response. The Sphere Project, Geneva. Tomasini, R., van Wassenhove, L., 2009. Humanitarian Logistics. Macmillan Business, London. Tzeng, G.H., Cheng, H.J., Huang, T.D., 2007. Multiobjective optimal planning for designing relief delivery systems. Transp. Res. Part E 43, 673–686. United Nations Development Programme (UNDP), 2014. Mexico: Country Case Study: How Law and Regulation Support Disaster Risk Reduction. Available from: http://www.undp.org/. [14 March 2016]. van Wassenhove, L., 2006. Humanitarian aid logistics: Supply chain management in high gear. J. Oper. Res. Soc. 57, 475-489. Vitoriano, B., Ortuño, M. T., Tirado, G., Montero, J., 2011. A Multicriteria optimization model for humanitarian aid distribution. J. Global Optim. 51, 2, 189-208. Yushimito, W., Jaller, M., Ukkusuri, S. 2012. A Voronoi-based heuristic algorithm for locating distribution centers in disasters. Netw. Spat. Econ. 12, 1, 21–39.
34