Currently, the Internet hosting platforms experience an ever growing amount of .... tional share may be a good estimation; nevertheless, workload evolution at bin ...
Multi-model prediction for enhancing content locality in elastic server infrastructures Juan M. Tirado, Daniel Higuero, Florin Isaila, Jesus Carretero Computer Architecture and Technology Area, Universidad Carlos III Madrid, Spain {jtirado, dhiguero, florin, jcarrete}@arcos.inf.uc3m.es
Abstract— Infrastructures serving on-line applications experience dynamic workload variations depending on diverse factors such as popularity, marketing, periodic patterns, fads, trends, events, etc. Some predictable factors such as trends, periodicity or scheduled events allow for proactive resource provisioning in order to meet fluctuations in workloads. However, proactive resource provisioning requires prediction models forecasting future workload patterns. This paper proposes a multi-model prediction approach, in which data are grouped into bins based on content locality, and an autoregressive prediction model is assigned to each localitypreserving bin. The prediction models are shown to be identified and fitted in a computationally efficient way. We demonstrate experimentally that our multi-model approach improves locality over the uni-model approach, while achieving efficient resource provisioning and preserving a high resource utilization and load balance.
I. I NTRODUCTION Currently, the Internet hosting platforms experience an ever growing amount of stored data and traffic due to the increasing popularity of Web 2.0 applications including social networks, multimedia and mashups. In many cases, the workload on these platforms shows a high dynamic variability depending on seasonal factors, trends or exceptional events [1]. In general, predicting high workload variations is a known difficult problem, and the safest approach is to substantially overprovision resources. The standard approach of capacity planning is to overprovision resources for the double of the expected peak load [2]. However, this cost can be substantially reduced by elastically provisioning the resources based on both long-term and short-term predictions. Long-term prediction addresses seasonal patterns or sustained trends by estimating the infrastructure needs at hour or day granularity. Short-term prediction allows for agile scalability at minute granularity in the case sudden unexpected workload surges such as flash crowds. In a previous paper [3], we have presented an elastic Web infrastructure that adapts to workload variations by dynamically scaling up and down servers. The workload is predicted by an autoregressive model capturing trends and seasonal patterns. Further, for enhancing data locality, we proposed a predictive data grouping based on the history of content accesses of a user community. Finally, in order to facilitate agile elasticity, we presented a data placement based on workload and access pattern prediction.
Nevertheless, the long-term prediction model (at day granularity) can be complemented by a short-term prediction model, which should further improve the infrastructure utilization at a lower granularity of time (minutes instead of days) and data (bins instead of aggregate workload). The contributions of this paper are based on extending our previous work in the following directions. First, we propose a multi-model approach, in which each prediction model is applied on locality-preserving data subsets. This approach has two main advantages: (a) reduces the variability of locality (b) allows to detect workload changes at a finer level. In the previous work, the model was applied for the whole workload and calibrated to data sets through popularity-based scaling factors. Second, the paper proposes a methodology for automatic generation of autoregressive models in a tractable manner [4]. Third, the proposed models are applied for shorttime prediction, i.e. at minute granularity. Fourth, we experimentally demonstrate that: (a) the methodology is computationally efficient (b) the models predict workload changes with high accuracy (c) the multi-model approach substantially increases the content locality of Web servers, while achieving similar resource utilization and load balance as the uni-model scenario. The remainder of this paper is organized as follows. Section II presents a system overview. Section III discusses workload modeling and prediction methodology. The data set employed in our evaluations is described in Section IV. The experimental results are the subject of Section V. Section VI discusses related work. Finally, we conclude in Section VII. II. S YSTEM
OVERVIEW
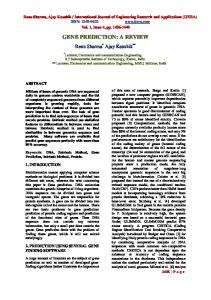
This section gives a system overview as follows. First, Section II-A presents the system architecture. Second, data groping and data placement methods are outlined in Section IIB. Finally, Section II-C discusses the load prediction and motivates a multi-model prediction approach. A. System architecture The methodology presented in this paper is applied to a typical Internet service architecture organized in three tiers, as shown in Figure 1: dispatcher layer, web server layer and storage layer. A dispatcher layer consisting of a variable number of servers receives requests for storage objects from the users. The dispatcher distributes user requests to Web servers.
The model was manually identified after the analysis of the autocorrelation (ACF) and partial autocorrelation (PACF) functions as ARM A(1, 0) × (1, 1)7 . The fitted model was shown to achieve a high precision in forecasting workload evolution of LastFM at day granularity, an on-line music portal with social network capabilities. As explained earlier, the storage objects are assigned to bins. The prediction for each individual bin ˜l(t + 1) was done as a proportional share of the total predicted workload. The proportion was computed as the ratio between observed bin load l(t) and aggregated load L(t) as shown in the Equation 1. Fig. 1.
Multiple tier Internet service architecture.
The Web servers receive and serve the requests forwarded by the dispatchers. We make the simplifying assumption that Web servers include the application logic. The Web servers are stateful [5], that is they retrieve application data on-demand from the storage back-ends and they cache them locally [6]. Consequently, popular items are likely to be cached on the Web servers. Finally, objects are persistently stored on the back-end storage. A system controller is in charge of running the load prediction model, data grouping and data placement algorithms, updating the request distribution parameters on the dispatcher and switching Web servers on and off depending on load. B. Data grouping and placement The main objectives of the solution presented in [3] are increasing content locality, high server utilization and energy efficiency at the Web server level. The solution assumes that each storage object is assigned a category. The content locality is optimized by forming bins grouping together storage objects with a high probability of being accessed together inside a time window. The high system utilization is increased by assigning bins to Web servers based on the aggregated predicted workload. The energy efficiency is addressed based on maximizing the average Web server utilization and turning off and on Web servers according to aggregate workload prediction. More precisely, the assignment of objects to bins (data grouping) is based on a locality threshold (thrC ). The locality threshold is a lower bound on the number of object categories that can be grouped in a bin. The categories are assigned to bins based on content affinity, which is a metric capturing the probability of accessing an object from one category after accessing an object from another category [7]. The assignment of bins to servers (data placement) is done with the goal of not surpassing an upper bound on utilization, which is called load threshold (thrL ). C. Prediction ˜ + 1) In our previous work [3], a single prediction L(t at time t + 1 was done for the aggregated workload based on an autoregressive moving average model (ARMA model).
˜l(t + 1) = l(t) × L(t ˜ + 1) L(t)
(1)
This approach has the advantage of simplicity and has been shown to work well with the autoregressive model discussed above when predicting at day granularity. However, there are several improvements which can be addressed. First, a proportional share may be a good estimation; nevertheless, workload evolution at bin level may be lost in the total workload signal. This fact prevents detecting workload fluctuations at bin level, for instance due to flash crowds or trends in popularity. Second, a prediction model at bin granularity can be used as a valuable input of a dynamic replication strategy based on workload evolution of subsets of data. Third, a bin-level model permits improving the access locality, by a more suitable cache allocation policy depending on bin workload. Fourth, volume spikes might surge within minutes, therefore it is necessary to define models at minute granularity in order to be able to react fast in case of special workload events. Fifth, working at a lower granularity of bin (data granularity) and minute (time granularity) allows for building more accurate prediction models. One important advantage is that more accurate models can be used to improve the average server utilization and to reduce the dynamic data movement between servers and storage due to mispredictions. The advantages presented above have to be accompanied by low cost of model building and a small overhead of managing several models. III. M ODELING
AND PREDICTION
The typical methodology of building and applying time series models to prediction consists of the following steps: (i) select a model (ii) fit the model (iii) generate the prediction, (iv) record the observation (v) estimate the prediction errors. The model can be refitted after every observation, periodically, or when the prediction errors indicate the inaccuracy of the model. In particular, in this work, we apply autoregressive models to short-term prediction with the following goals. • Automatic model selection. Autoregressive models are traditionally selected by observing the distribution of the autocorrelation (ACF) and partial autocorrelation (PACF) coefficients [8]. However, this method is impractical, due to the fact that it is not automatic and may require expert
•
•
knowledge for decision making. Our goal is to offer a solution that does not require expert intervention in the process of choosing the most adequate model. Handling short time fluctuations by automatic model refitting and model changing. The solution must be able to respond to unexpected changes in workload patterns by first refitting the model. If the prediction quality falls outside a desired accuracy, a new model has to be automatically selected. Computational efficiency. Both model fitting and model selection have to be computationally efficient in order to allow for agile resource provisioning based on evolving workloads.
A. Automatic generation of prediction models The main goal of autoregressive models [8] is to predict future values of a time series based on current and past values. For a time series xt , t = 1, 2, ..., of mean 0 (if the time series to be modeled zt has a non-zero mean µ, define xt as xt = zt −µ), an autoregressive model of order p, abbreviated AR(p), can be written in the following form: xt = φ1 xt−1 + φ2 xt−2 + ... + φp xt−p + wt
(2)
where φ1 , ..., φp are parameters of the model and wt is a Gaussian white noise series of mean zero. By using the backshift operator B defined as: B k xt = xt−k
(3)
Equation 2 can be rewritten as: (1 − φ1 B − φ2 B 2 ... − φp B p )xt = wt
(4)
or more compactly as: φ(B)xt = wt
(5)
φ(B) = 1 − φ1 B − φ2 B 2 ... − φp B p
(6)
where
where φ(B) is the autoregressive operator. For large values of p, using an AR(p) model with lots of parameters might become unpractical for prediction. Additionally, some studies [9] found that the use of a subset autoregressive models could increase the accuracy of the shortterm forecasting task within time-series models. A typical subset autoregressive model of AR(p) is obtained by taking a subset of the parameters φ1 , ..., φp of the model: φi1 , φi1 , ..., φim , where 0 ≤ i1 ≤ i2 ≤ ... ≤ im ≤ p. Such a subset autoregressive model is denoted ARp(i1 , ..., im ). The smaller the subset (m), the more compact the model and the faster the prediction. However, identifying the most appropriate values of p, m and the model weights may require a large computational effort, which increases with the size of the data set used for building the model. In order to address this issue, McLeod and
Zhang [4] propose and demonstrate the properties of a subset autoregressive model denoted ARz(i1 , ..., im ). ARz employs in the calculation of parameters φi the partial autocorrelation functions at lag i = 1, ..., p, denoted ζi . The most important characteristics of their model is the efficiency in identifying the model and fitting the model. In this paper, we focus on the efficiency of two operations: (1) Automatically selecting an autoregressive model, which most accurately characterizes the time series. Identifying a model is equivalent to the identification of the values of p and m. (2) Fitting the selected autoregressive model. Fitting a model is equivalent to the calculation of model weights. Both these operations are efficiently supported by the methodology proposed by McLeod and Zhang [10]. This methodology includes functions for generating various AR, ARp and ARz models, selecting the most accurate one according to various statistical information criteria and fitting the selected models. In the experimental section we provide an evaluation of model identifying and fitting, in order to demonstrate that these operations are computational tractable. In the remainder of the paper, we abstract away the type of the autoregressive model employed for our purpose. In this paper, we propose two different scenarios for the generation and utilization of models. In the first scenario (called uni-model) we use a single model for predicting the total workload of the system. This workload prediction is subsequently distributed over all bins based on current load as in Equation 1. In the second scenario (called multi-model) a model is selected for each bin. In both cases, the McLeod and Zhang algorithm requires as input only the corresponding time series to be modeled and it generates and fits the model. B. Prediction Given a fitted model, the prediction and the confidence interval are computed for a time horizon of h points (a point is a minute in our evaluations). At every point, the observed value is recorded and compared against the predicted value. When an observed value falls outside the confidence interval, we consider three possible cases: we might be in the presence of (a) an isolated outlier (b) a short-term change (c) a durable change. After each h points we investigate how many of them are outliers. For more than one outlier, a new model fit Mnew is computed without discarding the previous fit Mold . Not discarding the previous fit addresses the case in which we are in the presence of a short-term change. Both model fits are kept around for a configurable time window in which the observed values are compared against the predicted values. Following cases may occur: (1) The new model fit predicts better than the old one. In this case the old model fit is discarded and the new model fit is adopted. This might be an indication of durable change. (2) The prediction of the old model starts again to be accurate. In this case, the new model is discarded and the prediction continues with the old model. This might happen for particular events without durable consequences on the workload. (3) None of the models predict accurately. In
6000000
this case a new model has to be identified and fitted and this is done by the McLeod and Zhang algorithm.
V. E XPERIMENTAL RESULTS This section about experimental results is structured in the following way. First, in order to demonstrate the suitability of our approach for short-time resource provisioning, we present the evaluation of the automatic model identification and model fitting in Section V-A. Second, the accuracy of model prediction is analyzed in Section V-B. Third, Section V-C compares the multi-model and uni-model approaches in terms of locality. Fourth, we compare the server provisioning for uni-model and multi-model approaches with the optimal provisioning in Section V-D. Fifth, Section V-E shows that the improvement
Playcount
5000000 4500000 0
20
40
60
80
100
120
140
Day
Total play count in the system.
0.06 0.05 0.04 0.03 0.02
Fraction incoming users
0.07
Fig. 2.
0.01
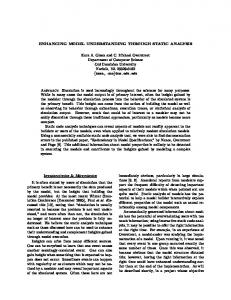
The evaluation from this paper is based on a data set extracted from LastFM web. This data set has been described in more detail in our previous work [3], [11]. LastFM is one of the largest music portals with social networking features. Labels and authors can freely share music on the portal. Users can listen to radio stations or to previews in either full-length or as 30 second samples. LastFM records play counts on a daily base in order to generate charts for artists and tracks. Our trace contains the profiles of a set of 250,000 users including the listened artists, daily for the period between January 1st to May 22nd , 2009 (142 days). The total number of artists users listened to was 2,390,970, amounting to a total play count of 780,579,318. Figure 2 shows the load evolution for the 142 days of our trace. The first trace days correspond to the beginning of the year (starting January 1st ) and this is the reason for the lower system load. A limitation of the trace is the fact that we can reconstruct only the aggregate daily load of the system. Therefore, the trace does not contain load variation at minute and hour granularities. Based on the trace at day granularity in our previous work we have shown that predictive data grouping and data placement allows to increase the load balance and server utilization. However, an additional improvement can be achieved by a lower granularity of minutes, as in practice resources such as virtual machines can be provisioned or unprovisioned in terms of minutes. In order to synthetically extend our trace at minute granularity we leverage patterns of workload observed for other traces. In particular Gill et al. [12] plotted the hourly patterns of video accesses of a large community of YouTube users as shown in Figure 3. We synthetically model the hourly LastFM accesses based on the probability distribution of YouTube accesses. This pattern has also been observed in other applications such as social networks [13], [14] or the Wikipedia [15]. While this distribution is particular for YouTube (video sharing), we understand that the shape is representative for several workloads, and we apply it in our study. Inside each hour, we consider a Poisson distribution of user arrivals at minute granularity.
5500000
IV. DATA S ET
0
4
8
12
16
20
23
Hour
Fig. 3.
Probability of user arrivals based on [12]
in locality of the multi-model approach is achieved without hurting the load balance and server utilization. A. Model identifying and fitting This subsection presents the results of evaluating the times required to identify the autoregressive model and the time to fit the model. All the measurements presented in this subsection were performed on an AMD Athlon 3000+ 2GHZ machine with 512 KB L2 cache and 3 GB RAM. Figure 4 shows the execution time for selecting and fitting an autoregressive model for different number of input observations ranging from 1 day (1440 observations per day, i.e. one observation per minute) to 14 days (14 x 1440 = 20,160 observations). We notice that in all cases the selection of a model is done approximatively in between 2.5 and 3.7 seconds, while the fitting of a selected model approximatively in between 0.9 and 2 seconds. These times represent a relatively small overhead, when compared to the expected times to provision resources such as virtual machines in the current infrastructures which may take around minutes.
3.5
Model selection Model fit
2.0
2.5
3.0
C. Content locality
1.0
1.5
Elapsed time in seconds
obvious that there is a tradeoff between the number of bins and the scalability of the proposed solution, which we plan to address in our future work.
1
2
3
4
5
6
7
8
9
10
11
12
13
14
Number of observed days
Fig. 4. Times for automatic model selection and fitting for different number of input observations. The number of observations is one per minute, i.e. 1440 observations per day.
B. Prediction accuracy In this experiment, we estimate the prediction accuracy of our approach for the data set described in Section IV. The locality threshold was thrC = 14 (average number of categories accessed by a user in one day) and the prediction time horizon was h = 5. The affinity algorithm described in [3] partitions the data set into two bins, targeting to find a tradeoff between locality and server utilization. We identified the corresponding models for two cases: (1) uni-model, i.e. one model for the whole data set (2) multi-model, i.e. one model per bin. We estimate the accuracy of the models based on two common metrics: root mean squared error (RMSE) and medium average error (MAE). For the uni-model RMSE is 0.09, while MAE is -0.55. For the multi-model we get for the data group 1 a RMSE of 0.07 and a MAE of -0.654 and for the data group 2 a RMSE of 0.056 and MAE of -0.53. This low values show that the identified and fitted models predict well the trace evolution. In order to have a visual image of the prediction quality, Figures 5 and 6 show a fragment of the trace including predicted and observed values at three different scales: two days, eight hours and two hours. The prediction is represented as a step function. This function is computed by taking the maximum of predicted values inside each time horizon h = 5 and empirically determining a factor that should allow the prediction to represent an upper bound on the observed load. In our case the factor was 5%. As it can be noticed, the step function accurately follows the observed values in large majority of the cases. This property can be used for an efficient placement of bins to servers and offers an accurate mechanism for a short-term provisioning of resources for achieving high resource utilization and load balancing. While in this section, we have evaluated the prediction accuracy for two bins, the compute times for model identification and model fitting shown in Figure 4 indicate that the approach can potentially scale with the number of bins. However, it is
In this section we target to verify our hypothesis that the multi-model approach might provide a higher content locality than the uni-model approach. In this experiment the bins are placed on Web servers targeting an utilization threshold thrL = 0.5. We consider that each server has a LRU cache of 64 GB, i.e. fitting 16,000 songs. The trace is played in the system for the two approaches: (1) uni-model and (2) multi-model. For each server we count the number of cache misses and calculate the miss rate for the whole trace. Figure 7 displays the Cumulative Distribution Function (CDF) of the miss rate for uni-model and multimodel cases. The CDF clearly shows that a multi-model causes a better placement of content on the servers, as the workload modeling at a lower granularity allows for more accurate prediction at bin level. On average, the miss rate for multimodel is 34%, while the miss rate for uni-model is 49%. In summary, the multi-model approach improves the content locality by 15% when compared with uni-model in terms of miss rate. D. Server provisioning In this section, we evaluate the daily number of servers necessary for providing workload service for the whole trace duration and compare it with the optimal value. For a given utilization threshold thrL , the optimal number of servers can be calculated by: � � Li (7) optimalthrL,i = thrL where Li is the total number of requests in the system at time i. We can define the efficiency of server provisioning in terms of closeness to the optimum: ei =
numServersi − optimalthrL ,i numServersi
(8)
where numServersi is the number of servers needed by a solution. Values greater than zero represent over-provisioning of servers, lower than zero under-provisioning of servers, while 0 corresponds to the optimum value. Figures 8 and 9 show histograms representing ei for values lower, equal and greater than 0 respectively, for thrL = 0.5 and 0.9. Single model and multi-model configurations show a similar behavior. In more than 70% of the cases, both uni-model and multi-model offer an optimal provisioning of servers. This number increases with thrL . Under-provisioning occurs in less than 10% of the cases, while over-provisioning in less than 20% of the cases. These figures show that both uni-model and multi-model solutions are able to adapt the number of servers to the incoming workload depending on the prediction in a close to optimal manner.
1200 800
1000
Observed requests Predicted requests
200
500
400
600
Requests
1500 1000
Requests
2000
Observed requests Predicted requests
44500
45000
45500
46000
46500
47000
44500
45000
45500
Time
(a) 48 hours (time scale in minutes).
46500
47000
(a) 48 hours (time scale in minutes).
Observed requests Predicted requests
600
400
600
1000
Requests
1200
800
1400
1600
Observed requests Predicted requests
800
Requests
46000 Time
44400
44500
44600
44700
44800
44400
44500
44600
Time
(b) 8 hours (time scale in minutes).
44800
(b) 8 hours (time scale in minutes).
950
Observed requests Predicted requests
750
1200
800
850
1400
Requests
1500
900
1600
Observed requests Predicted requests
1300
Requests
44700 Time
44400
44420
44440
44460
44480
44500
44520
Time
44400
44420
44440
44460
44480
44500
44520
Time
(c) 2 hours (time scale in minutes).
(c) 2 hours (time scale in minutes).
Fig. 5. Trace fragment including predicted and observed number of request for bin 1 when using multi-model.
Fig. 6. Trace fragment including predicted and observed number of request for bin 2 when using multi-model.
Probability
0.0
0.2
0.4
0.6
0.8
1.0
1.0 0.8 0.6 CDF 0.4 0.2
-2
-1
0
0.0 0.2
0.3
0.4
0.5
0.6
0.7
0.8
1
2
3
Error
Multi-Model Uni-Model
(a) Uni-model configuration
0.9
1.0
Miss rate
Miss rate CDF for multi-model and uni-model approaches.
0.6 0.4 0.2
-2
-1
0
1
2
3
Error
(b) Multi-model configuration Fig. 8.
Server provisioning efficiency for thrL = 0.5
1.0
This section evaluates the server utilization and load balance achieved by multi-model and uni-model approaches. The server utilization is the ratio between the current number of requests and the maximum number of requests that can be served. Figure 10 shows the average server utilization for thrL = 0.5, 0.6, 0.7, 0.8, 0.9. First, notice that the average utilization of the machines is close to the target of thrL in all cases. Second, the standard deviation bars indicate that both solutions obtain a good load balance in all cases. Additionally, the probability of a server overload (more than 100% load) is practically zero.
0.0
E. Server utilization and load balance.
Probability
0.8
Fig. 7.
0.6 0.4 0.2 0.0
-2
-1
0
1
2
Error
0.6 0.4 0.2
Probability
0.8
1.0
(a) Uni-model configuration
0.0
Time series analysis has been used in domains as diverse as social sciences, economy, finance, medicine, physical and environmental sciences [16]. One of the objectives of time series analysis is building and evaluating models predicting future values of a time series based on current and past values. In this paper, we apply time series analysis to workload modeling with the goal of efficient resource provisioning. Several works have concentrated on Web and data center workload modeling and prediction based on autoregressive models [17], [18], [19]. We share with this work the employment of autoregressive models for workload prediction. However, our particular focus in this paper is on autoregressive models for enhancing locality, while achieving high resource utilization and load balance. Zhang et al. [20] decompose a dynamic application workload into two components: a base workload showing a predictable pattern and a trespassing load generated upon the arrival of load spikes. The load is assigned to a hybrid cloud in the following manner. When the load is lower than a load threshold, all the data items are served from the private cloud. When the load becomes higher than the threshold, the most popular items are assigned to an external cloud provider. In [5] the authors classify workload spikes into volume spikes (the unexpected increase of aggregate workload) and data spikes
Probability
0.8
VI. R ELATED WORK
-2
-1
0
1
2
Error
(b) Multi-model configuration Fig. 9.
Server provisioning efficiency for thrL = 0.9
1.0
Multi-model
0.0
0.2
0.4
0.6
0.8
Uni-model
0.5
0.6
0.7
0.8
0.9
thrL
Fig. 10. Server utilization for different values of thrL . The standard deviation bars show that the both uni-model and multi-model achieve a good load balance.
(the unexpected increase of workload of individual data items). The authors propose a model for generating spikes, constructed through the superposition of volume and data spikes. In the same direction Lassnig et al. [21] propose a model and metrics for estimating burst predictions with an moving average based model. Bodik et al. [22] propose to use statistical machine learning techniques for modeling the workload of Internet applications. A control loop predicts the performance, estimates the number of servers required to handle the predicted workload, detects deviations in the performance model, and, if necessary, estimates a new performance model. The model is built in function of workload, by abstracting away data. In our work we construct a performance model for a content-based application and we take into account data locality and data popularity. Sastry and Crowcroft [23] group popular user-generated content from an Internet workload onto few disks, allowing other disks to be placed in low energy states, thus, saving energy. Wildany and Miller [24] group data likely to be accessed within a short time of each other on the same disk, and place underutilized disks in low power states. Our approach differs from the two previous techniques in that our scheme groups data based on access affinity and, additionally provides a group-level prediction model. Krioukov et al. [2] present a design of a power-proportional cluster, in which a cluster manager runs a knapsack algorithm in order to provision an optimal number of servers. Our approach targets to provision an optimal number of servers under the additional constraints of data locality and data popularity. VII. C ONCLUSIONS In this paper, we propose a methodology for modeling and predicting access workload for affine data groups with the goal of high-content locality and agile elasticity, while achieving high resource utilization and load balancing. The locality is achieved by grouping in bins content items likely
to be accessed together. Agile elasticity is obtained by multimodeling: modeling and predicting access workload at bin level and at minute granularity. Our multi-modeling approach has the additional advantage of providing locality-preserving resource allocation. In the experimental section, we demonstrate that the identification and fitting of models can be done in a computational efficient way. Additionally, we show that our models adapt to changing workload in an effective manner. Subsequently our results show that the multi-model approach provides a higher content locality than uni-model approach, by improving the miss rate by 15%. Finally, we bring experimental evidence that the locality enhancement is achieved without hurting the efficiency of server provisioning, the server utilization and the load balance. The short-term modeling approach presented in this paper complements the long-term modeling and prediction from our previous work [3]. In the future, we plan to integrate these two approaches into a hierarchical framework [18], which should provide integrated prediction and modeling. Further, we plan to extend our study to other traces. In particular, we are interested in evaluating the proposed model with heterogeneous data sets for different request patterns and content size distributions. Finally, we plan to study the applicability of our ideas in geographically distributed content delivery systems. ACKNOWLEDGEMENTS This research has been partially funded by the Spanish Ministry of Education under FPU program AP2007-03530 (Juan M. Tirado) and by the Spanish Ministry of Science and Innovation under the project TIN2010-16497. R EFERENCES [1] B. Urgaonkar, P. Shenoy, A. Chandra, P. Goyal, and T. Wood, “Agile dynamic provisioning of multi-tier internet applications,” ACM Trans. Auton. Adapt. Syst., vol. 3, pp. 1:1–1:39, March 2008. [2] A. Krioukov, P. Mohan, S. Alspaugh, L. Keys, D. Culler, and R. Katz, “Napsac: Design and implementation of a power-proportional web cluster,” in n Proceedings of the First ACM SIGCOMM Workshop on Green Networking I, New Delhi, India, August 2010. [3] J. M. Tirando, D. Higuero, F. Isaila, and J. Carretero, “Predictive data grouping and placement for cloud-based elastic server infrastructures,” in Proceedings of the 2011 11th IEEE/ACM International Conference on Cluster, Cloud and Grid Computing, ser. CCGRID ’11, 2011. [4] A. I. McLeod and Y. Zhang, “Partial autocorrelation parameterization for subset autoregression,” Journal of Time Series Analysis, vol. 27, no. 4, pp. 599–612, 2006. [5] P. Bodik, A. Fox, M. Franklin, M. Jordan, and D. Patterson, “Characterizing, modeling, and generating workload spikes for stateful services,” in In Symposium on Cloud Computing (SOCC), 2010. [6] Last.FM, “New architecture based on SSD, online: blog.last.fm/2009/12/14/launching-xbox-part-2-ssd-streaming,” December 2009. [7] J. M. Tirado, D. Higuero, F. Isaila, J. Carretero, and A. Iamnitchi, “Affinity p2p: A self-organizing content-based locality-aware collaborative peer-to-peer network,” Comput. Netw., vol. 54, pp. 2056–2070, August 2010. [8] R. Shumway and D. Stoffer, Time series analysis and its applications, 3rd edition. Springer Verlag, 2010. [9] D. B. F. Sangsoo Lee, “Application of subset autoregressive integrated moving average model for short-term freeway traffic volume forecasting,” Transportation Research Record: Journal of the Transportation Research Board, vol. 1678, pp. 179–188, 1999.
[10] A. I. McLeod and Y. Zhang, “Improved subset autoregression with r package,” Journal of Statistical Software, vol. 28, no. 2, pp. 1–28, 10 2008. [11] J. M. Tirado, D. Higuero, F. Isaila, and J. Carretero, “Analyzing the impact of events in an online music community,” in Proceedings of the ACM Eurosys 2011, Workshop on Social Network Systems, 2011. [12] P. Gill, M. Arlitt, Z. Li, and A. Mahanti, “Youtube traffic characterization: a view from the edge,” in Proceedings of the 7th ACM SIGCOMM conference on Internet measurement, ser. IMC ’07. New York, NY, USA: ACM, 2007, pp. 15–28. [13] A. Nazir, S. Raza, D. Gupta, C. Chuah, and B. Krishnamurthy, “Network level footprints of facebook applications,” in Proceedings of the 9th ACM SIGCOMM conference on Internet measurement conference. ACM, 2009, pp. 63–75. [14] T. Qiu, J. Feng, Z. Ge, J. Wang, J. Xu, and J. Yates, “Listen to me if you can: tracking user experience of mobile network on social media,” in Proceedings of the 10th annual conference on Internet measurement. ACM, 2010, pp. 288–293. [15] G. Urdaneta, G. Pierre, and M. van Steen, “Wikipedia workload analysis for decentralized hosting,” Elsevier Computer Networks, vol. 53, no. 11, pp. 1830–1845, July 2009. [16] J. G. De Gooijer and R. J. Hyndman, “25 years of time series forecasting,” International Journal of Forecasting, vol. 22, no. 3, pp. 443–473, 2006. [17] A. Chandra, W. Gong, and P. Shenoy, “Dynamic resource allocation for shared data centers using online measurements,” in Proceedings of the 2003 ACM SIGMETRICS international conference on Measurement and modeling of computer systems, ser. SIGMETRICS ’03. New York, NY, USA: ACM, 2003, pp. 300–301. [18] T.-H. Li, “A hierarchical framework for modeling and forecasting web server workload,” Journal of the American Statistical Association, vol. 100, pp. 748–763, 2005. [19] D. Gmach, J. Rolia, L. Cherkasova, and A. Kemper, “Workload analysis and demand prediction of enterprise data center applications,” in Proceedings of the 2007 IEEE 10th International Symposium on Workload Characterization, ser. IISWC ’07. Washington, DC, USA: IEEE Computer Society, 2007, pp. 171–180. [20] H. Zhang, G. Jiang, H. Chen, K. Yoshihira, and A. Saxena, “Intelligent workload factoring for a hybrid cloud computing model,” in International Workshop on Cloud Services, 2009. [21] M. Lassnig, T. Fahringer, V. Garonne, A. Molfetas, and M. Branco, “Identification, modelling and prediction of non-periodic bursts in workloads,” in Proceedings of the 2010 10th IEEE/ACM International Conference on Cluster, Cloud and Grid Computing, ser. CCGRID ’10. Washington, DC, USA: IEEE Computer Society, 2010, pp. 485–494. [22] P. Bodik, R. Griffith, C. Sutton, A. Fox, M. I. Jordan, and D. A. Patterson, “Statistical machine learning makes automatic control practical for internet datacenters,” in In Workshop on Hot Topics in Cloud Computing (HotCloud ’09), 2009. [23] S. N., A. Hylick, and J. Crowcroft, “SpinThrift: saving energy in viral workloads,” in Communication Systems and Networks (COMSNETS), 2010 Second International Conference on. IEEE, 2010, pp. 1–6. [24] A. Wildani and E. Miller, “Semantic data placement for power management in archival storage,” in 5th Petascale Data Storage Workshop Supercomputing, 2010.