Multi-Objective Benchmark Studies for Evolutionary Computation
Kiam Heong Ang
Yun Li
Dept. of Electronics & Electrical Engineering University of Glasgow Glasgow, G12 8LT, U.K.
[email protected]
Dept. of Electronics & Electrical Engineering University of Glasgow Glasgow, G12 8LT, U.K.
[email protected]
Abstract
During the past few decades, many global optimisation and multi-objective evolutionary algorithms (MOEAs) have been developed. Those algorithms have shown very useful in enabling system design automation and globally accurate modelling. However, there is a lack of systematic benchmark measures that may be used to assess the merit and performance of these algorithms [1],[2],[3],[7],[8]. Such benchmarks should be consistent with those used in measuring conventional optimisation algorithms, should be simple to use and should result in little program overhead. This paper attempts to formalise, and to promote discussions on, this issue. In this paper, benchmarks in terms of (i) optimality; (ii) solution spread measure; (iii) optimiser overhead will be presented.
1
INTRODUCTION
No widely accepted benchmarks for performing comparative analyses of evolutionary algorithms currently exist. Benchmark problems studied in [4],[5],[7],[10],[12],[13],[14],[15] have proposed some. However, almost no comparative studies of techniques that substantiate the suitability in general test problems [2]. At present, researchers use various experimental methods and performance measures, resulting difficulties in thorough comparison and little formal discussion on these issues. Another difficulty associated with present benchmark problems is that they require theoretical solutions which are an obstacle as for some test problems and real-world applications theoretical solutions do not exist or impossible to compute. Currently proposed benchmarks are either very difficult to compute like Generational Distance or Overall Nondominated Vector Generational and Ratio [14] as they require the true Pareto front which is often unavailable. Benchmarks like Coverage [16] can give extremely misleading information [10]. The benchmark
Attainment Surface Sampling [10] is informative, but it can be quite troublesome when comparing existing algorithms with any new algorithm because the user n eeds to program existing algorithms where misinterpretation and wrong implementation may occur. In this paper, we attempt to formalise benchmark measures to evaluate effectiveness and efficiency of evolutionary algorithms on multi-objective optimisation problems. The end result is not to show which algorithm is better or the best, but rather to promote the use of benchmarks when measuring the effectiveness and efficiency of a particular evolutionary algorithm. For a thorough discussion of evolutionary algorithms for multiobjective optimisation, refer to [1],[2],[6],[12]. This paper is organised as follows. Section 2 describes the proposed benchmarking methods. In Section 3, an example of the benchmark results is shown. Finally, conclusions are drawn in Section 4.
2
PROPOSED BENCHMARKING METHODS
A method for benchmarking MOEAs that will be easy and efficient is proposed in this paper. The benchmarks defined here are not exclusive and more benchmarks can be added in the future. This method basically is to give an MOEA a score for each benchmarks based on a particular test problem and setting. When testing a new MOEA against existing ones, only the new MOEA needs to be tested. Alternatively, a particular MOEA may be tested against different parameters settings using these benchmarks. Here the proposed benchmarks are not restricted to test problems only, and can be extended to any real-world application. We propose to use an approximate Pareto front rather than the true Pareto front when it is impossible to compute the true Pareto front. The approximate Pareto front is obtained by running a few different MOEAs on a particular test problem T1 and retrieved all the nondominated solutions based on all the results given by the MOEAs. This approximate Pareto front for test problem T1 should be made freely available by means of placing it on a website for everyone to download or by email upon
request. In this way, comparison of MOEAs on T1 can be done easily and efficiently. The following Average Relative Accuracy Index (ARAI) is used to gauge how ‘accurate’ the approximate Pareto front is. As a guideline any value less than 0.02 should be sufficient.
f i − f i +1 1 j j ARAI = ∑ Ni=−11 ∑ mj=1 N −1 fj − f j
2
(2.1) 2.3
where N is the number of solutions found, m is the number of objectives, f j and f j are the lower and upper bounds of f j . Based on a Pareto front, the following multi-objective benchmarking problems may be addressed. First, how close are the solutions found to the front? Second, are the solutions well spread out? Last but not least, what is the efficiency of the algorithm or number of function evaluations required? Below are the proposed benchmarks that endeavour to answer these questions. 2.1
OPTIMALITY
Optimality represents the relative closeness of an objective vector found, f$0 , to the approximated ideal objective vector f0 . This measure is defined here as:
1 Optimality = N
(2.2) a
where f 0 and f 0 are the lower and upper bounds of the f0 and N is the number of Pareto optimal solutions found. In this case, the 2-norm (Euclidean metric) is being used i.e. a=2. Therefore, it is the normalised Euclidean distance between each vector in f$0 and the nearest member of f0 . Thus, a value of zero indicates f$ = f0 and any values 0
above zero indicates that f$0 deviates from f0 . 2.2
SOLUTION SPREAD MEASURE
While it is desirable to find more Pareto-optimal solutions, it is also desirable to find the ones scattered uniformly over the Pareto frontier in order to provide a variety of compromise solutions to the decision maker. Solution Spread Measure (SSM) represents the distribution of the solutions along the Pareto front. This benchmark is proposed in [4]: d f + dl +
SSM =
∑
N −1
i =1
di − d
d f + dl + ( N − 1)d
(2.3)
where N is the number of solutions found along the Pareto front so there are (N-1) consecutive distances, di is the
OPTIMISER OVERHEAD
Alternative to or in addition to the ‘total number of evaluations’, the ‘total CPU time ’ may be used in a benchmark test. This would be useful in indicating how long an optimisation or simulated evolution process would take in real world and to indicate the amount of program overhead as a result of the optimisation manipulations such as those by EA operators. More quantitatively, the optimiser overhead may be calculated by [5]: Optimiser Overhead =
TTotal − TPFE TPFE
(2.4)
where TTotal is the total time taken and TPFE is the time taken for pure function evaluations. Thus, a value of zero indicates that an algorithm is efficient and does not have any overhead. However, this is an ideal case and is not practically reachable.
3
f 0 − fˆ 0 f0 − f0
distance (in objective space) between each solution, d is the arithmetic mean of all d i and df and dl are the Euclidean distances between the extreme solutions and the boundary solutions of the obtained non-dominated set. Thus, a low performance measure characterises an algorithm with a good distribution capacity.
EXAMPLE
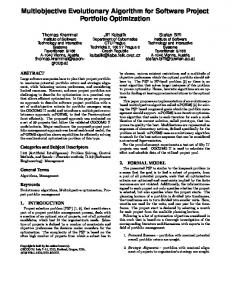
To illustrate the proposed benchmarks, an example is shown here. The 3 MOEAs used are NSGA-II (Nondominated Sorting GA -II) [4], (1+1)-PAES (Pareto Archived Evolution Strategy) [9] and NUS_MOEA (Multi-Objective Evolutionary Algorithm Toolbox) [11]. All the objective functions are to be minimised and similar settings are used for all the MOEAs. Table 3.1 shows the test problem description, Table 3.2 shows the benchmark results and Figure 3.1 shows the solutions found by the MOEAs. The benchmark measures are based on the approximate Pareto front for ZDT6 and have an Average Relative Accuracy Index of 0.00119. For this example, clearly NSGA -II is a better algorithm for this test problem as it has better scores across all the benchmarks. As for the other two, the benchmarks shows that (1+1)-PAES has a better optimality measure and optimiser overhead but the distribution of the solutions are not as good as NUS_MOEA. So we can deduce that for analysing a MOEA one should not just rely on a single benchmark and gauge the MOEA. Instead, we should look at all the benchmarks and from there it will give us a better picture of the MOEA characteristics.
Table 3.1: Test Problem Description Problem ZDT6 [16]
n 10
Variable Bounds
Objective Functions f1 (x) = 1 – e xp(-4x 1 )sin 6 (6πx 1 )
[0,1]
f2 (x) = g(x)[1 – (f1 (x)/g(x))2] g(x) = 1 + 9[( ∑in=2 xi )/(n-1)]0.25 Table 3.2: Benchmark result on ZDT6 Optimality
Solution Spread Measure
Optimiser Overhead
0.07758855
1.023002539
443.07
NSGA-II
0.003928746
0.574980214
6.2954
(1+1)-PAES
0.006022287
1.344196807
11.910
NUS_MOEA
1.4 1.2 1 f2
0.8 0.6 Approximate Pareto Front NUS_MOEA NSGA-II (1+1)-PAES
0.4 0.2 0 0
0.2
0.4
f1
0.6
0.8
1
Figure 3.1: MOEAs result on ZDT6
4
CONCLUSIONS
By having a mechanism to measure the effectiveness and efficiency of a MOEA, we would be able to select wisely which MOEA and parameter settings to use in applications. The next milestone will be to develop benchmarked MOEAs for applications to control system design automation. Understanding that more than 90% of industrial control systems are in a form of multi-PID and many process control system are performed in a predictive control manner, it is proposed to harness these to unleash the power of both schemes. In particular, the powerful breeding technique of evolutionary algorithms is to be applied to search and discover novel and optimal control structures, aiming at the root structural level and not just parameters effectively to improve plant stability and maximise plant profitability, for improved costeffectiveness, quality and creativity.
Acknowledgments The first author would like to thank Universities UK and University of Glasgow for the sponsorship of his PhD. References [1] C. A. C. Coello, “A Comprehensive Survey of Evolutionary-Based Multiobjective Optimization Techniques”, Knowledge and Information Systems, An International Journal, 1(3):269 -308, August 1999. [2] C. A. C. Coello, “An Updated Survey of Evolutionary Multiobjective Optimization Techniques: State of the Art and Future Trends”, 1999 Congress on Evolutionary Computation, pp. 3-13, Washington D.C., July 1999, IEEE Service Centre. [3] K. Deb, “Multi-Objective Genetic Algorithms: Problem Difficulties and Construction of Test Functions”, Evolutionary Computation, vol. 7, pp. 205 -230, 1999.
[4] K. Deb, A. Pratap, S. Agarwal and T. Meyarivan, “A Fast and Elitist Multi-Objective Genetic Algorithm: NSGA -II”, KanGAL report 200001, Indian Institute of Technology, Kanpur, India, 2000. [5] W. Y. Feng, T. Brune, L. Chan, M. Chowdhury, C. K. Kuek and Y. Li, “Benchmarks For Testing Evolutionary Algorithms”, Proceedings of the 3rd Asia-Pacific Conference on Control and Measurement, pp. 134-138, Dunhuang, P. R. China, 1998. [6] C. M. Fonseca and P. J. Fleming, “An Overview of Evolutionary Algorithms in MultiObjective Optimization”, Evolutionary Computation, 3(1):1-16, 1995. [7] C. M. Fonseca and P. J. Fleming, “On the Performance Assessment and Comparison of Stochastic Multiobjective Optimizers”, PPSN IV, H.-M. Voigt, W. Ebeling, I. Rechenberg and H.-P. Schwefel Eds, Berlin, Germany: Springer, pp. 584 -593, 1996. [8] M. P. Hansen and A. Jaszkiewicz, “Evaluating the Quality of Approximations to the Non-Dominated Set”, Technical Report IMM-REP-1998-7, Institute of Mathematical Modelling, Technical University of Denmark, 1998. [9] J. D. Knowles and D. W. Corne, “The Pareto Archived Evolution Strategy: A New Baseline Algorithm for Pareto Multiobjective Optimisation”, 1999 Congress on Evolutionary Computation, pages 98 -105, Washington, D.C., July 1999. IEEE Service Center. [10] J. D. Knowles and D. W. Corne, “Approximating the Nondominated Front Using the Pareto Archived Evolution Strategy”, Evolutionary Computation, 8(2):149-172, 2000. [11] K. C. Tan, T. H. Lee, D. Khoo and E. F. Khor, “MOEA Toolbox for Computer-Aided Multi-Objective Optimization”, 2000 Congress on Evolutionary Computation, vol. 1, pp. 38-45, Piscataway, New Jersey, July 2000. IEEE Service Center. [12] D. A. V. Veldhuizen and G. B. Lamont, “Multiobjective Evolutionary Algorithm Research: A History and Analysis”, Technical Report TR-98-03, Department of Electrical and Computer Engineering, Graduate School of Engineering, Air Force Institute of Technology, Wright-Patterson AFB, Ohio, 1998. [13] D. A. V. Veldhuizen and G. B. Lamont, “Multiobjective Evolutionary Algorithm Test Suites”, Proceedings of the 1999 ACM Symposium on Applied Computing, pp. 351 -357, San Antonio, Texas, 1999, ACM. [14] D. A. V. Veldhuizen and G. B. Lamont, “On Measuring Multiobjective Evolutionary Algorithm Performance”, 2000 Congress on Evolutionary Computation, vol. 1, pp. 204 -211, Piscataway, New Jersey, July 2000, IEEE Service Centre.
[15] E. Zitzler and L. Thiele, “Multiobjective Evolutionary Algorithms: A Comparative Case Study and the Strength Pareto Approach”, IEEE Transactions on Evolutionary Computation, 3(4):257-271, November 1999. [16] E. Zitzler, K. Deb and L. Thiele, “Comparison of Multiobjective Evolutionary Algorithms: Empirical Results”, Technical Report 70, Computer Engineering and Networks Laboratory (TIK), Swiss Federal Institute of Technology (ETH) Zurich, Gloriastrasse 35, CH-8092 Zurich, Switzerland, December 1999.