Multi-objective Optimisation of Building Geometry for Energy Consumption and View Quality Zack Xuereb Conti1 , Paul Shepherd2 , Paul Richens3 Singapore University of Technology & Design 2,3 University of Bath 1
[email protected] 2
[email protected] 3
[email protected]
1
In property development, the view quality contributes significantly to the property value. In many cases, the architect is constrained by the property developer to take full advantage of the view by designing large glazed facades ignoring the consequence on the energy consumption of the building caused by the conflicting orientation of the view. This paper presents a design tool to help the architect interactively explore different building and window geometries that trade-off energy consumption (kWh) and view quality (€). This design tool allows interaction with parametric building geometry, simulation of energy consumption and view quality, and an optimisation search engine. The simulation of the view quality quantifies a view according to the visibility and quality of its contents by using a novel view-scoring method. The design tool is tested with both north-oriented and south-oriented views and produces a Pareto front from which resulting geometries are visualised. Keywords: Optimisation, Simulation, Energy consumption, View quality, Design tool
INTRODUCTION In recent years, Mediterranean towns have seen a growing trend of old seafront houses being replaced with luxury apartment blocks. In most cases, the architect is constrained by the property developer to design large glazed facades to gain full visibility of the seafront, which raises the property value. This approach, however, ignores the implications on the cooling load of the building caused by the orientation of the view. This study proposes an interactive design tool allowing the architect to search for trade-off solutions between a profit-yielding view quality and a reduced
cooling load. The approach can be broken down into the parametrisation of the building geometry, the thermal and view quality analysis, and subsequent optimisation. These aspects were combined into an integrated software application.
EA-BASED DESIGN To the author's knowledge, there is no existing literature dealing explicitly with view quality in the context of low energy optimisation of buildings despite the optimisation of daylight and heat transfer being commonly researched through two approaches; the optimisation of the fenestrations alone (Shea et al.
Design Tools - Applied - Volume 1 - eCAADe 33 | 287
2006; Wright and Mourshed 2009; Gagne and Andersen 2010; Wright et al. 2013) and the optimisation of the envelope together with fenestrations (Bouchlaghem 2000; Caldas and Norford 2002; 2003). These all propose a form of design tool coupling simulation and optimisation methods. Caldas & Norford (2002; 2003) employ Pareto optimisation using a Genetic Algorithm (GA) to search for solutions that maximise the useful daylight and minimise heating requirements. Bouchlaghem (2000) presents a computer model which simulates thermal performance taking into account design variables related to the building's envelope and fabric and applies numerical optimisation techniques to automatically determine the optimum design variables, which achieve the best thermal comfort conditions. Efforts by Shea et al. (2006) also focus on maximising lighting performance and minimising cost of building envelopes by subdividing the envelope into a number of panels whereby each panel can take one of four different opacities. They coupled a Multi-criteria Ant Colony Optimisation (MACO) algorithm with daylight simulation computed in 'Radiance'. Data for each panel was precompiled and used as an input into the optimisation algorithm, so that the lighting calculations were performed once. Similarly, Wright & Mourshed (2009) adopt the cellular subdivision method to achieve an almost free-form fenestration geometry. However, the subdivision approach was computationally expensive due to large number of variables. The energy use of each solution was simulated externally in 'EnergyPlus' (Crawley et al. 2000). A binary encoded GA was employed as the optimisation search. This approach was applied further to a multiobjective problem to minimise energy consumption and construction costs (Wright et al. 2013), using Deb et al.'s (2002) Non-dominated Sorting Genetic Algorithm II (NSGA-II) for its efficiency in dealing with multi-objective problems of this nature. The building energy-use (kWh) accounted for the annual heating, cooling and electrical use while the capital cost of the facade was calculated by accounting for the construction cost of the opaque and glazed cells and for
288 | eCAADe 33 - Design Tools - Applied - Volume 1
overhangs. Gagne & Andersen's method (2010) allows the user to input a 3D massing model and performance target goals of illuminance and glare. An external simulation engine 'Lightsolve Viewer' (Andersen et al. 2008) was used together with a GA. The simulation in nearly all of these approaches was performed in available commercial software packages. The research outlined in this paper emphasises on simplified energy calculations for quick visual feedback during the interactive early stages of design. The proposed design tool has an in-built real-time simulation of solar radiation and fenestration shading, which together contribute to the calculation of the cooling load objective function measured in Kilo Watt Hours (kWh).
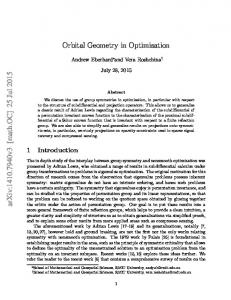
PROBLEM SET-UP The geometry under study is representative of the context of this research. A parametric model of a regular block of apartments was modelled. The parameters considered include building-site dimensions, number of floors, tilt angle of facades, number of windows, overhang, etc. While, the significant reduction in solar radiation caused by overhangs or external mechanical shading devices has been widely researched, their architectural design value comes across as a late design solution when not considered at the early stages of the design process. This paper focuses on improving the energy-use of the building purely by self-shading geometry. The use of external shading devices are also a deterrent to the view quality if they are visible. On the other hand, the use of internal blinds obstructs the view and contradict the design intent for large glazing. This research explores the effects of casting shadows on the windows below (see left in figure 1) and of tilting the facade about the horizontal axis of the facade, to produce a larger angle of solar incidence (see right in figure 1), as a means to reduce the energy consumption. These objectives dictated the choice of variables to produce overhangs and tilt the facade.
Figure 1 Shaded windows (left), tilted windows (right).
total cooling load (see formula 3) accounts for the heat gain (QW ) through the unshadowed area of the window (ATGlazing ) (see formula 1) and the heat gain (QQ+f Roof ) through the unshadowed area (ATRoof ) of the roofs in the case of terraced floors (see formula 2). Consumption loads due to casual gains were ignored for faster calculations at early design stage. An approach to wall fenestration such as Wright & Mourshed's cellular approach (2009) is applicable to the problem being considered. However it involves a large number of variables which slow down the optimisation. Therefore, a more geometrical method using few variables to define the window geometry was adopted. The method allows window arrangements ranging from fully glazed walls to multiple individual windows whose height and width can be individually controlled.
SIMULATION METHODS Thermal
Figure 2 Dynamic subdivision and shadow raytracing of windows.
The thermal objective is being defined as the consumption load (kWh) required to cool a building in a Mediterranean climate. It is assumed that the cooling load is required only during the peak summer months since the worst case for the conflict between the energy consumption and the orientation of the view is during the warm months. A number of calculation methods were reviewed including the Cooling Load Temperature Difference Method (CLTD) (ASHRAE 1979), the Cooling Degree Days method (Day et al. 2000), the LT method (Baker and Steemers 1996) and the Admittance method (CIBSE 2006). The latter method was selected for implementation in the design tool because the pre calculated cooling load values it makes use of, can be calculated (see equation 3). This was important in order to avoid storing large sets of tabulated values into the design tool. These values refer to the cooling load caused by heat gain through a window. The global solar radiation ISG is determined from the knowledge of the orientation and position of the sun, which the design tool is capable of calculating. The
QW =
UGlazing AT Glazing [TE − TR ]+ FC ISG (1)
QQ+Roof =
URoof AT Roof [(TSAmean − TR ) + (TSA − TSAmean )] (2)
QT = QW + QQ+f Roof
(3)
Where: UGlazing is the U-Value of the glazing is the area URoof is the U-Value of the roof material TE is the external ambient temperature TR is the internal dry bulb base temperature FC is the air-node coefficient (CIBSE guide) ISG is the global solar radiation TSAmean is the mean sol-air temperature TSA is the sol-air temperature
Design Tools - Applied - Volume 1 - eCAADe 33 | 289
The projected shadows cast on the windows are determined by means of a recursive subdivision routine where at each division, the window vertices are raytraced to test for intersection with the overhung floor above (see figure 2). For each subdivided face, the radiation is calculated and accumulated, resulting in the total heat gain through the unshaded area of the window.
View Quality View quality is regarded to be a subjective matter. However for optimisation, the view quality needs some form of objective function. Whilst there have not been any known attempts at the quantification of the quality of the view in the context of an optimisation problem, Shellard (2006) reviews a number of attempts in evaluating a view for real-estate purposes using hedonic regression to decompose the constituent characteristics of the property value (Lake et al. 1998, Yu et al. 2007). The view quality in the real-estate sector is somehow rationalised and objectively rated. This indicates that a good quality view can indeed be distinguished from an inferior quality view. After consulting with a property realtor, the view types were categorised into a discrete set of direct sea view, direct country view, side sea view, side country view, open views (such as town squares and townscapes) and no view at all.
This research adopts a simplified hedonic approach by sampling a set of properties of known floor areas, within a luxury condominium. A condominium offers consistency for comparison, since contributing factors such as location, amenities, etc are the same. The main varying factors are the floor areas and the view quality. Therefore, the aim is to derive a value per square metre, for the view component of the property rental value (€/month/m2 ) for a coherent comparison between different floor areas. This is done
290 | eCAADe 33 - Design Tools - Applied - Volume 1
by extracting it from the property value marketed by the property agent. After consulting with a project manager of the condominium, the properties facing the best view, were originally valued at double those with the 'worst' view. This assumption was used to deduct the the view component from the property value to determine the value of the floor area only. Two apartments in the condominium with extreme view types (direct sea view and no view) were compared and resulted that the values for their floor area only, compared well when eliminating the view component of the direct sea view apartment, thus confirming the project manager's assumption. The average monthly value for the floor area only was €10.56/month/m2 . This rate was then applied to an apartment of different area with side sea views. The monthly value for the floor area (€10.56×330m2 ) was subtracted from the market rental value of this apartment (€5,500/month), resulting in the value of the view component (€2015.2/month), which when divided by the area, compares well with the view component of the other properties as it lies midway between the direct sea view whose monthly view value rate was €10.6/month/m2 and the no view. The results seem to indicate linear variation between the view type and their derived monthly view value (€/month/m2 ), for this particular location. The derived monthly floor area and view values were then applied to other properties in the same town, but not within the same condominium, and their resulting property values also compared well with the values marketed by the property agents, thus confirming the reliability of the derived monthly view value rate for this particular study. The property agent's categorising of the view quality assumes a uniform view as it does not qualify the view based on its specific contents. This simplification called for a smarter method of assessing the view quality by developing a scoring system whereby a window score represents the total of the individually and appropriately scored 'items' in the view. A 'pixel-scoring' method was developed within the design tool whereby each window was as-
Figure 3 An example of a good view (left) and an inferior view (right), in real-estate terms.
signed a score based on the total score from 4 different viewing positions on the corresponding floor. Figure 4 Colour-scoring on unwrapped image of panoramic view. Figure 5 Geometrical model to determine projected window boundary onto the wrapped image.
A score range is represented by 255 greyscale tones where: 0 [black] = 6 points, 50 = 5 points, 87 = 4 points, 162 = 3 points, 209 = 2 points, 255 [white] = 1 point. The user is asked to mark up the 360 deg image based on their subjective judgement using these colours (see figure 4). The condominium apartment with the best view discussed earlier and and whose monthly rent is €6000 and monthly view value €3000, is used as an example. The view visible from its fully glazed facade was simulated and scored 2480764 points. One scored point was determined to be equivalent to €0.00121 by dividing the score by the monthly view value. The same exercise was repeated for a side sea-view, view type and this scored 1991232 corresponding to a monthly view value of €2,408. As expected it is lower than the direct sea view value. Figure 5 presents a model used to score the view through a window. This is based on mapping the 360 degrees colour-scored panoramic image of the view shown in Figure 4, onto the circumference of a cylinder of infinite radius, since the objects in the view are relatively far away from the observer. Therefore, this ~ and B ~ assumes parallelism between the vectors A (see figure 5). These assumptions however, cause visual inaccuracies when displaying the boundary A'B' because the geometry with an assumed infinite radius is being visualised in perspective, using finite dimensions. The field of vision (FOV) from the ob~ through the window AB, is proserver's position E, jected as a region, onto the mapped image on the cylinder. The pixels within that projected region are
scored and counted. The horizontal field of vision (hF OV ) and the vertical field of vision (vF OV ) are ~ and B ~ to defound trigonometrically using vectors A termine the indices of the pixels within region A'B'. This approach also takes view-obstructing overhangs into account. The obstructed pixels are scored only 1 point.
OPTIMISATION APPROACH The idea of implementing an optimisation algorithm is to search the design space for geometries that reduce energy consumption yet yield high view value, which at times can conflict, depending on the orientation of the building and the direction of the sun. The use of Evolutionary Algorithms (EA) in multiobjective optimisation have been well documented by Coello et al. (2007). Genetic Algorithms (GA) are a common type of EA adapted and applied to multi-objective optimisation. GAs are founded on a population-based evolutionary approach, which search for different areas in the solution space si-
Design Tools - Applied - Volume 1 - eCAADe 33 | 291
multaneously. The Non-dominated Sorting Genetic Algorithm-II (NSGA- II) (Deb et al. 2002) and the Strength Pareto Evolutionary Algorithm 2 (SPEA-2) (Zitzler et al. 2001) are common approaches. A good overview of the application of GA in multi-objective optimisation was given by Deb (2001) and more recently by Konak et al. (2006). This research implements the NSGA-II (Deb, Pratap et al. 2002) which performed well for similar optimisation problems (Wright, Brownlee et al. 2013). This is a GA based search method that employs elitism. Elitism ensures that the best solutions of a generation are retained for the next generation and replaced only if they become dominated. This also ensures cheaper computation. An initial population is randomly generated and offsprings are generated by crossing over and mutating the parent population. The parent and child population are then combined and sorted by comparing each solution to the rest of the combined set and assigning a rank index corresponding to the number of other solutions they are dominated by. A rank index of zero corresponds to a Pareto solution as it is not dominated by any other solution. A visualisation of the optimisation was developed within the design tool allowing the user to view the solutions, identify the colour coded Pareto front, and view the corresponding geometries and values, when interacting with the solutions (see figure 6). The user may easily choose to constrain or unconstrain variables during the optimisation. The user may also select the population size, the number of iterations and the mutation factor by which the nonconstrained variable values will mutate and within the range of each respective variable. Solutions from past generations are plotted in white and their age is represented by their transparency. This visualises the evolution of the solutions from one generation to the next. The view value lies on the y-axis and has been inverted in order to visualise a more familiar Pareto curve, whilst the cooling load lies on the x-axis. The software application was built in an object oriented approach to benefit from the reuse of cer-
292 | eCAADe 33 - Design Tools - Applied - Volume 1
tain complex routines such as the shadow raytracing, window subdivision and cooling load calculation. The variables controlling the geometry of the apartment block were represented as a group of slider objects (ControlP5) and written as an object representing the DNA of a solution. The software was built entirely in Processing (Fry and C.Reas 2004). Figure 6 visualises the user interface. Figure 6 Interaction with plotted Pareto solutions to visualise the corresponding geometry in the main viewport.
RESULTS Pareto analyses were performed with two objective functions: minimising energy consumption required to cool an apartment building and maximising the view quality visible through the windows. Two cases were investigated; one with the desirable view to the north and the other to the south. In either case, a population size of 450 was used and run for 5 generations. Figures 7 and 8 visualise the resulting nondominated Pareto front and corresponding geometries of each study. The terracing, facade tilts, number of windows, and window dimensions were allowed to vary in only one direction whilst keeping the dimensions of the building site fixed to simulate a typical sandwiched building footprint. In both cases,
Figure 7 Study 1: Resulting fronts (left), corresponding geometries (right).
Figure 8 Study 2: Resulting fronts (left), corresponding geometries (right).
the history of the evolution of the solutions is visualised by more transpearent points. The view value on the y-axis has been inverted in order to visualise a more familiar Pareto curve meaning that solutions towards the origin are fitter in both objectives. In both cases, solutions A to E lie on the Pareto front (F1) as they are not dominated by any other solution while F, G and H lie on the second front (F2), meaning they are each dominated by one solution.
was not to improve the algorithm but to develop a design tool.
Study 1:. As expected, solution A (see figure 7) shows that a large glazed facade produces excellent view quality and a decent cooling load since the view orientation avoids the direct solar beam for most of the day. Heat gain from diffused radiation is the contributing component to the cooling load in this case. Solutions E and F (see figure 7) clearly visualise the direct relationship between the window size and the cooling load, and the view quality. Overall, it can be seen that the window size is the dominant parameter driving the optimisation. Study 2:. Despite Solution A (see figure 8) not proving the hypothesis of reducing the cooling load by tilting the facade, it is interesting to point out that solution C (see figure 8) indicates that casting shadows on the windows has a larger effect on improving the cooling load. This also indicates that a positive tilt, consequently producing an overhung floor, is more dominant than the negative tilt. Interestingly, Solution D (see figure 8) achieves an improved cooling load due to a combination of a higher solar incidence angle (negative facade tilt) and narrow yet tall windows still producing a decent view quality. It can be seen in both studies that besides contributing to the cooling load, the dimensions of the floor plan also have an inverse relationship with the view quality since the view is sampled from 4 different positions on the floor plan. The visibility of the view deteriorates when viewed from deeper within the room. The generation of the initial population seemed to have influence on the variety of solutions (Wright and Mourshed 2009). However this study used normally distributed random variables since the focus
CONCLUSION This research presents a design tool to help an architect interactively explore different building and window geometries that trade-off the energy consumption and view quality. The energy consumption is simulated in the design tool using real-time calculations of solar radiation based on location and time. The view is simulated, and its quality is quantified using a real-estate approach and a bespoke scoring system. Finally, the design tool makes use of a GA (Deb et al. 2002) as a search optimisation method. The simulation methods developed, coupled with a Pareto-optimal approach, were able to create a variety of architectural shapes characterised by terracing and inclination of faces, that responded to design objectives for reduced energy consumption and increased view quality. The results from the Paretobased studies provide valuable information in understanding the trade-offs between the conflicting objectives. It suggested that increasing the angle of so-
Design Tools - Applied - Volume 1 - eCAADe 33 | 293
lar incidence by tilting the facade, has less of an effect than casting shadows on the windows. Introducing design variables such as facade tilt and over hung floors in the optimisation, produced new ways to reduce the energy consumption as opposed to only varying the window size. The exploration of new design variables is non trivial because it is limited to the user's intuitiveness and understanding of the problem. However the use of such an exploration tool allows the user to get one step closer by understanding the relationship between the uncommonly compared objectives. This is not limited to iterative exploration of the design space but also encourages to use the design tool as a manual 'hill climbing' exercise. The element of interaction in the proposed and future improved version of the design tool searches to bridge the gap between the use of such a computational solution-search paradigm and smaller, perhaps more traditional firms that employ a more analogue approach.
REFERENCES Andersen, M, Yi, L, Kleindienst, S, Lee, J, Bodart, Magali and Cutler, B 2008, 'An intuitive daylighting performance analysis and optimization approach', Building Research and Information : the international journal of research, development and demonstration, 36(6), pp. 593-607 ASHRAE, initials missing 1979, Cooling and heating load calculation manual., ASHRAE, Atlanta, Georgia Baker, N and Steemers, K 1996, 'LT Method 3.0 — a strategic energy-design tool for Southern Europe', Energy and Buildings, 23(3), pp. 251-256 Bouchlaghem, N 2000, 'Optimising the design of building envelopes for thermal performance', Automation in Construction, 10(1), pp. 101-112 Caldas, LG and Norford, LK 2002, 'A design optimization tool based on a genetic algorithm', Automation in Construction, 11(2), pp. 173-184 Caldas, L and Norford, L 2003, 'Shape Generation Using Pareto Genetic Algorithms: Integrating Conflicting Design Objectives in Low-Energy Architecture', International Journal of Architectural Computing, 1(4), pp. 503-515 CIBSE, initials missing 2006, CIBSE Guide A: Environmental
294 | eCAADe 33 - Design Tools - Applied - Volume 1
Design, CIBSE Coello, CAC, Lamont, GB and Van Veldhuisen, DA 2007, Evolutionary algorithms for solving multi-objective problems, Springer Crawley, D B, Pedersen, C O, Lawrie, L K and Winkelmann, F C 2000, 'EnergyPlus: Energy Simulation Program (2000)', ASHRAE Journal, 42(4), pp. 49-56 Deb, K 2001, Multi-objective optimization using evolutionary algorithms, John Wiley & Sons Deb, K, Pratap, A, Agarwal, S and Meyarivan, T 2002, 'A fast and elitist multiobjective genetic algorithm: NSGA-II', Evolutionary Computation, IEEE Transactions on, 6(2), pp. 182-197 Gagne, JML and Andersen, M 2010 'Multi-Objective Facade Optimization for Daylighting Design Using a Genetic Algorithm', SimBuild 2010, New York Konak, A, Coit, DW and Smith, AE 2006, 'Multi-objective optimization using genetic algorithms: A tutorial', Reliability Engineering \& System Safety, 91(9), pp. 992-1007 Lake, IR, Lovett, AA, Bateman, IJ and Langford, IH 1998, 'Modelling environmental influences on property prices in an urban environment', Computers, Environment and Urban Systems, 22(2), pp. 121-136 Shea, K, Sedgwick, A and Antonuntto, G 2006, 'Multicriteria Optimization of Paneled Building Envelopes Using Ant Colony Optimization', in Smith, IC (eds) 2006, Intelligent Computing in Engineering and Architecture, Springer Berlin Heidelberg, pp. 627-636 Shellard, J 2006 'Modelling Dimensions of Height and View at Melbourne', University of Auckland, New Zealand, Pacific Rim Real Estate Society 12th Annual Conference Wright, JA, Brownlee, AEI, Mourshed, MM and Wang, M 2013, 'Multi-objective optimization of cellular fenestration by an evolutionary algorithm', Journal of Building Performance Simulation, 7, pp. 1-19 Yu, SM, Han, SS and Chai, CH 2007, 'Modeling the value of view in high-rise apartments: a 3D GIS approach', Environment and Planning B: Planning and Design, 34(1), pp. 139-153 Zitzler, E, Laumanns, M and Thiele, L 2001 'Evolutionary Methods for Design, Optimization and Control With Applications to Industrial Problems', Proc. EUROGEN 2001, Athens, Greece