Multi-objective optimisation of power restoration in electricity distribution systems Alexandre Mendes1 and Natashia Boland2 1
Centre for Intelligent Electricity Networks (CIEN) School of Electrical Engineering and Computer Science Faculty of Engineering and Built Environment The University of Newcastle, Callaghan, NSW, 2308, Australia.
[email protected] 2 School of Mathematical and Physical Sciences Faculty of Science and Information Technology The University of Newcastle, Callaghan, NSW, 2308, Australia.
[email protected]
Abstract. This paper proposes a new multi-objective approach for the problem of power restoration in (n-1) contingency situations. It builds on a previous, mono-objective approach introduced in Mendes et al. (2010) [14]. Power restoration normally relies on network reconfiguration, and typically involves re-switching and adjustment of tap-changers and capacitor banks. In this work, we focus on re-switching strategies. The quality of the re-switching strategy is measured in terms of voltage deviations, number of consumers still affected after the reconfiguration, number of overloaded branches and number of switches changes. Due to the number of criteria and conflicting objectives, power restoration is a prime candidate for multi-objective optimisation. The method studied is based on a genetic algorithm and was tested using two real-world networks, with up to of 1,645 branches and 158 switches. We present a contingency example for each network and discuss the results obtained. Finally, we discuss the approach’s convergence by analysing the evolution of the solutions that compose the Pareto frontier. Keywords: Multi-objective optimisation, genetic algorithms, power distribution, electricity networks
1
Introduction
Contingency situations are caused by a single failure (n-1), or multiple failures (n-k) of equipment in the distribution network. They are a relatively common occurrence and electricity companies must quickly implement a contingency plan to re-establish power supply to the consumers affected. In the scientific literature, (n-1) contingency problems can be categorized as either mono- or multiobjective; and the solution methods can be either exact, heuristic, or hybrid. In this work we present a new heuristic based on genetic algorithms to deal with multi-objective version of the (n-1) contingency problem.
A literature review on the (n-1) contingency problem applied to electricity distribution networks shows several studies dealing with the mono-objective version. From 1987 to 1989, Aoki et al. [1, 3, 2] have published a series of papers dealing with the electricity distribution restoration problem and the maximization of total load restored. All studies used different types of heuristics. In Dyalinas et al. (1989) [7], a heuristic was implemented to minimize the number of switch operations. In 1992, two works addressed the reconfiguration problem again minimizing the number of switch operations (Kim et al. [13], Fujii et al. [9]). In 2001, Ferreira et al. [8] worked on the minimization of out-of-service load using a genetic algorithm. Finally, Mendes et al. (2010) [14] studied the problem of power supply restoration minimizing number of disconnected buses, cable overloads and switching operations, combined into a mono-objective function. In terms of multi-objective approaches, there are four works on service restoration. In 1998, Tourne et al. [19] worked on the optimisation of load balance and voltage levels. In the same year, Miu et al. [15] addressed the maximization of load restored, with and without priorities, and number of switch operations, using a local search heuristic. In 2001, Augugliaro et al. [4] addressed load supply and power losses with a fuzzy genetic algorithm. More recently, Garcia and Franca (2008) [10], addressed the multi-objective problem by minimizing the number of affected consumers and the number of switch operations. They used a local search heuristic. For a broad picture of the area, we refer the reader to the two review papers of Perrier et al. (2010a,b) [16, 17]. From the perspective of Artificial Intelligence (AI), two works are particularly interesting as they integrate diagnosis and repair of power supply; a more complete scenario than that considered here [18, 5]. The main issue with some AI approaches, though, is that restoration is treated mainly as a topological problem – the network must be reconnected and radiality must be maintained. Not much emphasis is given to power quality, e.g. voltage deviations, equipment overloading, etc. The approach presented in this paper tries to address network re-connectivity as well as power quality in a more balanced way. In this study we consider distribution networks composed of generators, buses, loads, switches and branches. Even though the network has to operate in a radial topology, there is a level of redundancy. That is, power supply can flow through different paths to reach the same customer. This excess connectivity means that if all switches in the network are closed, several loops might be formed, thus violating the radiality requirement. Under normal circumstances, a feasible switching state will have a mix of open and closed switches. The problem of finding alternative routes for the power distribution is very complex. Alternative routes are determined by re-switching the network, which implies searching through the solution space of switches states. That is a high complexity task; if there are k switches present in the network, the search space has a size 2k , corresponding to each switch either being closed or open. Due to the exponential increase in the search space, the presence of a few dozen switches are sufficient to require the use of a heuristic such as genetic algorithms [12] to reach high quality solutions in short computational times.
The multi-objective version of the (n-1) contingency problem addressed in this work considers four criteria: buses voltage deviations, number of disconnected buses, number of overloaded cables and number of switch operations. It uses a genetic algorithm to evolve a population of non-dominated solutions, which compose the Pareto front for the problem. This preliminary study used two real-world networks. The first, network A, has with 96 buses, 16 switches and two generators; the second, network B, has 1,645 buses, 158 switches and 4 generators. We present computational results for one contingency example for each network; and for the larger network, we show how the Pareto front evolved with the generations.
2
The network reconfiguration problem
The reconfiguration problem addressed in this study can be described as follows. Given an input distribution network in some initial state, consider the loss of a single branch. If any bus in the network becomes disconnected, find a re-switching strategy that will send the power flow back to the affected buses, taking into account operational limits for voltage and load in all sections of the network. The goal in terms of voltages is to minimize the number of buses without power; and for those buses being supplied, minimize the voltage deviation from 1.0 (measured as per-unit). In addition, minimize the number of branches with load above the operational limits. The final solution should also be reached with a minimum number of switch operations. The genetic algorithm receives as input the physical network and the current state of the switches. Then, a given branch is removed from the network (i.e. all references to it in the network model are removed), simulating an outage. This represents a situation in which the faulty branch has been identified and isolated from the rest of the network. The criteria we use to define high quality reconfigurations are: – Topology: The network has radial topology. – Load : The load on any cable (branch) does not exceed a specific limit. In our tests, that limit was set at 120% of the transmission capacity. – Voltage: The voltage at any bus of the network lies between 0.9 and 1.1 (measured as per-unit). Disconnected buses have zero voltage. – Switches: The reconfigured network state should be reached with a minimum number of switch operations. 2.1
Multi-objective approach
The multi-objective approach optimizes four quality criteria [c1 , c2 , c3 , c4 ]: Pnbuses vdev (i, s) – c1 : Buses voltages = i=1 – c2 : Buses disconnected = nvoltout (s) – c3 : Branches overloaded = nloadout (s) – c4 : Switch operations = nswitches (s)
Where: – – – – – –
s → a solution, i.e. a switching configuration; nbuses → number of buses in the network; vdev (i, s) → voltage deviation from 1.0 p.u. at bus i in solution s; nvoltout (s) → number of buses without power in s; nloadout (s) → number of overloaded branches in s; nswitches (s) → number of switch changes in s.
In addition to that, a penalty P (s) is added to all four criteria ci whenever a reconfiguration induces loops in the network. That penalty is calculated as the number of loops in the network multiplied by a large constant, i.e. P (s) = nloops (s) ∗ M . That penalization guarantees that after the first radial solution is obtained, only radial solutions will be present in the Pareto frontier. Nonradial solutions will be always dominated by any radial solution. On the other hand, this scheme allows the presence of non-radial solutions in the beginning of the evolutionary process, which is an important feature to improve the initial convergence of the population. For more information about the concept of Pareto frontier and solution dominance, and how they are applied to optimisation, we refer the reader to reference [6].
3
Genetic Algorithm approach
Genetic algorithms are population-based search methods that use analogies from the Theory of Evolution to find high quality solutions for complex computational problems [6, 12]. Normally, GAs start with a population of low quality solutions, usually randomly generated, and then ‘evolve’ this population via genetic operators, i.e. crossover, mutation and selection, towards better quality individuals, corresponding to solutions with better objective function values. The genetic algorithm used in this study is described next. 3.1
Pseudocode
The first part of the pseudocode (Figure 1) creates an initial random population of solutions, followed by the calculation of the initial Pareto frontier. Then, in the main loop section, solutions are created via crossover and mutation. If a new solution is not dominated by any solution in the current Pareto frontier, it is inserted into the population, triggering a check and removal of any existing solution that became dominated by the new one. The main loop continues until a time limit is reached. Next we will describe the main elements of the genetic algorithm. 3.2
Objective function and Pareto’s dominance
The objective function of a solution s is represented as a vector of real numbers, with each position associated to one of the four criteria, i.e. f (s) = [c1 , c2 , c3 , c4 ]. The Pareto’s dominance criterion states that solution s0 dominates a solution s00 if ci (s0 ) ≤ ci (s00 ); ∀ ci , 1 ≤ i ≤ 4.
Method MultiObjGeneticAlgorithm begin initializePopulation(pop); updateParetoFrontier(pop); do % main loop parents = selectParents(pop); newSolution = generateOffspring(parents); newSolution = mutate(mutrate , newSolution); insertNewSolution(pop, newSolution); if (inserted ) updateParetoFrontier(pop); while(cpuTime < limit) end Fig. 1. Pseudo-code of the genetic algorithm implemented. Initially, a population of random solutions representing switching strategies is created; and then the algorithm enters the main loop. The main loop iteratively creates new solutions which are inserted into the population depending of whether they are dominated or not by another solution already present. If the new solution is not dominated, it is inserted and the Pareto frontier is then updated to remove if any existing solutions that became dominated by the new one. This process is repeated until a time limit is reached.
3.3
Representation and initialization
The representation and initialization used in this work is the same of Mendes et al. (2010) [14]. Solutions for the problem of switching reconfigurations have a binary representation, with an array of bits of size n representing the states of the n switches. The value ‘0’ indicates open and ‘1’ indicates closed. The initial population is composed of random solutions created by assigning values 0 or 1 to each switch, uniformly at random. The probability is 20% for any given switch to be open, and 80% for it to be closed. This proportion was chosen to match the proportion of open and closed switches in the real networks; and aim at reducing the likelihood of creating solutions with loops or disconnected sections. 3.4
Recombination – selection, crossover and mutation
Parents are selected from solutions in the Pareto frontier. When there is more than one solution in the Pareto frontier, two solutions are randomly selected and a new solution is created via crossover. If there is only one solution in the Pareto frontier, then that solution becomes one of the parents, and the second parent will be a randomly generated solution. The crossover method implemented is a Uniform Crossover (UX) [11], where the value of each switch state in the child solution is chosen uniformly at random from one of its parents. If both parents have the same state for a specific switch (either 0 or 1), the child will inherit that state. If each parent has a different value, then the value inherited can be 0 or 1, with equal probability. As the representation is an array of bits, the logical choice for mutation is the bit-swap [11]. If a solution is selected to go through mutation (according to a probability mutrate ), a switch is chosen uniformly at random, and its state is swapped, either 0 → 1 or 1 → 0.
3.5
Acceptance policy
After a new solution is created, because of the multi-objective nature of the problem and Pareto’s optimality criterion, two steps have to be followed. First, the algorithm verifies if the new solution is dominated by any other solution already present in the Pareto frontier. If so, the new solution is discarded and the algorithm continues. On the other hand, if the new solution is not dominated, it is inserted into the population. After insertion, the algorithm checks whether the new solution now dominates any solution already present. If so, those dominated solutions are removed from the population and the algorithm continues. This acceptance policy guarantees two things. First, the population will not have duplicated individuals. Second, all individuals in the population belong to the Pareto frontier.
4
Computational results
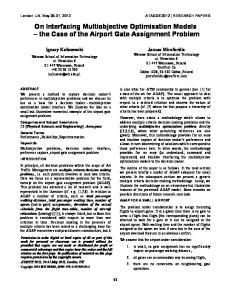
In this section we will show two illustrative contingency examples for the test networks. In Figure 2a we show the small network’s state (network A) as it is normally operated. The network has two generators (‘A’ and ‘B’), marked as rectangles. Hexagons represent switches. Open switches are indicated in white (30, 50 and 92), whereas yellow indicates closed switches (22, 25, 33, 37, 43,
(b) (a)
(c)
Fig. 2. Network A: (a) Diagram of the test network. The two rectangles labeled ‘A’ and ‘B’ represent generators. Yellow/white hexagons represent closed/open switches, respectively. Circles indicate ordinary buses. (b) Depiction of a fault in the cable connecting buses 23 and 24. That fault will cut power supply to the buses indicates in red (24, 25, 27, 28, 29, 49 and 51). (c) Solution 2 from Table 1, with 1 switch operation (switch 30 is now closed) and no disconnected buses.
etc). The circles indicate ordinary buses. The network has all buses connected, voltages are within operational limits and no cables are overloaded. In Figure 2b, we introduce a fault in the cable connecting buses 23 and 24. That fault will cut power supply to the buses in red (24, 25, 27, 28, 29, 49 and 51). After running the multi-objective approach, two solutions compose the final Pareto front (see Table 1). The first one represents the ‘do-nothing’ strategy, with zero switch changes. The second solution is depicted in Figure 2c and requires 1 switch operation. Switch 30 is closed thus redirecting power supply to the affected buses from generator B. That solution has no buses outside operational limits and no overloaded branches. Table 1 shows the reconfiguration results for networks A and B, after an (n-1) contingency situation happens to each of them. The table shows results for the four quality criteria described before. For each of the two networks, we first show the values of those criteria when the network is operating normally, and after the fault is introduced. For network A, the fault cut power supply to 7 buses. For network B, the fault affected the supply to 22 buses. Notice that network B has three overloaded cables under normal operations and the fault reduced that number to two. Then, under the ‘After reconfiguration’ labels, we present the solutions that compose the final Pareto frontier. For network A, there are two solutions; one with no switch operations (‘do-nothing’ strategy) and another with one, corresponding to the solution depicted in Figure 2c. For network B, the final Pareto frontier is composed of four solutions, with zero, one, two and five
Table 1. Reconfiguration results for networks A and B, after an (n-1) contingency situation. For each network, we show the four quality criteria: buses voltages, buses disconnected, branches overloaded and number of switch operations. The table yields the original values for those criteria when the network is operating normally; after the fault is introduced; and for the solutions obtained by the genetic algorithm. For network A, the final Pareto frontier has two solutions; one with no switch changes and another with a single one. For network B there are four solutions, with zero, one, two and five switch changes. Two of those bring power supply back to all buses.
Configuration Original (Fig. 2a) After outage (Fig. 2b) After reconfiguration Solution 1 Solution 2 (Fig. 2c)
Configuration Original After outage After reconfiguration Solution 1 Solution 2 Solution 3 Solution 4
Buses voltages 1.33 8.32 8.32 1.31
Network A - 96 branches, 16 switches Criteria Buses Branches Number of disconnected overloaded switch operations 0 0 – 7 0 – 7 0
0 0
0 1
Network B - 1,645 branches, 158 switches Criteria Buses Buses Branches Number of voltages disconnected overloaded switch operations 29.85 0 3 – 50.73 22 2 – 50.73 30.40 30.12 50.16
22 0 0 12
2 3 3 2
0 1 2 5
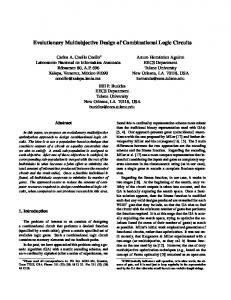
switch operations. Two of those bring power supply back to all buses (solutions 2 and 3). Solution 3, with two switch operations, has a slightly better overall voltage deviation than Solution 2, which has a single switch operation. The solution with five switch operations reduces the number of buses disconnected but does not eliminate them. To illustrate how the quality of the solutions improve as the genetic algorithm evolves, we present Figure 3. That figure depicts the values for the four quality criteria separately (y-axis), and the number of generations in the x-axis. Values were taken from the test for network B. Each data point represents the value for that criterion, for a solution present in the Pareto frontier, in that particular generation. Notice that in generation 1 the values for the Pareto frontier solutions are all very poor. Voltage deviations are very high; the number of buses disconnected is over 450; and the number of switch operations is also very high. As the genetic search progresses, we see a steady decline in the number of switch operations from over 40 down to less than 10 by generation 50. Voltage deviations and number of disconnected buses decline as well, but at a slower pace, until between generations 40 and 50, when there is a steep drop. The four criteria continue to improve until generation 220, when we obtained the final Pareto frontier configuration. The configuration of the genetic algorithm is as follows. In each generation, 20 new individuals are created, and each of them has a 1% change of going
Fig. 3. Quality improvement of the solutions in the Pareto frontier for network B. The four quality criteria are depicted separately. The x-axis depicts the number of generations. Each data point represents the value for that criterion, for a solution present in the Pareto frontier, in that particular generation. Notice the steady improvement of the four criteria, as the random solutions from generation 1 evolve into higher quality solutions by generation 220.
through mutation (mutrate = 0.01). The number of individuals created in each generation is not critical in our genetic algorithm design, as no intermediate population is created between generations. Individuals are continuously being created/inserted/removed from the population. The value of 20 new individuals per generation was determined because the tests were conducted in a multithreading environment, with 20 threads executing independent power flow calculations. The CPU time for each of the tests was small. Network A required less than 30 seconds to converge, whereas network B required less than 4 minutes. The two tests shown in this study were run on a Dual Intel Xeon X5650 six-core computer. The software was implemented in Java, version 1.6.0 21-ea 64-bit.
5
Conclusion
This paper introduced a genetic algorithm approach for the multi-objective version of the power restoration problem after an (n-1) contingency situation. Two real-world networks were tested; one with 96 buses and 16 switches, and another with 1,645 buses and 158 switches. The multi-objective approach produced a population of non-dominated solutions in which four criteria are optimized: summation of voltage deviations, number of buses still without supply after the reconfiguration, number of overloaded branches and number of switches operations. A table with the solutions obtained for the two tests is shown. For the large network, we describe the convergence of the genetic algorithm by plotting the evolution of the four criteria in the individuals composing the Pareto frontier, as the generations progress. The ability of the genetic algorithm to consistently improve the solutions is clearly observed. As future research we will add the possibility of tap-changer transformers adjustments as part of the network reconfiguration strategy.
Acknowledgement The authors wish to thank Ausgrid for providing the network data for this study.
References 1. Aoki, K., Kuwabara, H., Satoh, T., Kanezashi, M.: Outage state optimal load allocation by automatic sectionalizing switches operation in distribution systems. IEEE Transactions on Power Delivery 2, 1177–1185 (1987) 2. Aoki, K., Nara, K., Itoh, M., Satoh, T., Kuwabara, H.: A new algorithm for service restoration in distribution systems. IEEE Transactions on Power Delivery 4, 1832– 1839 (1989) 3. Aoki, K., Satoh, T., Itoh, M., Kuwabara, H., Kanezashi, M.: Voltage crop constrained restoration of supply by switch operation in distribution systems. IEEE Transactions on Power Delivery 3, 1267–1274 (1988a) 4. Augugliaro, A., Dusonchet, L., Sanseverino, E.R.: Evolving non-dominated solutions in multiobjective service restoration for automated distribution networks. Electric Power Systems Research 59, 185–195 (2001)
5. Bertoli, P., Cimatti, A., Slaney, J., Thibaux, S.: Solving power supply restoration problems with planning via symbolic model-checking. In: Proceedings of the 15th European Conference on Artificial Intelligence, pp. 576–580. IOS Press (2002) 6. Deb, K.: Multi-Objective Optimization Using Evolutionary Algorithms. John Wiley & Sons, USA (2009) 7. Dialynas, E.N., Michos, D.G.: Interactive modeling of supply restoration procedures in distribution system operation. IEEE Transactions on Power Delivery 4, 1847–1854 (1989) 8. Ferreira, L.A.F.M., Grave, S.N.C., Barruncho, L.M.F., Jorge, L.A., Quaresma, E., Carvalho, P.M.S., Martins, J.A., Branco, F.C., Mira, F.: Optimal distribution planning - increasing capacity and improving efficiency and reliability with minimalcost robust investment. In: Proceedings of the 16th International Conference and Exhibition on Electricity Distribution, pp. 5.21.1–5.21.5. IEE Press (2001) 9. Fujii, Y., Miura, A., Tsukamoto, J., Youssef, M.G., Noguchi, Y.: On-line expert system for power distribution system control. Electrical Power & Energy Systems 14, 45–53 (1992) 10. Garcia, V.J., Franca, P.: Multiobjective service restoration in electric distribution networks using a local search based heuristic. European Journal of Operational Research 189, 649–705 (2008) 11. Goldberg, D.: Genetic Algorithms in Search, Optimization, and Machine Learning. Addison-Wesley Professional, USA (1989) 12. Goldberg, D., Sastry, K.: Genetic Algorithms: The Design of Innovation. Springer, USA, 2nd edn. (2010) 13. Kim, H., Ko, Y., Jung, K.H.: Algorithm of transferring the load of the faulted substation transformer using the best-first search method. IEEE Transactions on Power Delivery 7, 1434–1442 (1992) 14. Mendes, A., Boland, N., Guiney, P., Riveros, C.: (n-1) contingency planning in radial distribution networks using genetic algorithms. In: Proceedings of the IEEE/PES Transmission and Distribution Conference and Exposition: Latin America, pp. 290–297. IEEE Press (2010) 15. Miu, K.N., Chiang, H.D., Bentao, B., Darling, G.: Fast service restoration for largescale distribution systems with priority customers and constraints. IEEE Transactions on Power Systems 13, 789–795 (1998) 16. Perrier, N., Agard, B., Baptiste, P., Frayret, J.M., Langevin, A., Pellerin, R., Riopel, D., Trepanier, M.: A survey of models and algorithms for emergency response logistics in electric distribution systems - part I: Reliability planning with fault considerations. Technical Report n. 2010-05 - Interuniversity Research Centre on Enterprise Networks, Logistics and Transportation (CIRRELT) pp. 1–34 (2010) 17. Perrier, N., Agard, B., Baptiste, P., Frayret, J.M., Langevin, A., Pellerin, R., Riopel, D., Trepanier, M.: A survey of models and algorithms for emergency response logistics in electric distribution systems - part II: Contingency planning level. Technical Report n. 2010-06 - Interuniversity Research Centre on Enterprise Networks, Logistics and Transportation (CIRRELT) pp. 1–41 (2010) 18. Thibaux, S., Cordier, M.O., Jehl, O., Krivine, J.P.: Supply restoration in power distribution systems – a case study in integrating model-based diagnosis and repair planning. In: Proceedings of the 12th Conference on Uncertainty in Artificial Intelligence, pp. 525–532. Morgan Kaufmann (1996) 19. Toune, S., Fudo, H., Genji, T., Fukuyama, Y., Nakanishi, Y.: A reactive tabu search for service restoration in electric power distribution systems. In: Proceedings of the IEEE Intl. Conf. on Evolutionary Computation, pp. 763–768. IEEE Press (1998)