Proceedings of the International Conference on Trends & Advances in Computation & Engineering (TRACE), 25-26 February 2010
Multi Resolution Feature Based Active Handwritten Character Recognition Gaurang Raval and K. Kotecha*
Abstract: This paper is based on hierarchical classification technique for offline recognition of handwritten characters. Different feature extraction methods are designed for different representations of characters such as solid binary characters, character contours, skeletons or gray level images of each individual character. The problem of choosing the appropriate feature extraction method is related with a given application. Multi-Resolution features are used in this implementation. The traditional method follows the static model for recognition. This recognizer uses the dynamic and hierarchical classification method for character recognition. Keywords: Multi resolution, active recognition, handwritten characters, critical points.
1. INTRODUCTION Optical character recognition is one of the most successful applications of automatic pattern recognition. Today reasonable good packages can be bought at lower prices. However these are only able to recognize high quality printed text or neatly written hand-printed text. The current research in OCR is now addressing documents that are not well handled by the available systems, including severely degraded and unconstrained handwritten text. Also efforts are being made to achieve lower error rates and reject rates. Our work focuses on recognition of isolated characters. A Pattern Recognition System comprises of all or some of the following steps: Data Collection, Registration, Preprocessing, Segmentation, Normalization, Feature Extraction, Classification, Postprocessing, Feedback between Stages, Trainable Parts in a System etc. Feature extraction problem is that of extracting from the raw data the information which is most relevant for classification purposes. During the feature extraction process, the dimensionality of data is reduced. The most crucial step in the process of pattern recognition is classification. All the preceding stages should be designed and tuned for improving its success. The operation of the classification phase can be simplified as being a transform of quantitative input data to qualitative output information. All the stages of a pattern recognition system contain parameters or variables which need to be given appropriate values. In this implementation five modules are used, namely Preprocessing, Normalization, Feature Extraction, Classification and feedback between stages. 2. FEATURE EXTRACTION REVIEW Each distinct bit of information about objects is called feature. Raw data often contains too much nonessential information, so feature extraction is used to get information suitable for use in classification. The choice of feature extraction method limits or dictates the nature and output of preprocessing step. Some feature extraction methods are displayed in Table 1 by the representation form following the taxonomy by (17) and (4) but rearranged and grouped, and few methods have been added. GSC Features (16) the most promising one among all are 512 binary valued features representing Gradient, Structural, Concavity characteristics of the image. Choice of features motivated by belief that multiscale features have the best * Institute of Technology, Nirma University, Ahmedabad, India-382481, E-mail:
[email protected] and
[email protected]
964
Proceedings of the International Conference on Trends & Advances in Computation & Engineering (TRACE)
chance of capturing the difference between classes of digits or characters. 192 Gradient features (finest scale), 192 Structural features (intermediate scale), 128 Concavity features (coarsest scale). All the feature extraction methods are used in conjunction with classification methods like K-Nearest Neighbor, Neural networks, Tangent distance classifiers etc. Table 1 Different Feature Extraction Methods Applicable to Specific Representation Feature Extraction Methods
Representation Form Gray Scale
Binary Solid
Binary Contour
Vector Skeleton
Template Matching
Deformable Templates
Unitary (KL) Transform
Zernike Moments
Projection Histograms
Contour Profiles
Chain Codes
Fourier Descriptors
Discrete Features
Zoning
N-tuple Method
GSC Features
Concavity Features
DDD Features
3. ACTIVE RECOGNITION The GSC recognizer achieves maximum accuracy among the feature extraction methods stated above. GSC Recognizer Classifies using K-Nearest Neighbor rule. GSC recognizer is suffering from the problem of excessive memory usage. GSC recognizer follows static model. Traditional methods design a recognition engine which follows a static model with a fixed feature space where One model fits all strategy is applied (11), 1. 2. 3. 4.
A set of features and a classification method are developed Dimensions of the feature vector are fixed Distance or confidence metric considered as the threshold of recognition acceptance is fixed Equal computational resources available to all test patterns.
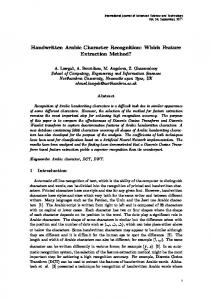
Fig. 1: Mapping Classifier with Feedback
Multi Resolution Feature Based Active Handwritten Character Recognition
965
The Fig. 1 shows the diagram of a recognizer where multi resolution features are used with feedback mechanism. A recursive computational model for handwritten character recognition works on mainly two concepts: (1) altering recognition action using feedback and (2) evaluating and regulating terminating conditions actively for dynamic and interactive recognition. The recognizer begins with features extracted in a coarse resolution and focuses on smaller sub-images of the character on each pass thus effectively working with a finer resolution of a sub-image each time till the classification meets acceptance criteria. In other words, successive passes render the same features at a finer resolution. 4. MULTI RESOLUTION FEATURES In character recognition problem, the similarity between a training set and an actual input stream is relatively weak and even in training set, homogeneity in shape within a class is not so strong. Using a high dimensional feature space is one of the solutions to deal with the poor homogeneity in order to add discriminatory power to a classifier. In a cost-optimal approach, selection of features usually generates a trade-off problem between the computational and storage cost and the recognition performance. Solution to this tradeoff dilemma is simulation of multi resolution features (12). It Focuses on global features initially then concentrates on local features, uses a hierarchical division rule such as quad-trees and quin-trees. The number of features are kept small to begin with and focuses on the level 1 to level n sub-images step by step. Features extracted in earlier passes correspond to coarse global features while those in later passes provide local features.
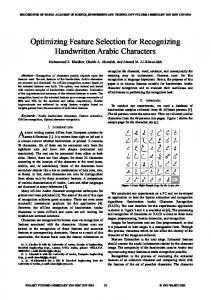
Fig. 2: Multi Resolution Feature Space
Quad-Tree Formation: The Binary contour of the character can be achieved using one of the edge detection algorithms. The bounding box is defined as the smallest rectangle enclosing a character contour. The bounding box of a character image is divided into four rectangular regions. The center of mass of the contour is first computed. A vertical and horizontal line through the center of mass determines the four regions. Subsequent layers of the quad tree are successively constructed by the same method. Quin-Tree Formation: The Quin-tree is similar to quad tree except there is fifth sub-region which is located in the central area formed by joining the centers of the other four sub-regions. Figure 2 shows the quin-tree of level 3.
966
Proceedings of the International Conference on Trends & Advances in Computation & Engineering (TRACE)
5. IMPLEMENTATION Implementation part was carried out with Matlab image processing tools. Binarizing: The image stored as a grayscale image is binarised. The bounding box is calculated. Image thinning or thickening is applied as per the image contents. Image Representation: The binarised image is represented by piecewise linear contours for basic image representation in this implementation. In order to generate piecewise linear contours, the pixel based contours were first obtained from an input image using the Canny’s edge detection method. An equally weighted window (Fig. 3) is applied to a contour component and its neighbors to obtain the curvature at that point (12). The window size Nw is determined by the height of the bounding box and the image density. Image density is obtained from the ratio of the number of black pixels to the size of the bounding box. kw is a control parameter in Eq. 1 (10).
Fig. 3: Convolution Kernel – a, b
Nw = 2 * kw * height * density + 1
... (1)
Two Convolution kernels (12) shown in Fig. 3 (a, b) is applied to the input image one estimating the gradient in the x-direction (columns) and the other estimating the gradient in the y-direction (rows). θ = atan (Gy /Gx)
... (2)
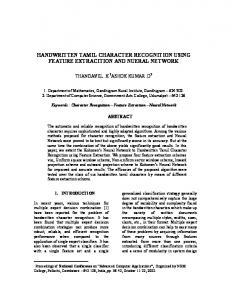
Whenever the gradient in the x direction is equal to zero, the edge direction has to be equal to 90 degrees or 0 degrees, depending on what the value of the gradient in the y-direction is equal to. If Gy has a value of zero, the edge direction will equal 0 degrees. Otherwise the edge direction will equal 90 degrees. Contour points which have θ > 0.7 are identified as critical points. The threshold to select the critical point is chosen as 0.7, the reason is shown in Fig. 4. Selection of θ threshold is very important in finding the critical points. Contour segments between adjacent critical points are approximated to be linear. Sub-images: A variable size rectangular grid is used to define sub-images for the quad tree. The center of mass of the contour is first computed. Third image in the Fig. 6 shows the bounding box for the image. The bounding box of a character image is divided into four rectangular regions using the center point as shown in Fig. 5 (4). A vertical and horizontal line through the center of mass determines the four regions for the quad tree. Subsequent layers are successively constructed using the same method. Quad trees with a maximum depth of 3 were implemented. Figures 5 (5), 5 (6) show sub-regions for each layer.
Multi Resolution Feature Based Active Handwritten Character Recognition
967
Fig. 4: Critical Points
6. FEATURE EXTRACTION Two types of contour histogram in gradient and moment based projections are used as feature extraction methods (10). Eight bit binary feature vector for each sub-region in the quad tree representation is generated after binarization of feature measurement. Contour slope angles are quantized in the pairs of π/4 slots that are opposite to each other labeled 0 to 3 in Fig. 6. The angle between the horizontal line and the linear contour piece is the slope angle of the contour segment. Gradient feature measurement Xigrad is determined by the ratio of the total contour length Rigrad corresponding to the contour segments whose slope angle falls in division i (0, 1, 2 or 3) and the total contour perimeter Rtotal in that sub-image. Xigrad = Rigrad / Rtotal
... (3)
Moment features are used to obtain other four bits. A moment measurement Ximoment is defined by the ratio of the length Rimoment of the sum of contour segments which are present within a sub-image i to the total contour perimeter Rtotal. Both Xigrad and Ximoment are binarized using the threshold XTgrad and XTmoment respectively. If the feature value is less than threshold then it is set to zero and if it is greater than threshold then it is set to one. The threshold values are uniformly set at 0.2 for both gradient and moment feature measurements. Ximoment = Rimoment /Rtotal
... (4)
Quad-Tree here is constructed using the array in matlab. A 4 × 64 array is used for quad-tree. There are 1 + 4 + 16 + 64 = 85 nodes in the quad-tree with 4 levels. All nodes are programmed as a structure containing various required variables and parameters for every node. The structure contains Xmin, Xmax, Ymin and Ymax of the quadrant, the portion of the image in the specified quadrant range, co-ordinates of center of mass of the quadrant, co-ordinates of the critical line segments falling in that quadrant and lastly the eight feature bits are stored as an array.
968
Proceedings of the International Conference on Trends & Advances in Computation & Engineering (TRACE)
Fig. 5: Quadtree with Depth of 3
In this implementation the features are computed up to third level of the quad-tree. Every sub-image is having 4 gradient feature and 4 moment features. So total there are 1 + 4 + 16 = 21 sub-images up to third level. Total number of features therefore are 21 * 8 = 168. Two more features are used, that is number of loops in the image. Maximum 170 features are computed out of the quad-tree up to level three. 7. TRAINING For generating the handwritten images, around 35 handwriting font styles are used. The small letters – as.jpg, bs.jpg...zs.jpg, capital letters – ac.jpg, bc.jpg...zc.jpg, digits are saved as 0.jpg, 1.jpg...9.jpg. File naming convention is exploited during training to remember the class of the input image. For every font
Multi Resolution Feature Based Active Handwritten Character Recognition
969
style two different matlab data files are prepared with array of size 171 × 10 and array size 171 × 52 for digits and letters respectively. Total 13 font styles were used to prepare the matlab data files. The training details are shown in the Table 2.
Fig. 6: Gradient Feature Generation: (a) Gradient Division (b) Gradient Angle Measure Table 2 Training Log Type of letters
No of Sets
Total Images
FE Failed
Training Images
Capital
13
338
15
323
Small
13
338
19
319
Digit
13
130
3
127
The feature extraction was not able to process few images in the training set so those images are rejected. 8. CLASSIFICATION Two methods are used for classifying the test set of the character images. 1. k-Nearest Neighbor 2. Probability based classification In a k-Nearest Neighbor (k-NN) classifier, each class is represented by a set of prototype vectors. The k closest neighbors of an input pattern vector x are found among all the prototypes, and the majority rule determines the class label. For the k-NN method, 7 prototypes were selected as shown in Table 3. All seven prototypes were stored as a two dimensional array of size 171 × (7 × 26) for small letters and capital Letters and for digits the array size is 171 × (7 × 10). Table 3 Classification-k-Nearest Neighbor Based (k = 3) Type of Letters
No. of Prototypes
No. of Test Images
No. of Correctly Classified Images Classification Rate %
Capital
7
280
215
76.80
Small
7
105
84
80.00
Digit
7
219
171
78.08
970
Proceedings of the International Conference on Trends & Advances in Computation & Engineering (TRACE)
All the (26 × 7) images are compared feature by feature with input image, that is all 170 features of the input image are compared with all 170 × (7 × 26) prototype features. The matching prototypes are stored in descending order with number of matching features and the character class. The class of the input image is decided by selecting the majority class of prototypes in the sorted array. The probability based classification is an active method of classification. The array prepared by the training process is utilized here. Out of 13 matlab data files, one file is prepared containing two dimensional array of size 171 × 26 for alphabets and 171 × 10 for digits. Every column of this file is calculated as follows: The first font style matlab data file is picked and it is applied to the probability array. There are 170 features for every character. There are 26 such columns in the matlab data file. If the value of a particular feature in a column (a character) of the font style file is one, then the value of that feature index in the probability array is incremented by one. For example if a particular feature out of 170 features is on in every image then the value of that feature index in the probability array will be 13, that is total number of training font styles. Table 4 Classification – Probability Based Type ofletters
No. of Test Images
No. of correctly Classified Images
Classification Rate %
Capital
227
187
82.38
Small
123
103
83.74
Digit
115
95
82.61
The last value in the probability array remembers how many times a particular character has appeared in the training set. That is, if features of a character (a-z, A-Z or 0-9) are applied to probability array then the last value in the corresponding column of the probability array is incremented by one. When all 170 features of every column in the probability array are divided by the last value of every column, count of the character appearance, the probability of a particular feature to be on for the specific character will come out. This probability array is used in classification. In the first attempt to classify the input image the quad-tree is explored up to second level only. Total 42 features are used in the first attempt. At the first level there is only one node, so 8 features of the first node are at level one. At the second level there are 4 nodes so total 8 × 4 = 32 features. The remaining 2 features are related with the number of loops in the image. All 42 features of the input image are compared with the probability array. If there are no such probability values then the recognition acceptance threshold is lowered to 0.9 instead of one and again the same algorithm is repeated. If with 0.9 also there are no match threshold is reduced to 0.8 and the same process is repeated. If after this there are no match then the number of features are increased from 42 to 170, that is the quad-tree is explored up to third level. All 170 features are compared with the same logic with the probability threshold 1.0, 0.9 and 0.8. So this is how the probability based classification is active and dynamic as compared with traditional passive recognition systems. This classification method is adaptive, dynamic as well as hierarchical. At different levels of classification the recognition acceptance threshold is changed dynamically and the number of features to be used also changes in two levels, 42 and 170. Table 4 shows the performance of the recognizer which uses multi-resolution features and dynamism in classification. 9. CONCLUSION AND FUTURE WORK The classification rate of probability based method is higher than k-NN method. Only few images are considered as prototypes in k-NN method so actually it remembers the training images. k-NN method is very much dependent on the prototypes which are compared with the input image to find the nearest neighbor. k-NN space requirement is N times more than probability based method where N is number of prototypes selected. In Probability based classification method with quad-tree of level 3 the array size is 171 × 26 for alphabets. For k-NN method with quad-tree of level 3 the array size is 171 × 26 × N. OCR
Multi Resolution Feature Based Active Handwritten Character Recognition
971
implementation (12), which uses hierarchical feature space, is not clipping the critical segments against the sub-image quadrants in feature extraction. It can not process the images which are only one pixel thick or images which are very thin. It uses the binarized value of feature vector. So it needs large amount of space to prepare the look up table which is used during classification. For example with quad-tree of level 4 it needs 28 × 85 = 21760 per class. In probability based method with quad-tree of level 4 the space requirement is 85 × 8 = 680 locations per class to store integer values. Probability based method considers large number of images and for that it prepares the probability array. There are two more features added here, except 168 features to increase the classification power. The two features are no of loops in the image. Probability based method starts with maximum separability, that is the acceptance threshold is kept 1.0. Gradually it reduces the separability constraint to recognize the character with high resolution features. It uses less computational power and space compared to OCR (12), GSC recognizer (16). Higher recognition rate can be achieved by exploring the higher level of quad-tree. This concept can be generalized to process characters of any language because it actually considers the characters as objects with different shapes and in that it finds the features. REFERENCES [1] M. Blumenstein and B. Verma, “A Novel Feature Extraction Technique for the Recognition of Segmented Handwritten Characters”, IEEE (2003). [2] Eric Brown, “Character Recognition by Feature Point Extraction”, (1992). [3] Herniter, “Programming in Matlab”, Thomson Learning. [4] Jorma Laaksonen, “Comparison of Neural and Statistical Classifiers”, Tech.report, 1996. [5] Huanfeng Ma, Adaptice “Hindi Ocr using Generalized Hausdorff Image Comparison”, (2003). [6] Szmurlo Maurycy, “Ocr PG Thesis, Master’s Thesis”, 1995. [7] M. Morita and C.Y. Suen, “A Recognition and Verification Strategy for Handwritten Word Recognition”, ICDAR, 2003. [8] Marisa Emika Morita, “Automatic Recognition of Handwritten Dates on Brazilian Cheques”, Ph.D. thesis, 2003. [9] Atul Negi, “Extraction and Recognition of Text in Telugu Document Images”, IEEE (2003). [10] Jaehwa Park, “Hierarchical Character Recognition and its use in Handwritten Word/Phrase Recognition”, Ph.D. thesis, 1999. [11] Jaehwa Park and Venu Govindaraju, “Active Character Recognition using a*-Like Algorithm”, center of excellence for document analysis and recognition (cedar), IEEE (2000). [12] Jaehwa Park, Venu Govindaraju, and Sargur N. Srihari, “Ocr in a Hierarchical Feature Space”, IEEE Transactions (2000). [13] Hamed Pirsiavash and Farbod Razzazi, “Design and Implementation of a Hierarchical Classifier for Isolated Handwritten Persian/Arabic Characters”, International Conference on Signal Processing, September 2003. [14] Bekant Savas, “Analysis and Test of Handwritten Digit Recognition Algorithms”, Master’s thesis, 2003. [15] Anshu Sinha, “An Improved Recognition Module for the Identification of Handwritten Digits”, Master’s thesis, 1999. [16] Sargur Srihari, C. Tomai, and S. Lee, “Individuality of Numerals”, International Conference on Document Analysis and Recognition (Edinburgh,Scotland), August 2003. [17] Triar, Jain, and Taxt, “Feature Extraction Methods for Character Recognition – survey”, (1995).