Abstract-Maintaining brightness and preserving image contrast can be challenging when tone mapping wide dynamic range (WDR) images. In this paper, we ...
2017 IEEE 7th International Workshop on Computational Advances in Multi-Sensor Adaptive Processing (CAMSAP)
Multi-scale Histogram Tone Mapping Algorithm for Display of Wide Dynamic Range Images Jie Yang, Alain Hare, Ulian Shahnovich, Orly Yadid-Pecht Fellow, IEEE Integrated Intelligent Sensors Laboratory (I2Sense) Lab, Schulich School of Engineering, University of Calgary 2500 University Drive NW, Calgary (Alberta), TIN lN4, Canada Email: {jie.yang2.abore.orly.yadid-pecht}@ucalgary.ca
Abstract-Maintaining brightness and preserving image contrast can be challenging when tone mapping wide dynamic range (WDR) images. In this paper, we present a novel tone mapping algorithm for compressing of WDR images. The algorithm processes WDR images in different scales. The overall brightness consistency and fine details are well preserved in large and small scales, respectively. A fusion method based on a multi-scale guided image filter is also proposed to synthesize all scales to generate the final image. Integral image and integral histogram are utilized in this algorithm which greatly reduces computation complexity and processing time. Experimental results show that our algorithm can produce visually appealing images with good brightness and high local contrast. I.
INTRODUCTION
Wide dynamic range (WDR) is becoming more and more popular and it is highly demanded in fields such as photography, security monitoring and consumer electronics. The dynamic range of a scene, image or imaging device is defined as the ratio of the highest to the lowest luminance or signal level. The dynamic range of a natural scene can reach up to 120 dB which exceeds the dynamic range of almost all modem cameras taking photographs with a limited exposure range. As a result, the images suffer loss of details in the bright or dark regions. WDR can compensate for this loss of detail by combining multiple low dynamic range images taken with different exposure levels [1]. However, the dynamic ranges of traditional display devices such as LCD, CRT and LED are usually limited to 8 bits, hence tone mapping need to be performed on the WDR image to permit its display on the screen. The purposes of a tone mapping algorithm are to compress the dynamic range of WDR images to the dynamic range of LDR display devices and maintain brightness and contrast as much as possible. WDR tone mapping operators (TMO) in the literatures are mainly classified as global and local operators. Global operator applys a function to all pixels in the image where identical pixels are given an identical value that is irrelevant to their neighbouring pixel distributions. Tumblin and Rushmeiers method was considered as one of the first global TMO and was introduced in 1993 [2]. This method aims at matching the perceived brightness of displayed image with that of the scene. Later in 1994, Ward [3] published his global TMO, instead of brightness, it aimed to match perceived contrast between displayed image and that of the scene. In 2003, Drago et al. [4] proposed an adaptive 978-1-5386-1251-4/171$31.oo@2017IEEE
logarithmic mapping method that can change the base of the logarithmic function based on the brightness, it is one of the most influential TMOs. Recently, Hore et al. [5], [6] proposed a hybrid mapping algorithm and its hardware implementation [7] which takes local image statistics into account. However, as the tone mapped images of global TMOs suffer from low brightness, low contrast and loss of details due to its global compression, local TMOs emerged. Motivated by the function of the human visual system, there are some local TMOs trying to mimic the dynamic range compression process of our photoreceptors [8]-[10]. Although these approaches may be effective in reducing the dynamic range, the toned image represents the internal representation rather than the luminance which is more expected by our eyes. WDR compression can also be regareded as an optimization problem. Mantiuk et al. [11] considered the tone mapping as a minimum visible distortion problem. Ma et al. [12] proposed a tone mapping method by optimizing the tone mapped image quality index. However, optimizing a single metric can hardly guarantee the best result. Additionally, solving constrained optimization problem can be computationally expensive and difficult to implement in real-time. In recent years, some algorithms show state-of-the-art level quality [13]-[17]. They are based on the Retinex theory [18], [19]. WDR image is separated into two channels, namely illuminance and reflectance channels. The illuminance channel is regarded as less important for our visual system, thus its dynamic range is greatly compressed. By contrast, the reflectance channel is treated as important detail whose information is mostly preserved.
In this paper, we present a novel multi-scale tone mapping algorithm (MS-Hist) for displaying wide dynamic range images. In this work, pixel is tone mapped based on multiple piece-wise linear functions built upon multiple scale local histograms. The algorithm uses small scale to maintain local contrast and uses large scale to preserve image consistency. Fusion between all scales is carried out to generate the final image. This paper is organized as follows. In Section II, we introduce the multi-scale tone mapping algorithm and its optimization in detail. Experimental results and comparison with other algorithms are reported in Section ill, and we conclude the paper in Section N.
2017 IEEE 7th International Workshop on Computational Advances in Multi-Sensor Adaptive Processing (CAMSAP)
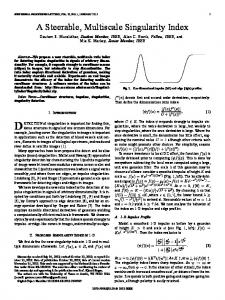
Fig. 1: (a). Tone mapping function is based on histogram in logarithmic domain. (b) Toned image uses block size which equals to image height and width. (c) Toned image uses block size which equals to half image height and width (d) Toned image uses block size which equals to quarter image height and width. Radiance maps courtesy of corresponding author(s).
II.
THE PROPOSED ALGORITHM
A. The Algorithm Fig. 1 (a) shows the basic operations of the MS-Hist algorithm. In a WDR image, for all pixels in an arbitrary window W, we can extract an n-bin histogram. I on the X-axis represents the logarithmic luminance of the WDR image. d on the Y-axis is the luminance of the displayed values. The constant width between any two adjacent bins bk and bk+l is equal to (lma", - lmin)/n. lma'" and lmin are the maximum and minimum pixel values of window W in logarithmic domain. We denote the k-th segment of the piece-wise linear function as:
d ak
= akl
+ bk
(1)
and bk are computed by: ak =
bk =
where Uk
Uk - Uk-l k k
lma'" -lmin Uk -
(2)
ak • l:;"a",
D = E:-IPi ~n .' rna", L...i=lP,
(3)
l:;'a", and l:;"in are the maximum and minimum values in the k-th bin. Pi is the number of pixels that fall into the i-th bin of the histogram. D ma", is the maximum display level of the visualization device (usually 255). The above equations ensure that the tone mapping in an arbitrary window W is monotonically increasing, thus avoid any 'halo' artifacts. To compute the result of the whole image, we slide the window pixel by pixel and at each step, the toned value for the center pixel is computed. Fig. 1 (b)-(d) show toned images for different window sizes. In Fig. l(b), the window size is the size of image and the window size is 1/2 and 1/4 of the image size for Fig. 1 (c) and Fig. 1 (d), respectively.
Fig. 2: a value computed in different scales. (a) W is size of image. (b) W is half size of image. (c) w is quarter size of image. (d) w is 1/8 size of image. (e) w is 1/16 size of image. (0 w is 1/32 size of image.
The three images show visually very different results. It is easy to understand because the pixel distribution varies with the window size, therefore the function and the result would also be different. The images tone mapped with smaller window size reveal more details of the WDR image and make the image brighter, but there are some artifacts in uniform areas, such as the ground area in Fig. 1 (d). This is because in uniform areas, pixels are more likely falling into the same bin of the histogram. Consequently, ak in Eq. 1 becomes a very large number and any small fluctuations in uniform areas are significantly exaggerated. By contrast, as shown in Fig. 1 (b), an image toned with a large window size can maintain more global brightness consistency and no artifacts are visible. We regard this window size as scale. In the rest of this paper, we use the two terms, window size and scale interchangeably. It is important to maintain the brightness consistency and also preserve the details so that a good image can be obtained. To achieve this goal, we intend to tone map pixels in detail and textural areas with a smaller window size and tone pixels in uniform areas with a larger window size. Therefore, we need to detect uniform and texture areas in WDR images first. There are a number of statistics such as entropy or measures of dispersion that can be used for detecting uniform areas. In our case, we use the recently proposed guided image filter [20] to finish the task. Guided image filter assumes that the filtering output 0 is a linear transformation of the guidance image I in a local window
2017 IEEE 7th International Workshop on Computational Advances in Multi-Sensor Adaptive Processing (CAMSAP)
W
centered at pixel k: Oi =
The coefficient
akIi
+ bk ,
Vi
E Wk
(4)
is computed by:
ak
I~I
ak =
EiEWk IiPi -
a~
+E
f.."kPk
(5)
Wk denotes the window and P is the input image. In our implementation, the input image and guidance image are the same (I == p). Then, Eq. 5 becomes: 2 a k_ ak = _ _
a~
(6)
+E
where a~ is the variance of window Wk, E is a regularization parameter given by the user. we use Eq. 6 to detect uniform and texture areas in multiple scales. In a high variance window, a~ ~ E, ak will be close to 1, which represents that the centre pixel is in a texture area. In a low variance window, a~ ~ E, ak will be close to 0, which represents that the centre pixel is in a uniform area. We can change the window size to detect uniform and texture areas in different scales. Fig. 2 visualizes the ak value for each pixel in different scales. Bright pixels mean the computed ak value is close to one and dark pixels mean that it is close to zero. It can be seen that in smaller scales, the ak parameter can better preserve details such as edges and textures. We use Eq. 1 and Eq. 6 to get the pixel value dWi and corresponding a Wi under window size Wi. At each pixel location, we fuse the values using the following equation: d
=
",,8-1
L...-i=1
i
aWi
",,8-1
L...-i=1
d .
wi
at,i
(7)
In Eq. 7, s is the number of scales that are used for fusion. Larger subscript i indicates smaller scale. In a textural area,
a w · is close to 1, a~. will also be close to 1, which will gi~e more weights to' small scales. In a uniform area, aWi is close to 0, a:-V i will attenuate to 0 rapidly, and gives less weights to smaller scales. Eq. 7 gives more weight to larger scales to make sure that there are no artifacts in the tone mapped image.
B. Optimization
The proposed MS-Hist algorithm involves large amounts of histograms and variance computations. In our approach, we adopt integral image [21] and integral histogram [22] to reduce computation complexity and processing time. The variance value a~ is computed by: 2
aw =
Ew 1 2 - (Ew 1)2 IwI 2
(8)
The main computational burden is the calculation of Ew 1 2 and E w I. Fortunately, the two values can be efficiently computed in O(N) time using the integral image technique. Histogram of an arbitrary window is another heavy computational burden, similarly it can be solved with the help of the integral histogram technique. Consider a nbin histogram, it takes four operations (two addition and two subtraction) to compute the population per bin, hence there are 4 x n operations needed to get the histogram of
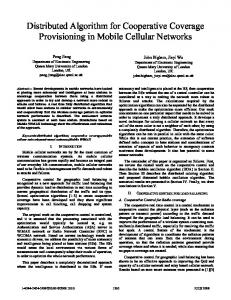
Fig. 3: Images before and after tone mappping of the proposed MS-hist algorithm. First and third rows show the original WDR image (processed for visualization). Second and fourth row show the tone mapped image. Radiance maps courtesy of corresponding author(s).
an arbitrary window. The integral image and the integral histogram only need to be computed once for the use of the entire algorithm. III.
IMPLEMENTATION AND RESULTS
The WDR color images have red, green, blue three channels, but our algorithm operates on the luminance channel. Consequently, we first convert the WDR image to luminance image by using equation below : L
=
0.299R + 0.587G + 0.114B
(9)
In our experiments, we choose n in Eq. 1 as 10, s in Eq. 7 as 8. The resulting luminance images are converted back to color channel using the same method reported in [23]. Some images that tone mapped with the proposed MSHist algorithm are shown in Fig. 3. The images are overall bright, showing good contrast and no artifacts are visible. In Fig. 4, we compare the famous memorial church image with three recently reported effective tone mapping algorithms which show state-of-the-art results. Our result looks brighter than both [17] and [14]. We have approximately the same brightness level with [16]. In the zoom area, our result preserves more details and contrast when compared with the other three algorithms. We use overall brightness, sharpness, local standard deviation value to measure and compare our algorithm with the other three algorithms numerically. The brightness value Q; and sharpness values f3 are computed using the following equation: Q;
=
1 N
L
IV'II, f3 =
1 N
LI
(10)
2017 IEEE 7th International Workshop on Computational Advances in Multi-Sensor Adaptive Processing (CAMSAP)
TABLE I: Measurement for Fig. 4 Algorithm
Brightness
Sharpness
Retinex [14] Paris [17] Gu [16] Ours
104.6918 85.2719 110.0256 115.1672
8.4610 9.4782 13.1790 14.8941
Standard deviation 20.2661 20.5401 33.5289 34.7047
value for overall brightness, sharpness and local standard deviation. The implemented Matlab codes take about 1.5 seconds on a PC with Intel Core is 3.2GHz CPU and RAM 16GB for an image of one megapixel. IV.
CONCLUSION
In this paper, we have presented the MS-Hist algorithm for displaying WDR images. The image brightness consistency and details are well preserved by using multiple scale histogram tone mapping and fusion. The use of integral histogram and integral image keeps our algorithm in high computation efficiency. Experimental results shows that our algorithm can provide appealing images with high contrast and brightness, and it shows better performance than stateof-the-art tone mapping algorithms. REFERENCES [I]
[2]
[3] [4]
[5]
[6]
[7]
Fig. 4: Comparison of the reproduced memorial church WDR image between our algorithm and the other three state-of-the-art algorithms. (a) Result from Meylan et. al [14]. (b) Results from Paris et. al [17]. (c) Result from Gu et. al [16]. (d) Our result. Memorial radiance map courtesy of Paul Debevec, University of California at Berkeley.
[8] [9] [10]
where N is the number of pixels in image I. The images are divided into 100 x 100 non-overlapping blocks, the local standard deviation is computed as the average standard deviation of all blocks. The higher the values, the brighter and sharper the image is. The evaluated results are presented in Table I. Our tone mapped result achieves the highest
[11] [12]
P. E. Debevec and J. Malik, "Recovering high dynamic range radiance maps from photographs," in ACM SIGGRAPH 2008 classes. ACM, 2008, p. 31. J. Tumblin and H. Rushmeier, "Tone reproduction for realistic images," IEEE Computer graphics and Applications, vol. 13, no. 6, pp. 42-48, 1993. G. Ward, ''A contrast-based scalefactor for luminance display," Graphics gems IV, pp. 415-421, 1994. F. Drago, K. Myszkowski, T. Annen, and N. Chiba, "Adaptive logarithmic mapping for displaying high contrast scenes," in Computer Graphics Forum, no. 3. Wiley Online Library, 2003, pp. 419-426. A. Hore and O. Yadid-Pecht, "A new filter for reducing halo artifacts in tone mapped images," in Pattern Recognition (ICPR), 20/4 22nd International Conference on. IEEE, 2014, pp. 889-894. A. Hore and O. Yadid-Pecht, "A statistical derivation of an automatic tone mapping algorithm for wide dynamic range display," in 20/4 IEEE International Conference on Acoustics, Speech and Signal Processing (ICASSP). IEEE, 2014, pp. 2475-2479. P. Ambalathankandy, A. Hore, and O. Yadid-Pecht, "An fpga implementation of a tone mapping algorithm with a halo-reducing filter," Journal of Real-Time Image Processing, pp. 1-17,2016. E. Reinhard and K. Devlin, "Dynamic range reduction inspired by photoreceptor physiology," IEEE Transactions on Visualization and Computer Graphics, vol. 11, no. I, pp. 13-24, 2005. J. Van Hateren, "Encoding of high dynamic range video with a model of human cones," ACM Transactions on Graphics (TOG), vol. 25, no. 4, pp. 1380-1399, 2006. H. Spitzer, Y. Karasik, and S. Einav, "Biological gain control for high dynamic range compression," in Color and Imaging Conference, vol. 2003, no. 1. Society for Imaging Science and Technology, 2003, pp. 42-50. R. Mantiuk, S. Daly, and L. Kerofsky, "Display adaptive tone mapping," in ACM Transactions on Graphics (TOG), vol. 27, no. 3. ACM, 2008, p. 68. K. Ma, H. Yeganeh, K. Zeng, and Z. Wang, "High dynamic range image tone mapping by optimizing tone mapped image quality index," in 20/4 IEEE International Conference on Multimedia and Expo (ICME). IEEE, 2014, pp. 1-6.
2017 IEEE 7th International Workshop on Computational Advances in Multi-Sensor Adaptive Processing (CAMSAP)
[13]
F. Durand and J. Dorsey, ''Fast bilateral filtering for the display of higb-dynamic-range images," in ACM transactions on graphics (TOG), vol. 21, no. 3. ACM, 2002, pp. 257-266.
[14]
L. Meylan and S. Susstrunk, ''High dynamic range image rendering with a retinex-based adaptive filter," IEEE Transactions on image processing, vol. 15, no. 9, pp. 2820-2830, 2006.
[15]
Z. Farbman, R. Fattal, D. Liscbinski, and R. Szeliski, "Edgepreserving decompositions for multi-scale tone and detail manipulation," in ACM Transactions on Graphics (TOG), vol. 27, no. 3. ACM, 2008, p. 67.
[16]
B. Gu, W. Ii, M. Zhu, and M. Wang, ''Local edge-preserving multiscale decomposition for high dynamic range image tone mapping," IEEE Transactions on image Processing, vol. 22, no. 1, pp. 70-79, 2013.
[17]
S. Paris, S. W. Hasinoff, and J. Kautz, ''Local laplacian filters: edgeaware image processing with a laplacian pyramid," Communications of the ACM, vol. 58, no. 3, pp. 81-91, 2015.
[18]
E. H. Land and J. J. McCann, ''Lightness and retinex theory," JOSA, vol. 61, no. 1, pp. 1-11, 1971.
[19]
M. Herscovitz and O. Yadid-Pecht, "A modified multi scale retinex algorithm with an improved global impressionof brightness for wide dynamic range pictures," Machine VISion and Applications, vol. 15, no. 4, pp. 220-228, 2004.
[20]
K. He, J. Sun, and X. Tang, "Guided image filtering," in European conference on computer vision. Springer, 2010, pp. 1-14. P. Viola and M. J. Jones, "Robust real-time face detection," International journal of computer vision, vol. 57, no. 2, pp. 137-154, 2004. F. Porikli, "Integral histogram: A fast way to extract histograms in cartesian spaces," in Computer Vision and Pattern Recognition, 2005. CVPR 2005. IEEE Computer Society Conference on, vol. 1. IEEE, 2005, pp. 829--836.
[21]
[22]
[23]
R. Fatta1, D. Lischinski, and M. Werman, "Gradient domain high dynamic range compression," in ACM Transactions on Graphics (TOG), vol. 21, no. 3. ACM, 2002, pp. 249-256.