Distance, Histogram Intersection, Cosine or Quadratic. Distances are usually used to calculate the images similarity rating. However, each of the distances has ...
Histogram Matching For Color Detection: A Preliminary Study
Fatma Susilawati Mohamad Faculty of Computer Science & Information System, UTM International Campus Kuala Lumpur, Malaysia
Abstract—Several similarity measures such as Euclidean Distance, Histogram Intersection, Cosine or Quadratic Distances are usually used to calculate the images similarity rating. However, each of the distances has their own limitations when used in particular situation or application. This paper reports a preliminary study of current similarity measures used based on histogram matching. Few experiments on image and color histograms are also presented and discussed. Images of Oil Palm Fruits are used to estimate for its ripeness. This paper will point out the use of existing similarity measures to find the most suitable and efficient one for that particular application Keywords- Similarity Measure, Histogram Matching, Image Histogram, Color Histogram
I.
INTRODUCTION
In “Statistics in Psychology”, [1] explains “a histogram is a graphical display of tabulated frequencies which shown as bars. It also shows what proportion of cases fall into each of several categories. The categories are usually specified as non-overlapping intervals of some variable. The categories (bars) must be adjacent. The intervals (or bands, or bins) are generally of the same size”. The density of data can also be plotted using Histogram. Moreover, density estimation can be used to estimate the probability density function of the underlying variable. If the length of the intervals on the x-axis is all 1, then a histogram is identical to a relative frequency plot [1].
978-1-4244-6716-7/10/$26.00 © 2010 IEEE
Azizah Abdul Manaf & Suriayati Chuprat Center of Advanced Software Engineering UTM International Campus Kuala Lumpur, Malaysia
II.
MOTIVATION
An image histogram is type of histogram which acts as a graphical representation of the tonal distribution in a digital image [2]. It plots the number of pixels for each tonal value. By looking at the histogram for a specific image a viewer will be able to judge the entire tonal distribution at a glance. According to [3] image histograms are present on many modern digital cameras. Photographers can use them as an aid to show the distribution of tones captured, and whether image detail has been lost to blown-out highlights or blacked-out shadows. In [17], the author points out that “Color histogram is a representation of the distribution of colors in an image. For digital images, it is basically the number of pixels that have colors in each of a fixed list of color ranges, which span the image's color space, the set of all possible colors”. Moreover, [17] say that the color histogram can be built for any kind of color space, although the term is more often used for three-dimensional spaces like RGB or HSV. For monochromatic images, the term intensity histogram may be used instead. For multi-spectral images, where each pixel is represented by a N of measurements, each within its own wavelength range of the light spectrum, some of which may be outside the visible spectrum, the colour histogram is Ndimensional. Colors are long been used for image retrieval and analysis since colors are easier to compute compare to other features such as shape, size or texture. However, colors are hard to differentiate if comparisons are made between the total pixels of images but the uniformity of
1679
histogram always a solution. To date, histograms have only been used for pixel grouping, color analysis, and material type labeling [19]. In [18] the author point out it is possible to use histogram matching to balance detector responses as a relative detector calibration technique. It can be used to normalize two images, when the images were acquired at the same local illumination (such as shadows) over the same location, but by different sensors, atmospheric conditions or global illumination. Below are figures of histogram matching in MR medical scan. In [5] the authors point out that they are normalizing the grayscale values of a source image based on the grayscale values of a reference image. This filter uses a histogram matching technique where the histograms of the two images are matched only at a specified number of quantize values. The filter was originally designed to normalize MR images of the same MR protocol and same body part. The algorithm works best if background pixels are excluded from both the source and reference histograms. A simple background exclusion method is to exclude all pixels whose grayscale values are smaller than the mean grayscale value. Threshold at mean intensity switches on this simple background exclusion method. Number of match points governs the number of quantizes values to be matched. The filter assumes that both the source and reference are of the same type and that the input and output image type has the same number of dimension and has scalar pixel types [5]. III.
CURRENT WORK ON HISTOGRAM MATCHING
In [6] and [11], the authors focus on image query. [6] proposes a hypercube sweeping algorithm to query to a motion database while [11] propose a histogram intersection to be used in querying between two images based on region instead of entire image. However, in [6] performance of the method depends on the speed of the query motion. The results show that the system can handle larger databases on slower query motion and vice versa. But the current method may not be appropriate for matching highly discontinuous data such as sparse point sets or noisy data. Meanwhile for [11], the experimental results reveal that the proposed technique achieves a significant pruning of up to 99% of irrelevant images and is up to 22 times faster than pair wise comparison, where the number of bins is set at 100. However, the problem is that the similarity measure, CXSim( ), is non-metric and thus cannot use the existing spatial indexing method. A new indexing
structure for non-metric similarity measures using a combination of the existing spatial indexing and hashing methods need to be explore further in the future. Authors [7] presented a new and effective image indexing technique that employs local uni-color and bicolor distributions and local directional distribution of intensity gradient. The color histograms represent within-block features, while the histogram of gradient changes represents between-block features in a lower resolution. However, the process of indexing will be difficult when deal with large image databases. According to [8] and [13], the selected algorithms are used to retrieve the correct image in large image collection. Author [8] use a set of randomly generated hyper-spheres to quantize each key point into a sparse vector of real numbers. The problem of large-scale near duplicate image retrieval is focused. The result shows that this approach yields better retrieval performance than the clustering-based approach, and it reduces the running time of key point quantization by a factor of 8. However, it only efficient when the center of each hyper sphere is randomly determined also have to avoid an iterative search for cluster centers, and the radius of each hyper-sphere is fixed to be constant also avoid nearest neighbor search. Meanwhile for [13] the authors propose both global hierarchical color histograms, using Locality Sensitive Hashing for fast retrieval and local feature descriptors (SIFT) for retrieval exploits techniques used in the information retrieval community to compute approximate set intersections between documents using a min-Hash algorithm. The preliminary experiments on NDID suggest that it is preferable as a duplicate-detection mechanism for image search engines and also timeefficient. However, the parameters need to be identified clearly. Otherwise the result will not be accurate as hoped. Both [9] and [14] use existing algorithm for feature extraction method. In [9], a randomized algorithm is presented to embed a set of features into a single highdimensional vector to simplify the feature-set matching problem. The result shows accuracy comparable to the feature-set matching methods, while requiring significantly less space and time. However, since the method allow users input, the human mistakes regarding the data input are usually happen. Moreover, this method only extracted global features instead of local features, this tends to narrow down its capabilities while working with various applications. However, [14] introduce spatial histogram feature-based object detection approach which automatically selects informative spatial histogram features, and learns a
1680
hierarchical classifier by combining cascade histogram matching and a support vector machine to detect objects in images. The results show that the object representation using spatial histogram features is general to different kinds of object classes, and this feature selection methods are efficient to extract informative class specific features for object detection. However, the limitation of this approach is it still capture the false detection of the object especially in large collection of images. In future, this should be fixed, the error rate must be minimized. Moreover, the detection should be able to detect multi-object per image instead of individual object detection. [10] proposed a generalization of the useful Histogram Intersection kernel. This demonstration overcomes the previously described drawbacks. Moreover, it allows us to introduce a mapping hyperparameter which allows us to improve recognition performances in practice. One extra advantage of the GHI kernel is that it leads to invariant SVM boundaries under scaling of the feature space. The drawback of this approach is it cannot identify the images which have different size and features. Authors [12] and [15] present an approach for image matching. Authors [12] present an approach to scaleinvariant region-based hierarchical image matching. Meanwhile author [15] explore stochastic matching of Attributed Relational Graphs that represent the compositional parts and part relations of image scenes. In [12], the experiments demonstrate that the proposed matching is indeed invariant to a wide range of scales, changes in illumination, in-plane rotation, and translation of similar objects. Hence, it also suggest that the algorithm facilitates unsupervised detection of texels in a given image texture, or object category occurrences in an arbitrary set of images. The limitation is it only support the unsupervised data, so this approach is not yet flexible. However, [15] add that the advantage of this model is its ability to accommodate spatial attribute relations and support supervised and unsupervised learning from training data. The limitation of this approach is as the size of database increases, the number of duplicate pairs generally increases in a linear speed, while the number of non-duplicate pairs increases in a quadratic speed, leading to the deterioration of the detection precision.
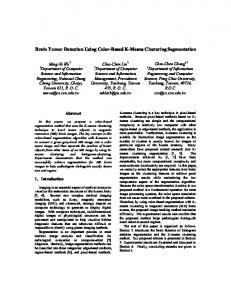
intend to classify the ripeness of oil palm fruit based on its category. We are going to explore the potential features from the color histogram and incorporate them for histogram matching. Histogram matching is chosen because this method usually increases the global contrast of many images, especially when the usable data of the image is represented by close contrast values. Through this adjustment, the intensities can be better distributed on the histogram. This allows for areas of lower local contrast to gain a higher contrast without affecting the global contrast [4]. Histogram equalization accomplishes this by effectively spreading out the most frequent intensity values. This can be an advantage approach compare to the one by [16] who wrote “Each heavy bunches before the harvests are almost stuck together. For the sides that are almost stuck the thick mesocarp is compressed and it will reduce the distance between the mesocarp and the kernel. This causes injection force, the injection tip to hit the kernel which results in the quit high load that different from the other reading. Since the shape of the bunch is oblong or not perfectly round shape, we just declare that at the stock is the top side and from that we declare the right, left, and bottom side”. We are currently working on estimating the ranges of features extracted from the identified categories of fruit. The ripeness bunch of fruits are identified based on priority knowledge. A data of approximately 30 bunches of fruits are collected for each category. The range are then computed for each fruit category. The proposed new similarity measures will then be developed based on the features extracted. Below are few examples of the experiments done. The original image of the ripe and unripe bunch of fruit are shown in Fig.1 and 4. The image is then transformed into grayscale images which are shown in Fig. 2 and 5. Finally, histogram for each type of fruit are shown in Fig.3 and 6.
IV. PRELIMINARY EXPERIMENTS AND RESULTS An ongoing study is conducted to use similarity measures for oil palm fruit application. The approach is
1681
Un Ripe Image
Ripe Image
Fig.4. Unripe Fruit
Fig.1. Ripe Fruit
Grayscale Image of Un Ripe Fruit
Grayscale Image of Ripe Fruit
Fig. 2. Grayscale of Ripe Fruit
Fig.5. grayscale of Unripe Fruit Histogram of Un Ripe Image
Histogram of Ripe Image 1000
1000
900 800
800
700 600
600 500 400
400 300 200
200 100 0
0 0
0
50
100
150
200
Fig.3. Histogram of Ripe Fruit
50
100
150
200
250
250
Fig.6. Histogram of Unripe Fruit
1682
Original Color Image
1 0.5 0
0
100 200 Gray Levels
10000
5000
0
Histogram of Blue Band
15000
0
100 200 Gray Levels
15000
Pixel Count
1.5
Blue Band
Histogram of Green Band
Histogram of Red Band 15000
Pixel Count
Pixel Count
All Bands
Green Band
Pixel Count
of xHistogram 10 4
2
Red Band
10000
5000
0
0
100 200 Gray Levels
10000
5000
0
0
100 200 Gray Levels
Fig. 7. Color Histogram
V. CONCLUSION & FUTURE WORK From the experiments done, the authors hope to find the most suitable similarity measures for the oil palm fruits application. Currently, Euclidean Distance provides no promising result for that particular application. The other two similarity measures will be tested soon to find which technique is better. The three techniques are then compared to find the most suitable and efficient result for that particular application. In future, we try to incorporate the extracted features into a new similarity measures. REFERENCES [1] Howitt, D. and Cramer, D. “Statistics in Psychology”. Prentice Hall.2008. [2] Ed Sutton. “Histograms and the Zone System”. Illustrated Photography. Acessed at http://www.illustratedphotography.com/photographytips/basic/contrast
[5] Bill Lorensen. “Histogram Matching”. 3Dslicer. Accessed at http://www.slicer.org/slicerWiki/index.php/Modules:Hi stogramMatching-Documentation-3.4. 2009 [6] Clifford K. F. So & George Baciu. “Hypercube Sweeping Algorithm for Subsequence Motion Matching in Large Motion Databases”. VRCIA 2006, Hong Kong, 14–17 June 2006. [7] H. Nezamabadi-pour & E. Kabir.“Image retrieval using histograms of uni-color and bi-color blocks and directional changes in intensity gradient”. Elsevier. Pattern Recognition Letters 25 (2004) 1547–1557 [8] Fengjie Li, Wei Tong, Rong Jin, Anil K. Jain and Jung-Eun Lee. “An Efficient Key Point Quantization Algorithm for Large Scale Image Retrieval”. LSMMRM’09, October 23, 2009, Beijing, China..ACM 978-1-60558-756-1/09/10
[3] Michael Freeman. “The Digital SLR Handbook”. Ilex. ISBN 1904705-36-7.2005.
[9] Wei Dong, Zhe Wang, Moses Charikar, Kai Li’ “Efficiently Matching Sets of Features with Random Histograms”. MM’08, October 26–31, 2008, Vancouver, British Columbia, Canada. ACM 978-160558-303-7/08/10
[4] “Histogram Equalization”. Wikipedia The Free Encyclopedia.2010.
[10] Sabri Boughorbel, Jean-Philippe Tarel, Nozha Boujemaa. “Generalized Histogram Intersection Kernel
1683
For Image IEEE
Recognition”.
0-7803-9134-9/05/.2005
[11] Chang-Ryong Kim & Chin-Wan Chung. “A multistep approach for partial similarity search in large image data using histogram intersection”. Information and Software Technology 45 (2003) 203–215 , 2003 Elsevier Science B.V. [12] Sinisa Todorovic & Narendra Ahuja. “Scaleinvariant Region-based Hierarchical Image Matching”. Proc. 19th International Conference on Pattern Recognition (ICPR), Tampa, FL, December 2008 [13] Ondˇrej Chum, James Philbin, Michael Isard, Andrew Zisserman. “Scalable Near Identical Image and Shot Detection”. CIVR’07, July 9–11, 2007, Amsterdam, The Netherlands. Copyright 2007 ACM 978-1-59593-733-9/07/0007 [14] Hongming Zhang , Wen Gao , Xilin Chen , Debin Zhao .“Object detection using spatial histogram features”. Image and Vision Computing 24 (2006) 327–341. 2006 Elsevier B.V. [15] Dong-Qing Zhang & Shih-Fu Chang. “Detecting Image Near-Duplicate by Stochastic Attributed Relational Graph Matching with Learning”. MM’04, October 10-16, 2004, New York, New York, USA. ACM 1-58113-88/04/0010 [16] Azli.A.R, Sahril.K, Khairul Anuar. M.D and Rosmawati A.H. „The Analysis Of Injection Forces To Represent The Ripeness Of Oil Palm Fruit”. International Conference on Mechanical and Manufacturing Engineering 2008. ICME 2008. May 21-23, 2008. [17] Wikipedia, Histogram.2010
the
free
encyclopedia.
Color
[18] Wikipedia, the free encyclopedia. Histogram Matching. 2010. [19] Carol L. Novak and Steven A. Shafar. 1992. Anatomy of a Color Histogram. 0-8186-2855-3/92 @1992 IEEE
1684