MULTI-SCALE REPRESENTATION AND OPTIMAL MATCHING OF NON-RIGID SHAPES. Tomasz Adamek, Noel E. O'Connor, Noel Murphy. Centre for Digital ...
MULTI-SCALE REPRESENTATION AND OPTIMAL MATCHING OF NON-RIGID SHAPES Tomasz Adamek, Noel E. O’Connor, Noel Murphy Centre for Digital Video Processing Dublin City University, Dublin 9, IRELAND {adamekt, oconnorn, murphyn}@eeng.dcu.ie ABSTRACT In this paper, an alternative and more compact form of the Multi-Scale Convexity Concavity (MCC) representation [1] for matching non-rigid shapes with a single contour is proposed, along with an optimization framework designed to improve its efficiency. In the original MCC representation, a feature vector containing a measure of convexity/concavity at multiple scale-levels was constructed for each contour point on an object’s shape. Although such a rich descriptor exhibited improved performance over existing techniques, the inherent redundancy between scale levels implied high storage requirements. In this paper, we discuss possibilities for reducing the redundancy of this representation. In addition, we propose an iterative optimization framework for determining the relative proportions in which information from different contour point features should be combined in the final similarity measure. The experiments conducted using the MPEG-7 shape database show that such optimization can further improve retrieval performance of the proposed MCC method. 1. INTRODUCTION Shape is an extremely important cue for object recognition. For example, humans can often recognize characteristic objects solely on the basis of their shapes. For this reason, shape representation and matching is considered an important component of most content-based information retrieval systems and has been the focus of much research. An extensive survey of shape matching techniques can be found in [2, 3]. The most common criteria used for shape representation for reliable shape matching and retrieval are discussed in [4, 5]. In our work, we are primarily interested in contour based similarity measures – particularly in the case where the similarity between the two curves is weak. Contour-based descriptors are typically very efficient in applications where high intra-class shape variability is expected due to either deformations in the object (rigid or non-rigid) or as a result of perspective deformations [6]. Techniques based on contour matching are especially suitable in applications where
ISBN: 952-15-1364-0
the analyzed objects are flexible or prone to non-rigid deformations (e.g. object shapes corresponding to people walking). In this case, matching relies on either aligning feature points [7, 8] or using a deformation-based approach to aligning the properties of the two curves [9, 4, 10]. The crucial problem in contour matching is the choice of features used to quantify differences between contour segments. Biological research has shown that contour curvature is one important clue exploited by the human visual system in this regard [11]. However, curvature is a local measure and is therefore sensitive to noise and local deformations. Estimating curvature involves calculating contour derivatives, which is difficult for a contour represented in digital form. In fact, the important structures in a shape generally occur at different spatial scales. Therefore, the most powerful shape analysis techniques are those based on multi-scale representations [12, 13, 14]. Whilst multiscale representations are very useful in analyzing contours, they are also highly redundant – this is the price to be paid in order to make explicit important structural information. Approaches to removing thus redundancy are again motivated by studies of human perception. Many researchers recognized the importance of transient events in human visual perception [11, 15]. In [11] it was demonstrated that corners and high curvature points concentrate more information than straight lines or arcs. Numerous successful shape analysis techniques were motivated by these observations. Various multi-scale contour representations proved to be very useful for detecting such transient events [15, 12, 13, 14]. Methods based on transient events are cognitively motivated, compact and allow fast matching. The main drawback is that they are generally highly ambiguous. For example, one of the most popular approaches from this category, based on maxima of zero-crossing points in Curvature Scale-Space (CSS) [12], cannot distinguish between very deep and sharp concavities and very long shallow concavities. Moreover, the maxima of zero-crossing points do not exist for totally convex shapes. Since only a small set of contour events is used for matching, they cannot provide refined contour alignment. Also, it is not always possible to
find a match for all contour events, and usually, unmatched events are disproportionately penalized in the final similarity measure. Human judgements of shape similarity differ significantly between observers thereby making the evaluation task very difficult [16, 12]. The desired properties of a shape analysis technique and the associated evaluation criteria depend on a particular application. Adaptation of a shape representation method to a given application can be achieved by utilizing a training step in order to develop the optimal parameters for a given application. The new shape representation and optimization framework presented in this paper is one means of performing this adaptation. In this paper we present a new shape representation method that builds upon our previous work in this area. In [1], we introduced a rich shape description method, termed the Multi-scale Convexity Concavity (MCC) representation. This multi-scale approach is an alternative solution to the multiscale methods based on event detection. Information about the amount of convexity/concavity at different scale levels is stored for each contour point. The convexity/concavity measure has similar properties to contour curvature, but is much easier to extract. A Dynamic Time Warping (DTW) technique is used to find an optimal refined alignment along the contours upon which the dissimilarity measure is defined. Attractive properties of the new approach are that it outperforms existing methods, is robust to various transformations and deformations, has low matching complexity (comparing to fine contour matching techniques [9, 4]) and is relatively easy to implement. Although, such a rich descriptor provides excellent retrieval performance, the inherent redundancy between scale levels implies high storage requirements. In this paper, we propose an alternative representation, termed MCC-DCT, that reduces the redundancy. Also, in our original approach, information from different scale levels was incorporated into the dissimilarity measure with the same importance (weight). The study of the influence of those weights on the overall retrieval performance led to the development of an optimization framework to determine optimal proportions between information represented by different contour point features according to a chosen criterion. This framework, which could also be used to optimize other similar approaches, is presented in this paper in the context of optimizing the new shape representation so that it can be compared both to non-optimized versions of the approach as well as our original approach that, in itself, cannot be optimized. We demonstrate that the average retrieval performance can be further improved by using such a framework. Furthermore, this framework could be used to tailor the shape representation to a specific application. The remainder of this paper is organized as follows: In the next section the main properties of the original MCC
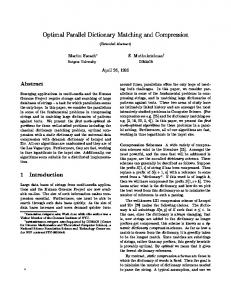
(a) Bird-19
(b) Filtering
(c) MCC
(d) MCC-DCT
Fig. 1. Extraction of MCC representation. representation and matching algorithm, necessary for understanding the proposed modifications, are briefly reviewed. Section 3 introduces the alternative version of the representation. In section 4, the parameter optimization framework is described in detail. Section 5 presents optimization experiments conducted using the MPEG-7 shape database. Section 6 discusses possible alternative approaches and outlines directions for future research in this area. Finally, conclusions are formulated in Section 7. 2. MCC REPRESENTATION The MCC representation and matching was proposed and its properties and performance discussed in detail in [1]. However, since understanding of its basic properties play an important part in the remainder of this paper, the main points are briefly reviewed here. 2.1. MCC Representation In the Multi-scale Convexity Concavity (MCC) representation, for each contour point we store information about the amount of convexity/concavity at different scale levels. The representation takes the form of a 2D matrix where the columns correspond to contour points (contour parameter u) and the rows correspond to the different scale levels σ. The position (u, σ) in this matrix contains information about the degree of convexity or concavity for the uth contour point at scale level σ. The simplified boundary contours at different scale levels are obtained via a curve evolution process very similar to that used in [12] to extract the CSS image. A size normalized contour C is represented by N contour points�and pa� rameterized by arc-length u: C(u) = x(u), y(u) , where u ∈ h0, N i. The coordinate functions of C are convolved with a Gaussian kernel φσ of width σ ∈ {1, 2...σmax }. The resulting contour, Cσ , becomes smoother with increasing
value of σ, until finally the contour is convex. The convexity/concavity measure is defined as the displacement of the contour between two consecutive scale levels. The sharper the convexity or concavity, the larger the change in the position of its contour points during filtering, where convex and concave parts are distinguished via a change in sign. An example of the MCC extraction process is illustrated in Figure 1. The final MCC representation is illustrated in the form of a 2D surface in Figure 1c. All concavities and convexities are present at the lowest scale levels. Moving to higher scale levels the level of detail decreases and only the most significant convexities and concavities are retained. The representation is invariant to translation and scaling (due to size normalization), and a rotation of the object causes a circular shift of its representation along the u axis which is taken into account during the matching process. This also addresses the possible effects of a change in the contour starting point. Non-rigid deformations might shift the position of contour point features along the u axis, but do not significantly change the values of convexity/concavity. All differences in the position of the features along the contour will be compensated during the matching process, but in contrast to other approaches [10], will not be used as a penalizing factor in the final similarity measure. For a more detailed description of MCC extraction and its properties, the reader is referred to [1]. The above extraction process implies data redundancy in the representation, since a 1D signal is represented by a 2D matrix. This is common for many multi-scale representations [12, 13]. In [13] this phenomenon is described as unfolding a 1D signal by a 2D transform, for the purpose of making explicit underlying structural information at different scales. The innovation in our approach is that the multi-scale representation is not used to detect important transient events to obtain a compact shape descriptor, but is used directly for quantifying the differences between shapes. In [1], we demonstrated that using MCC for quantifying differences between shapes can lead to significant improvement in retrieval efficiency. However, we do not mean to imply that the transient events do not contain significant information about the structure of the contour, but rather that by using our representation we ensure that none of the important information has been unnecessarily discarded. In section 3 we will discuss a systematic approach to redundancy reduction by de-correlating the information from different scale levels and selectively discarding unimportant information. It should be also be noted that MCC extraction has very low computational cost compared to other similar approaches [12, 13] and is therefore suitable for on-line contour-based recognition, where usually storage requirements do not play the key role.
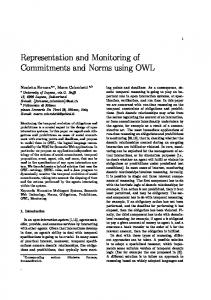
(a)
(b)
Fig. 2. Matching: (a) - matching two MCC representations by dynamic programming, (b) - example of typical matching. 2.2. MCC Matching The matching algorithm finds the global optimal match between two MCC representations. The result is the best correspondence between contour points and final similarity/ dissimilarity measure based on the distances between those corresponding points. It is assumed that the contours are closed. Occlusions are not detected explicitly, but penalized implicitly by the cost of matching them to the nonoccluded contour. These simplifications allow us to use a Dynamic Programming technique similar to one used for speech recognition where it is referred to as Dynamic Time Warping (DTW). When finding the optimal match between two contours, first distances between contour points are computed and stored as an N ×N distance table – see Figure 2a. Each row/column entry corresponds to the distance between two contour points calculated based on their multi-scale feature vectors. Finding the optimal match between contours corresponds to finding the lowest cost diagonal path through the distance table. To ensure the optimal match, rotation invariance is obtained by checking N possible circular shifts for the optimal diagonal path. However, it should be noted that procedures for estimating the best circular shift and consequently faster matching are also possible and will be reported elsewhere. Invariance to mirror transformations can be obtained by checking for the optimal path by traversing through the columns or rows in both directions. The final dissimilarity is calculated based on the cumulative cost along the least cost path. An example of typical matching is shown in Figure 2b. 3. A NEW MCC REPRESENTATION The original MCC representation is not suited to an optimization process since scale levels are highly correlated. Therefore, prior to optimization we propose an alternative
form of the MCC representation where the scales are decorrelated. 3.1. MCC-DCT Representation In order to reduce correlation between multi-scale feature components of each contour point, a 1D DCT is applied to each column of the MCC array. In this new MCC-DCT representation, the feature vector of every contour point consists of the DCT coefficients of its original multi-scale feature vector (Figure 1d). The DCT de-correlates information from different scale levels thus making it more suitable for the optimization process described in the next sections. Additionally, the DCT rearranges the significance of information across different scale levels placing most of the feature vector energy in lower levels. This property, can be utilized to obtain more compact shape representation when combined with a quantization scheme. For clarity, in the remainder of this paper, contour point DCT coefficients are indexed by letter i to distinguish them from scale levels σ. 3.2. MCC-DCT Matching The main difference between the original MCC and the modified MCC-DCT representations is the form of the contour point feature vector. Therefore, the modified MCC-DCT representation can be matched using the same matching algorithm as described previously for the original MCC representation except that the distances are computed based on their DCT coefficients. If two contour points uA and uB are represented by their feature vectors containing I DCT coefficients denoted as fiuA and fiuB respectively, for i = 0, 2, ...I − 1, then the distance between the two contour points is defined as: d(uA , uB ) =
I−1 X i=0
pi ·
|fiuA − fiuB | B xA i + xi
points. Changing the weights between distances computed using different contour point features will affect the values in each entry of the distance table and will directly influence the final dissimilarity measure(calculated as the cumulative cost of those entries along the least cost path). Moreover, altering the values in the distance table might affect the least cost path and therefore the alignment of contours itself. In the remainder of this paper we will investigate the influence of the weights pi on the overall retrieval performance in a systematic way. 4. OPTIMIZATION FRAMEWORK 4.1. Motivation In the case of matching techniques, performance enhancement by parameter tuning is frequently performed in an adhoc manner [9] or based on trial-and-error. A more systematic framework for parameter optimization would be very useful for developing and testing of shape matching techniques. Such a framework could be used to investigate the influence of different parameter settings on performance and facilitate the comparison of different approaches by ensuring optimal conditions, and thereby a “level playing field”, for the methods being compared. In order to optimize retrieval performance, a groundtruth database containing classified shapes is required. Clearly, one could argue that such ground-truth datasets are often unavailable in real application scenarios. However, even trialand-error tuning requires a certain number of examples and the optimization method presented here is simply an automatization of this process. The number and type of examples used determines the applicability (generalization) of the optimized method. 4.2. Optimization algorithm
(1)
where weights pi control the relative proportions between distances computed using different DCT coefficients. xi denotes the dynamic range of contours’ DCT coefficients min u u at level i and is defined as: xi = max u {fi } − u {fi }. The final dissimilarity between two contours is calculated by normalizing the cost Dmin of the optimal path found by the DTW technique by the number of contour points (columns) used in the MCC-DCT representations: D(A, B) = Dmin /N . The introduction of weights pi in equation 1 is the key modification compared to our original matching approach where distances computed using different scale levels were combined with the same importance. The weights pi can be used to tune properties of the matching process, but do not depend on matched contours and are constant for all contour
Let us assume that a training shape collection and an optimization criterion (measure of performance) based on the ground-truth are available. The adjustment of the weights pi can be tackled as the optimization of an objective function of I independent parameters pi , where I denotes the number of contour point features (DCT coefficients). The optimization process is split into two stages in order to avoid re-matching of all shapes in the dataset for each evaluated combination of parameters pi . In the first stage, all shapes in the database are matched using the method described in section 3 using an initial combination of parameters pi and the resulting contour point correspondences stored. In the second stage, the optimization of the chosen criterion is performed using the Nelder–Mead Simplex Method [17], based on the contour point assignments obtained from stage one. Once the new optimal values of parameters pi are found, the alignment between contour points for each pair
than one means that all shapes from the same class as Sq have lower dissimilarity to Sq than any of shapes not belonging to the class. The overall performance was calcu1 PK lated as average of all performances Fq : Favg = K q=1 Fq . Note, that D(Sq , Sk ), Fq and Favg are functions of pi which were omitted for simplicity in the above equations. Optimization of the matching technique means finding combinations of parameters pi which minimize Favg . In fact, Favg depends on the relative proportions between parameters pi . This implies an infinite number of equivalent solutions in parameter space. In order to make the optimization process unambiguous, the value of parameter p0 , corresponding to DC coefficient, was set to one and the optimization framework was used to determine the relative values of the remaining I − 1 parameters.
5. EXPERIMENTAL RESULTS Fig. 3. Optimization algorithm.
5.1. Dataset
of shapes has to be updated. Therefore, the whole optimization process is repeated iteratively until convergence. The complete procedure is depicted in Figure 3. We adopted the commonly used Nelder–Mead Simplex Method [17] since it is a direct search method (derivatives of the objective function would be difficult to calculate). Theoretical proof of convergence of the Nelder–Mead simplex method in multi-dimensional space does not exist and the method might be fooled by a single anomalous step. Therefore, it is frequently a good idea to restart a multidimensional minimization routine at a point were it claims to have found a minimum. Usually the restart should not be very expensive since the algorithm already converged once. 4.3. Optimization Criterion Depending on a particular application, many different criteria can be used. In this paper, an optimization criterion based on distances between all shapes in the training dataset was used. Let us assume a collection S containing K shapes (k ∈ 1, 2, ..K) from known set of classes C. Each shape was used as a query and the performance was measured as the ratio between maximum distance between query shape and a shape from the same class and minimum distance between query shape and a shape from a different class: Fq =
max ∀k C(Sq )=C(Sk ) D(Sq , Sk ) min ∀k C(Sq )6=C(Sk ) D(Sq , Sk )
(2)
where D(Sq , Sk ) is the dissimilarity measure between shape Sq and Sk obtained using the evaluated shape matching technique. For a given query shape, Sq , a value of Fq smaller
For all experiments, the dataset from the MPEG-7 Core Experiment ”CE-Shape-1” (part B), or a subset thereof, was used. This collection has been chosen because of its high intra class variability and completeness. It contains classes of shapes with different levels of variability, non-rigid deformations, occlusions and cracks. We assumed that using such a complete collection in the optimization framework will improve overall performance of our general-purpose shape matching technique. We propose that parameters derived by the optimization framework using this collection will provide good performance for many different classes of shapes and deformations. Thus, it should be possible to tailor our general-purpose technique to a particular application by optimization using shapes specific to this application. In the MPEG-7 Core Experiment ”CE-Shape-1”, performed as part of the MPEG-7 standardization process, a set of semantically classified images with an associated ground truth were used. The total number of images in the database is 1400 consisting of 70 classes of various shapes, each class with 20 images. Each class was used as a query, and the number of similar images (which belong to the same class) was counted in the top 40 matches (”Bulls-Eye” test). The best performance for a method based on the best possible correspondence of visual parts [18] was reported as 76.45%. In these experiments, a performance of 75.44% was obtained by a method based on CSS. Results obtained using a more recent optimized version of the CSS approach [19, 1] show a performance of 80.54%. In comparison, performance of 84.93% was reported for the MCC-based approach in [1]. It should be noted that this result was obtained for the non-optimized version of the MCC approach and without adjusting any parameters.
Configuration MCC MCC-DCT10/E MCC-DCT10/O
Avg. Retrieval Rate 84.49% 84.43% 86.61%
Tab. 1. Average retrieval rates obtained using different configurations of the matching algorithm.
Fig. 4. Optimal combination of parameters pi found by the optimization framework for the MCC-DCT representation. 5.2. Optimization The purpose of this experiment is to demonstrate the capabilities of both the proposed MCC-DCT representation and the optimization framework. The MCC-DCT representation with 10 DCT coefficients per contour point will be optimized according to the criterion proposed in section 4.3. The MPEG-7 dataset has been split into two subsets, one for optimization (training) and another for testing. Every fourth shape from each class was moved into the training set resulting in collection of 350 shapes from 70 classes (5 shapes per class). The remaining 1050 shapes were used for testing. The optimization framework converged after just two main iterations and five restarts of the Nelder–Mead minimization routine. The optimal combination of parameters pi found by the optimization framework is shown in Figure 4. Weights corresponding to the first five DCT coefficients have significantly bigger values than weights corresponding to the remaining coefficients. This relatively simple form of the pi combination suggests a good generalization of the training collection. The values of parameters pi can be interpreted as an estimation of relative importance of those coefficients to effective shape retrieval. 5.3. Performance Evaluation The retrieval performance of the optimized version of the matching algorithm (referred to as MCC-DCT10/O ) is evaluated using the test dataset. Since each class contained 15 shapes (instead of 20) the retrieval rate (”Bulls-Eye” test) was computed by counting the number of images belonging to the same class in the top 30 matches (instead of 40). The results are compared to the results obtained using the original MCC representation and with the configuration based on a non-optimized matching of MCC-DCT representations (∀i pi = 1.0), referred as MCC-DCT10/E . The evaluation results in terms of average retrieval rate are presented in Table 1. The original MCC approach ob-
tained a performance of 84.49%, which is very close to the result obtained for the same approach in our simulation of the MPEG-7 Core Experiment, indicating that in both cases the testing conditions were similar. The MCCDCT10/E (non-optimized matching) configuration showed slightly worse performance than the original MCC configuration despite the fact that both descriptors contain exactly the same information. This can be explained by the fact that the DCT transform rearranged the information between feature components and thus in both cases the information was combined with different proportions. Optimization increased the performance of the MCC-DCT-based technique by approximately 2%. Although, such an increase seems modest it should be noted that some researchers estimated [19] that the average retrieval rate of around 80% in MPEG-7 Core Experiment was already close to saturation. In order to present a broader perspective on performance of the techniques, detailed class-by-class performances are shown in Figure 5. The collection contains several relatively “easy” classes where all configurations obtained performance close to 100%. The non-optimized MCC-DCT10/E shows improvement compared to the original MCC for the majority of the more challenging classes. This is especially noticeable for classes with distinctive low or high frequency components in the MCC-DCT representation e.g. pocked, fly, tree, hCircle. However, for several classes, MCC-DCT10/E obtained much worse results, e.g. device0, butterfly, chicken, device3. This can be explained by the fact that those classes are characterized by high intra variability occurring at different levels (frequencies). For example, class ’device0’ contains approximatively the same number of smooth instances (mainly low frequencies) as more detailed and complex (low and high frequencies). Because in MCC-DCT10/E , all DCT coefficients were incorporated with the same importance, the coefficients corresponding to high frequencies had relatively high impact on the similarity measure resulting in a decrease of the average retrieval performance. The optimization framework was able to find the optimal balance between DCT coefficients resulting in a performance increase for the majority of the challenging classes. The experiment also confirmed that MCC and MCCDCT exhibit the same robustness against non-rigid deformations. Both configurations performed similarly for all classes with high non-rigid intra variability, e.g. sea snake, spring, stef, camel.
illustrate an important property of the new representation. Finally, it should be noted that a meaningful comparison between the performances of configurations with different numbers of DCT coefficients was possible only because of the prior optimization. For example, if the non-optimized version of the matching algorithm was used, a conclusion could be reached that 10 DCT coefficients results in worse performance than using only two coefficients. 6. DISCUSSION Fig. 5. Class retrieval ratios for different configurations of the matching algorithm. The classes are sorted according to the performance of the reference MCC configuration, with the corresponding performances of MCC-DCT10/E and MCC-DCT10/O overlaid.
Fig. 6. Average retrieval ratios vs. number of DCT coefficients. 5.4. Compactness vs. Performance The optimal combination of weights pi (see Figure 4) suggests that the DCT coefficients corresponding to low frequencies are somehow more important than the coefficients corresponding to higher frequencies. We investigated this by discarding different numbers of higher frequency DCT coefficients from the matching process. In the experiment, the MCC-DCT10/O configuration with the matching algorithm optimized as in the previous section was used. Retrieval performance was plotted against the number of DCT coefficients used in Figure 6. The results indicate that by using only the first two DCT coefficients we can obtain comparable performance to using all ten. Therefore, the MCCDCT descriptor with only the first two DCT coefficients per contour point represents a very good trade-off between performance and compactness. It should be noted that relatively good performance of 83.33% was obtained by using the DC coefficient alone. Although these encouraging results may not hold true for all applications (clearly more complex shapes would require more coefficients), they do
It should be stressed that we are aware that the 1D DCT transform is not the only possible way of reducing redundancy in the MCC representation. Assuming that a small set of shape examples typical for a given application is available, Principal Components Analysis (PCA) could be used to de-correlate the information from different scales. In our future work, the MCC-DCT will be compared with the MCC-PCA representation. Both, the MCC-DCT and MCC-PCA representations still exhibit redundancy along the contour (u axis), which could be reduced by non-uniform sampling or by segment approximation using, for example, B-splines. These solutions were not investigated to date as in this paper we were primarily concerned with the influence of different combinations of contour point features (i axis). Yet another approach to redundancy reduction could be based on an orthogonal transform, for example the Fourier Transform, applied along the u axis. However such an approach would not allow elastic matching [2]. Transforms such as the discrete wavelet transform could avoid problems of data redundancy and are localized in the frequency domain, although continuous transforms are generally more suitable for shape analysis [13]. The proposed optimization framework does not make any assumption about the nature of the parameters to be tuned. However, the performance of the Nelder–Mead Simplex method requires specification of the so-called problems’ characteristic length scales for each optimized dimension [17]. Also, the method is prone to being trapped in a local minima. An alternative solution to that proposed here would be to alter the second stage of the optimization process by replacing the simplex method with direct estimation of the parameters, e.g. setting their values inversely proportional to Favg calculated using each feature component (e.g. DCT coefficient). These alternative approaches will also form the basis for our future work in this area. 7. CONCLUSIONS In this paper, the redundancy inherent in the Multi-Scale Convexity Concavity (MCC) representation for non-rigid contours has been discussed and an alternative form (MCCDCT) based on a 1D Discrete Cosine Transform has been
proposed. Additionally, an optimization framework for testing and improvement of the efficiency of this new representation was presented. We demonstrated that the framework can successfully determine relative proportions in which information from different DCT coefficients should be combined in order to optimize the average performance of the matching algorithm. The experiments conducted using the MPEG-7 shape database show that such optimization can be used to discover important properties of the MCC-DCT representation and further improve its retrieval performance.
Acknowledgment The support of the Informatics Research Initiative of Enterprise Ireland is gratefully acknowledged. 8. REFERENCES [1] Tomasz Adamek and Noel E. O’Connor. A multi-scale representation method for non-rigid shapes with a single closed contour. Special Issue on Audio and Video Analysis for Multimedia Interactive Services in IEEE Transactions on Circuits and Systems for Video Technology, 5 2004.
[9] Y. Gdalyahu and D. Weinshall. Flexible syntactic matching of curves and its application to automatic hierarchical classification of silhouettes. IEEE Transactions on Pattern Analysis and Machine Inteligence, 21(12):1312–1328, 1999. [10] Thomas B. Sebastian, Philip N. Klein, and Benjamin B. Kimia. On aligning curves. IEEE Transactions on Pattern Analysis and Machine Intelligence, 25(1):116–125, January 2003. [11] F. Attneave. Some informational aspects of visual perception. Psychological Review, 61:183–193, 1954. [12] F. Mokhtarian, Sadegh Abbasi, and Josef Kittler. Efficient and robust retrieval by shape content through curvature scale space. In Proceedings of International Workshop on Image Database and Multimedia Search, Amsterdam, the Netherlands, pages 35–42, 1996. [13] L. F. Costa and R. M. Cesar. Shape Analysis and Classification, Theory and Practise. ISBN 0-8493-3493-4. CRC Press LLC, 2000.
[2] Sven Loncarin. A survey of shape analysis techniques. Pattern Recognition, 31(5):983–1001, 1998.
[14] Azhar Quddus, Faouzi Alaya Cheikh, and Moncef Gabbouj. Wavelet-based multi-level object retrieval in contour images. In Proceedings of the Very Low Bit rate Video Coding (VLBV99) workshop, Kyoto, Japan, pages 43–46, October 1999.
[3] R.C. Veltkamp and M. Hagedoorn. State of the art in shape matching. Technical report UU-CS-1999-27, Utrecht University, 1999.
[15] A.P. Witkin. Scale-space filtering. In Proceedings 8th International Joint Conference on Artificial Inteligence, pages 1019–1022, 1983.
[4] Euripides G. M. Petrakis, Aristeidis Diplaros, and Evangelos Millos. Matching and retrieval of distorted and occluded shapes using dynamic programing. IEEE Transactions on Pattern Analysis and Machine Inteligence, 24:1501–1516, 2002.
[16] Hannu Kauppinen, Tapio Seppanen, and Matti Pietikainen. An experimental comparison of autoregressive and fourier-based descriptors in 2d shape classification. IEEE Transactions on Pattern Analysis and Machine Inteligence, 17:201–207, 1995.
[5] Maytham Safar, Cyrus Shahabi, and Xiaoming Sun. Image retrieval by shape: A comparative study. Technical Report 17, University of Southern California, Los Angeles, CA, November 1999.
[17] J.A. Nelder and R. Mead. A simplex method for function minimization. Computer Journal, (7):308–313, 1965.
[6] Miroslaw Bober. Mpeg-7 visual shape descriptors. IEEE Transactions on Circuits and Systems for Video Technology, 11(6):716–719, 2001.
[18] Longin Latecki and Rolf Lak¨amper. Shape similarity measure based on correspondence of visual parts. IEEE Trans. Pattern Analysis and Machine Inteligence, pages 1185–1190, October 2000.
[7] John W. Gorman, O. Robert Mitchell, and Frank P. Kuhl. Partial shape recognition using dynamic programing. IEEE Transactions on Pattern Analysis and Machine Inteligence, 10(2):257–266, 1988. [8] Serge Belongie, Jitendra Malik, and Jan Puzicha. Matching shapes. In Eighth IEEE International Conference on Computer Vision, pages 454–463, July 2001.
[19] M. Bober and Wayne Price. Report on results of the ce-5 on contour-based shape. MPEG7, ISO/IEC/JTC1/SC29/WG11/MPEG00/M6293, Beijing, July 2000.