Multi-scale simulation for crowd management: a case study in an urban scenario Luca Crociani1 , Gregor L¨ammel2 , and Giuseppe Vizzari1 1
Complex Systems and Artificial Intelligence Research Centre, University Milano-Bicocca {l.crociani,giuseppe.vizzari}@unimib.it 2 Institute of Transportation Systems, German Aerospace Center (DLR)
[email protected]
Abstract. Safety, security, and comfort of pedestrian crowds during large gatherings are heavily influenced by the layout of the underlying environment. This work presents a systematic agent-based simulation approach to appraise and optimize the layout of a pedestrian environment in order to maximize safety, security, and comfort. The performance of the approach is demonstrated based on annual “Salone del mobile” (Design Week) exhibition in Milan, Italy. Given the large size of the scenario, and the proportionally high number of simultaneously present pedestrians, the computational costs of a pure microscopic simulation approach would make this hardly applicable, whereas a multi-scale approach, combining simulation models of different granularity, provides a reasonable trade off between a detailed management of individual pedestrians and possibility to effectively carry out what-if analyses with different environmental configurations. The paper will introduce the scenario, the base model and the alternatives discussing the achieved results. Keywords: crowd management, multi-agent simulation, pedestrian simulation, optimal environment layout
1
Introduction
The management of pedestrian crowds is a crucial task when organizing large gatherings such as festivals, sports events, or religious celebrations. Three main reasons for an active crowd management are: safety, security, and comfort. – From safety point of view, situations that would lead to high pedestrian densities should be avoided, in particular for bidirectional pedestrian flows or for crossing pedestrian streams. – Security considerations deal with unforeseen threats to the visitors that require, e.g. fast evacuations of large venues. – Related to safety and security is the comfort of the visitors. Comfort considerations include the avoidance of long waiting times (e.g. at ticket counters) and the reduction of high density situations.
2
Crociani, L¨ ammel, Vizzari
Obviously, these three key concepts are closely related and should be seen as mutually dependent. The present work proposes an integrated simulation based appraisal and optimization approach to improve safety, security, and comfort of the visitors of large events. The current contribution demonstrates the approach based on an ’offline’ scenario of the annually “Salone del mobile” exhibition in Milan, Italy. The overall event gathers more than 200000 visitors3 every year. The location is the main exhibition area of Milan, but its importance and number of visitors led to the creation of a spin-off called “Fuori Salone” that organizes many related events in the city center during the fair week. The case study that will be analyzed in this paper describes the scenario of an important event belonging to the Fuori Salone, named “Tortona Design Week”. It is located in the surrounding area of the Porta Genova train and metro station of Milan. The estimated number of visitors is also quite significant, around 115,000 for the 6 days of the event4 .
2
Related works
In the simulation context (pedestrian) travel behavior is usually modeled at three different levels[22, 31]. Plans and final objectives are formulated at the strategic level. At the tactical level a set of activities to complete the plan is created. The physical execution of the activities is performed at the operational level. Approaches to simulate the operational level can be divided into three classes. – Macroscopic models treat the crowds as a flow of densities where individual pedestrians are not represented but rather considered as gas or liquids (see, e.g., [21, 18]). For macroscopic models the computational burden increases rather with the size of the simulated area than with the number of simulated pedestrians. Thus, macroscopic models can be efficient for the simulation of large crowds in small spaces. However, since individual pedestrians are not represented by those models, scenarios with complex origin-destinationrelations seem to be hard to model. – In contrast, microscopic models are constructed from the individual’s point of view, where each and every traveler follows his/her own plan. Some microscopic models treat space as a continuous entity (e.g. force based models[20, 10]), others take a discretized view on environment (e.g. cellular automata (CA) [3, 7]). Most microscopic models are built as a continuous simulations with a fixed time step size. Recently, a model with adaptive time step size has been proposed in order to speed up computation[35]. Another way to speed up the computation is to apply the concept of discrete event simulation[27]. – A third class of simulation models is often referred to as mesoscopic models. One example is the queue simulation model[28]: in this approach, pedestrians are still treated individually, but the environment is represented as a 3
4
http://salonemilano.it/en-us/VISITORS/Salone-Internazionale-del-Mobile/ Exhibition-fact-sheet http://www.tortonadesignweek.com/
Multi-scale simulation for crowd management
3
graph of interconnected FIFO queues. This implies a simplification of the environmental representation and a reduction of the computational costs for the management of the simulation process. The representation of the physical movement at the operational level is simplified and the approach is less effective at representing turbulences due to conflicts, for instance when the situation comprises crossing streams [30].
Hybrid coupling (or multi-scale modeling in general) has been applied to different scientific fields and it combines the advantages of models with different granularity in spatial representation, striving to achieve good overall computational properties with the possibility to zoom in spots requiring more details in the model. This is valid both for extremely small areas, like biological systems [13], that include a very high number of interacting entities in potentially small space, as well as for urban and territorial scale socio-economic systems [36]. In the transportation field, early approaches deal with the vehicular traffic only. Hybrid couplings of macroscopic and microscopic models are proposed by [19, 4, 15]. Examples for the hybrid couplings of mesoscopic and microscopic models are [5, 6]. Approaches from pedestrian domain include [9, 1]. A basic requirement for hybrid modeling, is a consistent transfer of travelers (e.g. pedestrians or vehicles) between the involved simulation models. In the pedestrian domain, this requires that fundamental properties like flow and speed are conserved over the models’ boundaries. A respective approach is discussed in [30]. Recently, this approach has been demonstrated in a case study on an inter- and multi-model evacuation [25]. The strategic and tactical level of behavior deals with the navigation in complex environments and a key feature is the ability to find feasible paths from any origin to any destination. An apparent solution to this problem is the shortest paths solution. It can be computed e.g. by Dijkstra’s shortest path algorithm[14]. However, since the shortest path solution neglects congestion, often longer but faster paths exists: although humans are not necessarily always able to find optimal solutions, the shortest path approach sometimes fails at representing the ability of some pedestrians to select a longer trajectory for preserving a higher walking speed. Those faster but longer paths can be found by an iterative best response dynamics [8]. In the pedestrian context a corresponding macroscopic modeling approach is proposed in [22]. A mesoscopic modeling approach is presented in [29]. In the microscopic context, applications of best response dynamics started only recently. An application to tactical level of behavior is discussed in [24]. A systematic approach where all three levels of behavior are explicitly modeled and paths finding is solved by an iterative approach is proposed in [11]. Pedestrian simulation models are often applied in the evacuation context. Newer works also deal with the appraisal of pedestrian environments regarding their performance under normal conditions, in order to optimize crowd management strategies (e.g. [12]).
4
3
Crociani, L¨ ammel, Vizzari
A Multi-Scale Model for the Simulation of Urban Scenarios
The development of a multi-scale model has been proposed for two main purposes. On one hand, the simulation system should provide a very detailed representation of parts of the scenario in which more complex behaviors can take place. On the other hand, a mesoscopic approach can be used to design and simulate large parts of the urban environment that are not affected by such complex dynamics but are still fundamental for the analysis of the overall scene. Hence the system described here is composed of two models with two different scales of detail: (i) a 2d microscopic model based on a discrete representation for a detailed yet optimized reproduction of pedestrian environments; (ii) a queue model that is used for the simulation of other relevant city roads. Such integration between these models leads to a quite powerful approach capable of performing analysis in urban scenarios, considering multiple modes of transportation and performing simulations in a relatively fast way. Considering computational costs is quite relevant since the multi-scale system applies an iterative approach to manage the agents’ strategic model. The iterative approach moves the overall behavior either towards a Nash equilibrium or to the system optimum depending on the applied cost function. In this way it is possible both to predict what will happen in the scenario on a normal day (with the NE) and to have information about the minimum average travel time of the whole crowd (with the SO). One might argue that implementing the optimal flows configuration is still an issue, since it implies that some people take a detour without perceiving relevant congestion on the shorter way. The desired behavior could be induced by the usage of adaptive bottlenecks (e.g. automatic bollards) that make, depending on the current situation, detours more attractive to some of the people. The development of such a concept represents the overall idea behind this work and it will be subject of future research. The components of the multi-scale model and their integration will be now briefly presented. For a in depth discussion of the CA-model, it is referred to [11]. 3.1
The Discrete Microscopic Model
The model is a 2-dimensional Cellular Automaton with a square-cells grid representation of the space. The 0.4 × 0.4 m2 size of the cells describes the average space occupation of a person [37] and reproduces a maximum pedestrian density of 6.25 persons/m2 , that covers the values usually observable in the real world. A cell of the environment can be basically of type walkable or of type obstacle, meaning that it will never be occupied by any pedestrians during the simulation. Intermediate targets can also be introduced in the environment to mark the extremes of a particular region (e.g. rooms or corridors), and so decision points for the route choice of agents. Final goals of the discrete environment are its open edges, i.e., the entrances/exits of the discrete space that will be linked to roads. Since the concept of region is fuzzy and the space decomposition is a
Multi-scale simulation for crowd management
5
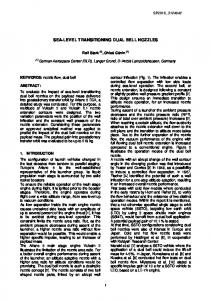
Fig. 1. Sample scenario with its network representation. While the blue cells represent intermediate targets, the outside arrows describe the links with the outside network that will be simulated with the mesoscopic model.
subjective task that can be tackled with different approaches, the configuration of their position in the scenario is not automatic and it is left to the user. Employing the floor field approach [7] and spreading one field from each target –either intermediate of final– allows to build a network of the environment. In this graph, each node denotes one target and the edges identify the existence of a direct way between two targets (i.e. passing through only one region). To allow this, the floor field diffusion is limited by obstacles and cells of other targets. An example for an environment with the overlayed network is shown in Fig.1. The open borders of the microscopic environment are the nodes that will be plugged to the other network of the mesoscopic model. To integrate the network with the one of the mesoscopic model and to allow the reasoning at the strategic level, each edge a of the graph is firstly labeled with its length la , describing the distance between two targets δi , δj in the discrete space. This value is computed using the floor fields as: la (δ1 , δ2 ) = Avg (F Fδ1 (Center(δ2 )), F Fδ2 (Center(δ1 )))
(1)
where F Fδ (x, y) gives the value of the floor field associated to a destination δ in position (x, y); Center(δ) describes the coordinates of the central cell of δ and Avg computes the average between the two values and provides a unique distance. Together with the average speed of pedestrians in the discrete space (explained below), la is used to calculate the free speed travel time of the link Taf ree = slaa . With a simple probabilistic choice, similar to the one proposed in [7], the pedestrian movement towards one target is reproduced with the floor fields values. This allows to avoid obstacles and other pedestrians in a very simple way, but it is not enough to generate a plausible dynamics, i.e., by respecting the fundamental relation about local density and flow.
6
Crociani, L¨ ammel, Vizzari
For the achievement of a realistic microscopic model, the idea of [16] has been extended to 2-dimensional models. The model works on the basis of 3 simple rules that allow the calibration to fit the fundamental diagram of 1-directional and 2-directional flow. The movement rules are summarized in the following: – Movement rule: a pedestrian cannot change his/her position before τm seconds, – Jam rule: if a cell is occupied at time t by the pedestrian p, every pedestrian p 6= p cannot occupy that cell before time t + τj , – Counter-flow rule: if two pedestrian in two consecutive cells at time t are in a head-on conflict, then they will swap their position at time t + τm + τs . The first rule describes the minimum time that a pedestrian can employ to move forward of one cell, thus τm is the duration of the time-step. The second rule manages the dynamics in presence of jamming, implying additional time to move in case of congestion. In particular, this rule has been implemented by letting the agents produce a trace in their previous position, which will keep the cell occupied for τj seconds. This mechanism is able to translate back the effects of congestion as observed, generating the so-called density waves. The third rule defines an agents position exchange mechanism, but the way that agents recognize others belonging to counter-flows needs clarification. The agents of this model, in addition to the floor field related to their current target, are able to perceive the fields of the persons they have in their neighborhood. With this information, they will be able to understand if the surrounding agents are –probably– moving in counter-direction. Hence they will be able to choose the movement in the occupied position by the counter-flow pedestrian and, if this will perform the same choice, start the position exchange at the end of the step. This action will need τm +τs seconds. In [11] it is shown how, by varying the value of τm and τs with the local density, it is possible to fully calibrate this model to fit the fundamental diagrams of pedestrian 1-directional and 2-directional flow. Summarizing, with these rules the model is able to produce feasible simulations of pedestrian motion in planar environments. Nonetheless, the simulation of a complex environment might need consideration of particular elements, such as stairs, which implies at least a lower speed of the agents. To overcome this issue, the environment definition has been enriched by introducing the possibility to mark the borders of stairs, which will affect the agents speed by multiplying their τm times 2, i.e., they will move one time-step over two. With the assumed τm = 0.25 s, pedestrians will have a free flow speed of 1.3 m/s in flat spaces and of 0.65 m/s inside stairs, in accordance with the average speed observed in the real world. At the network level, the links describing the area of a staircase are labeled with a higher free speed travel time. More advanced approaches to manage arbitrary speeds have already been proposed in the literature, using stochastic methods that do not imply a complete synchronization of the agents (e.g. [2]). For the model and the application here proposed, though, this simple and efficient approach is considered effective and further developments on this aspect might be subject of future directions.
Multi-scale simulation for crowd management
7
Finally, in order to respect the dynamics among the mesoscopic and microscopic models, the connection at the borders of the pedestrian environment are managed with so-called transition areas, that temporary host the agents before entering the “real” environment. When the agents pass from the mesoscopic model to the discrete environment, thus, they temporary have a double presence in both model and this allows to extend the influence of eventual congestion from one model to the other one. 3.2
The mesoscopic model
The overall system is implemented within the MATSim framework5 . The standard simulation approach in MATSim is based on a queueing model based on [34]. Originally, the model was designed for the simulation of vehicular traffic only, but later it has been adapted for the additional consideration of pedestrians [29]. The network is modeled as a graph whose links describe urban streets and the nodes describe their intersections. In the pedestrian context “streets” also include side walks, ramps, etc. Links behave like FIFO queues controlled by the following parameters: – – – – – –
the the the the the the
length of the link l; area of the link A; free flow speed vˆ; free speed travel time tmin , given by l/ˆ v; flow capacity F C; storage capacity SC.
The dynamics, thus, follows the rules defined with these parameters. An agent is able to enter to a link l until the number of agents inside l is below its storage capacity. Once the agent is inside, it travels at speed vˆ and it cannot leave the link before tmin . The congestion is managed with the flow capacity parameter F C, which is used to lock the agents inside the link to not exceed it. 3.3
Strategic model
At the strategic level agents plan their paths through the environment. Normally, the aim of the strategic planning is to emulate the real-world pedestrians’ behavior. A fair assumption is that pedestrians try to minimize the walking distance when planning their paths. In the simulation context the shortest path solution is straightforward to compute e.g. by Dijkstra’s shortest path algorithm[14]. However, it is well known that the shortest path solution neglects congestion and thus the shortest path solution is not necessarily the fastest one. In particular commuters who repeatedly walk between two locations (e.g. from a particular track in a large train station to a bus stop outside the train station) often try to iteratively find faster paths. If all commuters display that same behavior they might reach a state where it is no longer possible to find any faster path. If this 5
http://www.matsim.org
8
Crociani, L¨ ammel, Vizzari
is the case, then the system has reached a state of a Nash[32] or user equilibrium w.r.t. individual travel times. This behavior can be emulated by applying an iterative best-response dynamic[8] and has been widely applied in the context of vehicular transport simulations (see, e.g, [17, 33, 23]). In the pedestrian context this concept is still new albeit some preliminary works exist as discussed in Section 2. Related to the Nash equilibrium is the system optimum. But unlike the Nash equilibrium, the system optimum does not minimize individual travel times but the system (or average) travel time. Like the Nash equilibrium, the system optimum can also be achieved by an iterative best response dynamic, but based on the marginal travel time instead of the individual travel time. The marginal travel time of an individual traveler corresponds to the sum of the travel time experienced by her/him (internal costs) and the delay that he/she impose to others (external costs). While it is straightforward to determine the internal costs (i.e. travel time), the external costs calculation is not so obvious. An approach for the marginal travel time estimation and its application to a mesoscopic evacuation simulation is discussed in [26]. Based on this, [11] propose an adaption of the approach to microscopic simulation models. In the present work, the external costs are estimated in the same way as proposed in [11]. The following gives a brief description of the appoach. As discussed both the mesoscopic and the microscopic model are mapped on the same global network of links and nodes. A link can either be in a congested or in an uncongested state. Initially, all links are considered as uncongested. A link switches from the uncongested state to the congested state once the observed travel time along the link is longer than the free speed travel time. Vice versa, a link in the congested state switches to the uncongested state as soon as the first pedestrian is able to walk along the link in free speed travel time. Every pedestrian that leaves a given link while it is in the congested state imposes external costs to the others. The amount of the external costs corresponds to the time span from the time when the pedestrian under consideration leaves the congested link till the time when the link switches to the uncongested state again. In this work, the iterative search of equilibrium/optimum follows the logic of the iterative best response dynamic and it is described by the following tasks: 1. 2. 3. 4. 5.
Compute plans for all agents Execute the multi-scale simulation Evaluate executed plans of the agents Select a portion of the agents population and re-compute their plans Jump to step 2, if the stop criterion has not been reached
The stoping criterion is implemented as a predetermined number of iterations defined by the user. This is because the number of iterations needed for the system to reach a relaxed state depends on the complexity of the scenario and is not known a-priori. In the underlying context, one hundred iterations gives a good compromise between relaxation and runtime. Initial plan computation is performed with a shortest path algorithm. In the subsequent iterations the agents try to find better plans based on the experienced travel costs. Depending on the cost function, the agents learn more convenient
Multi-scale simulation for crowd management
(a)
9
(b)
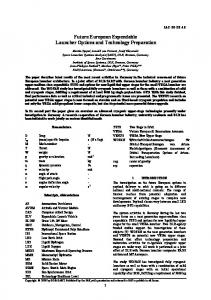
Fig. 2. (a) The location of the event and the possible paths from the train and subway stations. (b) Implementation of the scenario with the multi-scale simulation model (maps taken with Google Maps).
paths either for them individually (relaxation towards a Nash equilibrium) or for the overall population (relaxation towards the system optimum).
4 4.1
Analysis of an Urban Scenario The Scenario of the Tortona Design Week
The Tortona Design Week is a yearly exhibition that is organized in the surrounding area of the Porta Genova train station in Milan. The estimated number of visitors for the 6 days of the event is about 115,000 persons, mostly distributed with peaks on Friday and Saturday nights. Figure 2(a) illustrates the real world scenario with the location of the event and the directions of flows. The larger part of the incoming flow of pedestrians arrives from the station square, where also the entrance/exit of a subway station is located. The main issue of this scenario is given by the connection between the square and the event location. In the direct surrounding, in fact, this is only possible through a three meters wide pedestrian bridge, which makes the other alternative routes not attractive for the visitors. Consequently, the congestion inside the pedestrian bridge is very high and the traveling times become long. In addition to the comfort, the overcrowding on the bridge might imply safety issues. This provided motivations for the analysis here discussed, which will explore three main simulation scenarios. 4.2
Experiments
For the experiments performed, the population of agents has been instantiated according to two normal distributions, which split a total of 15,000 pedestrians
10
Crociani, L¨ ammel, Vizzari
Fig. 3. Satellite view of the area simulated with the microscopic model (picture taken with Google Earth).
among the two origin / destination points (blue dots in Fig. 2(b)): the square in front of the train station and the event location. The distribution of agents from the train station has been centered one hour before the other one in the simulation time-line, to achieve an earlier incoming flow towards the event. Both the distributions are configured with a standard deviation of 30 minutes. The dimensions of the simulated environment brings motivations for the usage of the multi-scale approach: as shown in Fig. 2(b), the surrounding of the pedestrian bridge is represented with the detailed 2-dimensional discrete model as a rectangular area of 100.8 × 41.2 m2 , since it is the area affected by complex pedestrian flows and interactions. The outer connecting streets, which will not be affected by congestion, have been modeled as 1-dimensional queues, to improve the computational efficiency as well as to simplify the task for the scenario configuration. The dimensions and proportions of the environment, in addition to the roads lengths—also in the Figure—have been extracted with Google Earth software. The pedestrian bridge is composed of a single 35 m long span preceded by two 10 m long runs of stairs at its extremes. The west staircase is perpendicular to the flat way and connected with an additional flat component of 3×3 m2 , while the east run of stairs is parallel and directly linked to the walkway. To improve the understanding of the setting, a satellite picture of the part of the scene represented with the microscopic model is shown in Figure 3. In this simulation campaign, two versions of the environment have been designed by means of the microscopic model: a base-line that approximates the real setting and an alternative one that proposes an extension of the handrail along the pedestrian bridge, in order to physically separate the directions of flows. The two environments are used to configure five case studies: – – – – –
real world setting, all agents traveling the shortest path; real world setting, at the Nash Equilibrium; alternative scenario, with shortest path; alternative scenario, at the Nash Equilibrium; alternative scenario, at the System Optimum;
Multi-scale simulation for crowd management
(a)
11
(b)
Fig. 4. Screenshots from the simulation of the real world setting, with the SP (a) and NE (b) scenario. The blue agents are directed towards the event, while the red ones to the station square. The associated network is superimposed to the scenario. Both screenshots are taken at about 2 h and 10 min of simulated time.
(a)
(b)
Fig. 5. Screenshots from the simulation of the alternative setting, with the SP / NE scenario (a) and the SO one (b). The same color is applied to the agents, regarding their destination. Screenshots are taken at about 2 h and 40 min of simulated time.
The simulation of the first two scenarios showed that the performance of the real setting is quite low with the assumed population of agents. The 2-directional flow on the bridge, in fact, starts generating some congestion on the east side access way after around 1 h and 20 min of simulated time (near the peak of the incoming flow to the event). The congestion continues to grow with the increasing frequency of arrival of the counter-flow agents, reaching full congestion of the pedestrian bridge and its nearby after about 2 h and 10 min (see Fig. 4(a)). The congestion heavily affects the traveling times and around 3 hours are needed to reach a complete discharge of the bridge, achieving the end of the simulation around time 5 h and 30 min. With the progression of the iterations, the long traveling times induce the choice of the agents to the alternative route, gradually solving the congestion. At the Nash Equilibrium state for this environment, the jamming is almost solved and the average traveling time has been decreased to 504 seconds (see Table 1). Nonetheless, the maximum traveling time is still relatively high, due to the length
12
Crociani, L¨ ammel, Vizzari
Scenario name SP NONSEP NE NONSEP SP SEP NE SEP SO SEP
Routing strategy Separated flows Avg. travel time Max travel time Shortest path no 4544 s 13,648 s Nash equilibrium no 504 s 4,790 s Shortest path yes 237 s 1,898 s Nash equilibrium yes 239 s 2,132 s System optimum yes 232 s 1,625 s
Table 1. Average and maximum traveling times of agents in all scenarios.
of the alternative route not allowing a complete dispersion of the congestion. A comparison of the histograms of Fig 6(a) and 6(b) shows that the distribution of traveling times significantly differs: at the Nash equilibrium state two peaks are recognizable, identifying the initial portion of the population that succeeds in performing the plan without encountering congestion and another large part that experience a limited congestion that shifts the traveling times to around 600 seconds. The simulation of the second environment shows that the proposed modification that separates the flows is quite effective, despite its simplicity. In this way, the conflicts on the bridge are prevented and jamming arises only in front of the access ramps with minor effects. Thus the longer route has no advantage in terms of travel time and the Nash equilibrium becomes equal to the shortest path solution. The respective traveling times are approximately less than half as long as the ones achieved in the real environment (see the Table 1). The average and maximum traveling times for the Nash equilibrium simulation are higher than for the shortest path solution. This is not a particular finding, but this is due to the stochastic nature of the model. Overall the relative distribution of traveling times (Fig. 6(c) and 6(d)) share the same trend and data range. With this configuration of the environment and pedestrian flows, however, the Nash equilibrium state is different from the system optimum. The system optimum results in lower average and maximum travel times. The difference is more perceivable in the histogram of the travel times distribution in Fig. 6(e). Firstly, the number of agents which reached the destination in the box corresponding to the smallest travel time is increased by about 500 individuals. Moreover, there is an additional local distribution peak at around 600 seconds, (probably) generated by the individuals that accepted to take the detour in order to make space for persons behind. This effect is also observable by comparing the screenshots in Fig 5(a) and 5(b): a small percentage of agents takes the detour (two are visible in Fig 5(b)) and induce a small reduction of the congestion in front of the west access staircase.
5
Conclusion
A multi-scale pedestrian and crowd simulation approach has been proposed. The system consists of two simulation models: a microscopic CA based model is
Multi-scale simulation for crowd management
(a) SP NONSEP
(b) NE NONSEP
(c) SP SEP
(d) NE SEP
13
(e) SO SEP Fig. 6. Travel time histograms for the various scenrios. Note, the scales in (a) and (b) do not match the scale of the other plots.
combined with a fast mesoscopic queue based simulation model. While the CA is applied to complex situations with high pedestrian interactions (e.g. high density counter-flows), the queue model is employed to the wider area, where pedestrian densities are rather low. By the combination of the two different models it is possible to simulate large and complex scenarios in reasonable time frames.
14
Crociani, L¨ ammel, Vizzari
The performance of the multi-scale simulation approach has been demonstrated based on a real-world scenario. The baseline scenario reproduced the environmental settings as they exist in the real-world. The simulation results in situations of high densities and congestion are similar to what is observed in the real-world. Several improvements to the environment and crowd management strategies have been tested. It has been shown that separating flows in combination with a Nash equilibrium or system optimum routing strategy significantly reduces average and maximum travel time. The Nash equilibrium routing strategy mimics real-world travelers behavior, where travelers iteratively look for faster paths on their regular commutes. While the Nash equilibrium minimizes individual travel times, the system optimum minimizes the average or system travel time. One might argue that an exposition like the “Fuori Salone”, even if held annually, is a rather singular event whose attendants change every year and thus do not learn faster ways from their previous experience. In addition, many people may prefer to wait in long queues at high densities and overtaking a long detour without any queue. Moreover, the concept of system optimum is not based on an intrinsic behavior and would have to be enforced externally. The answer can be that one still learns a lot from the results of the Nash equilibrium and system optimum. E.g. if the results for an optimal crowd management show that that the longer path is currently faster and this could be communicated, then the acceptance would increase. In order to establish such a system one would have to dynamically measure the incoming flow and distribute the crowds dynamically to the different paths. However, the main insight—and probably also the most obvious one—is that separating flows in a crowded situation significantly improves the overall performance of the system. Indeed, even in the SP SEP scenario, where everyone uses the shortest path, the average travel time is considerably decreased compared to any scenario with non-separated flows. The smaller average travel time is achieved by a higher average speed. Since there is a one-to-one mapping between speed and density, this also implies a lower average density. A lower average density definitely improves the comfort of the visitors and significantly contributes to safety and security. Finally, it must be stated that in the underlying scenario a rather long detour is required to avoid the crowded bridge. Thus, even for the SO SEP scenario only a few agents chose the long detour and thus all three scenarios with the separated flows (i.e. SP SEP, NE SEP, and SO SEP) lead to very similar results. Density aware cost functions for the routing strategies would be an interesting future direction for this research, with a routing solution that avoids densities above a certain threshold as a result. However, as for the system optimum, those routing solutions would have to be enforced by an active crowd management.
References 1. Anh, N., Daniel, Z., Du, N., Drogoul, A., An, V.: A hybrid macro-micro pedestrians evacuation model to speed up simulation in road networks. In: Dechesne, F. (ed.) AAMAS 2011 Workshops, pp. 371–383. LNAI 7068, Springer (2012)
Multi-scale simulation for crowd management
15
2. Bandini, S., Crociani, L., Vizzari, G.: Heterogeneous Pedestrian Walking Speed in Discrete Simulation Models. In: Chraibi, M., Boltes, M., Schadschneider, A., Seyfried, A. (eds.) Traffic and Granular Flow ’13, pp. 273–279. Springer International Publishing (2015) 3. Blue, V., Adler, J.: Emergent fundamental pedestrian flows from cellular automata microsimulation. Transportation Research Record: Journal of the Transportation Research Board 1644, 29–36 (1998) 4. Bourr, E., Lesort, J.B.: Mixing microscopic representations of traffic flow: Hybrid model based on Lighthill-Whitham-Richards theory. Transportation Research Record 1852, 193–200 (2003) 5. Burghout, W., Koutsopoulos, H., Andr´easson, I.: Hybrid mesoscopic-microscopic traffic simulation. Transportation Research Record 1934, 218–225 (2005) 6. Burghout, W., Wahlstedt, J.: Hybrid traffic simulation with adaptive signal control. Transportation Research Record 1999, 191–197 (2007) 7. Burstedde, C., Klauck, K., Schadschneider, A., Zittartz, J.: Simulation of pedestrian dynamics using a two-dimensional cellular automaton. Physica A: Statistical Mechanics and its Applications 295(3 - 4), 507–525 (2001) 8. Cascetta, E.: A stochastic process approach to the analysis of temporal dynamics in transportation networks. Transportation Research B 23B(1), 1–17 (1989) 9. Chooramun, N., Lawrence, P., Galea, E.: Implementing a hybrid space discretisation within an agent based evacuation model. In: Peacock, R., Kuligowski, E., Averill, J. (eds.) Pedestrian and Evacuation Dynamics 2010, pp. 449–458. Springer, Berlin, Heidelberg, New York (2011) 10. Chraibi, M., Seyfried, A., Schadschneider, A.: Generalized centrifugal-force model for pedestrian dynamics. Phys. Rev. E 82(4), 46111 (2010) 11. Crociani, L., L¨ ammel, G.: Multi-destination pedestrian flows in equilibrium: a cellular automaton based approach. Computer-Aided Civil and Infrastructure Engineering (forthcoming) 12. Crociani, L., Manenti, L., Vizzari, G.: MAKKSim: MAS-Based Crowd Simulations for Designer’s Decision Support. In: Demazeau, Y., Ishida, T., Corchado, J.M., Bajo, J. (eds.) PAAMS. vol. 7879, pp. 25–36. Springer (2013) 13. Dada, J.O., Mendes, P.: Multi-scale modelling and simulation in systems biology. Integrative Biology 3(2), 86–96 (2011) 14. Dijkstra, E.: A note on two problems in connexion with graphs. Numerische Mathematik 1, 269–271 (1959) 15. Espi´e, S., Gattuso, D., Galante, F.: A hybrid traffic model coupling macro and behavioural micro simulation. Annual Meeting Preprint 06-2013, Transportation Research Board, Washington D.C. (2006) 16. Fl¨ otter¨ od, G., L¨ ammel, G.: Bidirectional pedestrian fundamental diagram. Transportation research part B: methodological 71(C), 194–212 (2015) 17. Gawron, C.: An iterative algorithm to determine the dynamic user equilibrium in a traffic simulation model. International Journal of Modern Physics C 9(3), 393–407 (1998) 18. Helbing, D.: A fluid dynamic model for the movement of pedestrians. arXiv preprint cond-mat/9805213 (1998) 19. Helbing, D., Hennecke, A., Shvetsov, V., Treiber, M.: Micro- and macro-simulation of freeway traffic. Mathematical and Computational Modelling 35, 517–547 (2002) 20. Helbing, D., Moln´ ar, P.: Social force model for pedestrian dynamics. Physical review E (1995) 21. Henderson, L.: The statistics of crowd fluids. Nature 229(5284), 381–383 (Feb 1971)
16
Crociani, L¨ ammel, Vizzari
22. Hoogendoorn, S., Bovy, P.: Dynamic user-optimal assignment in continuous time and space. Transportation Research Part B: Methodological 38(7), 571–592 (2004) 23. Krajzewicz, D., Erdmann, J., Behrisch, M., Bieker, L.: Recent development and applications of SUMO - Simulation of Urban MObility. International Journal On Advances in Systems and Measurements 5(3&4), 128–138 (December 2012) 24. Kretz, T., Lehmann, K., Hofs¨ aß, I.: User equilibrium route assignment for microscopic pedestrian simulation. Advances in Complex Systems 17(2), 1450010 (2014) 25. L¨ ammel, G., Chraibi, M., Kemloh Wagoum, A., Steffen, B.: Hybrid multi- and inter-modal transport simulation: A case study on large-scale evacuation planning. Transportation Research Record (forthcoming) 26. L¨ ammel, G., Fl¨ otter¨ od, G.: Towards system optimum: Finding optimal routing strategies in time-tependent networks for large-scale evacuation problems. In: Mertsching, B., Hund, M., Aziz, Z. (eds.) KI 2009: Advances in Artificial Intelligence, LNCS (LNAI), vol. 5803, pp. 532–539. Springer, Berlin Heidelberg (2009) 27. L¨ ammel, G., Fl¨ otter¨ od, G.: A CA model for bidirectional pedestrian streams. Procedia Computer Science 52, 950–955 (2015) 28. L¨ ammel, G., Grether, D., Nagel, K.: The representation and implementation of time-dependent inundation in large-scale microscopic evacuation simulations. Transportation Research Part C: Emerging Technologies 18(1), 84–98 (February 2010) 29. L¨ ammel, G., Kl¨ upfel, H., Nagel, K.: The MATSim network flow model for traffic simulation adapted to large-scale emergency egress and an application to the evacuation of the Indonesian city of Padang in case of a tsunami warning. In: Timmermans, H. (ed.) Pedestrian Behavior, chap. 11, pp. 245–265. Emerald Group Publishing Limited (2009) 30. L¨ ammel, G., Seyfried, A., Steffen, B.: Large-scale and microscopic: a fast simulation approach for urban areas. Annual Meeting Preprint 14-3890, Transportation Research Board, Washington, D.C. (2014) 31. Michon, J.: A critical view of driver behavior models: What do we know, what should we do? In: and Evans, L., Schwing, R.C. (eds.) Human Behavior and Traffic Safety, pp. 485–524. Springer US (1985) 32. Nash, J.: Non-cooperative games. The Annals of Mathematics 54(2), 286–295 (1951) 33. Raney, B., Nagel, K.: Iterative route planning for large-scale modular transportation simulations. Future Generation Computer Systems 20(7), 1101–1118 (2004) 34. Simon, P., Esser, J., Nagel, K.: Simple queueing model applied to the city of Portland. International Journal of Modern Physics 10(5), 941–960 (1999) 35. von Sivers, I., K¨ oster, G.: Dynamic stride length adaptation according to utility and personal space. Transportation Research Part B: Methodological p. 30 (Jan 2014) 36. Taillandier, P., Vo, D.A., Amouroux, E., Drogoul, A.: Gama: a simulation platform that integrates geographical information data, agent-based modeling and multiscale control. In: Principles and Practice of Multi-Agent Systems, pp. 242–258. Springer (2010) 37. Weidmann, U.: Transporttechnik der Fussg¨ anger - Transporttechnische Eigenschaftendes Fussg¨ angerverkehrs (Literaturstudie). Literature Research 90, Institut f¨ uer Verkehrsplanung, Transporttechnik, Strassen- und Eisenbahnbau IVT an der ETH Z¨ urich (1993)