Multi-scale Techniques for Document Page Segmentation Zhixin Shi and Venu Govindaraju Center of Excellence for Document Analysis and Recognition (CEDAR), State University of New York at Buffalo, Amherst 14228, USA E-mail:
[email protected] Abstract Page segmentation algorithms found in published literatures often rely on some predetermined parameters such as general font sizes, distances between text lines and document scan resolutions. Variations of these parameters in real document images greatly affect the performance of the algorithms. In this paper we present a novel approach for document page segmentation using a multi-scale technique. An efficient implementation of a local connectivity algorithm transforms a document image into a parameter domain in which a parameter value at a pixel location represents a connectivity property for its neighboring foreground pixels in the original document image. Then a top-down approach with a linear search reveals the document regions at each scale levels as text block, text lines and graphics. We consider our algorithm a transform based multi-scale method. Our ongoing research shows that the algorithm is robust for variations of document parameters.
1 Introduction Document page segmentation is an important processing in a document image understanding system. The goal of a page segmentation process is to separate a document image into its regions such as text, tables, images, drawings and rulers. Generally page segmentation for a page layout analysis include a geometric page layout and logical page layout analysis. The geometric page layout of a document is to specify the geometry of the maximal homogeneous regions and their classifications(text, table, images, drawing, etc.). Logical page layout analysis is to determine the type of page, assign functional labels such as title, logo, footnote, caption, etc., to each block of the page, determine the relationships of these blocks and order the text blocks according to their reading order as a one dimensional stream [5]. Techniques for page segmentation and layout analysis are broadly divided in to three main categories: top-down,
bottom-up and hybrid techniques [7]. Top-down techniques start by detecting the highest level of structures such as columns and graphics, and proceed by successive splitting until they reach the bottom layer for small scale features like individual characters. For this type of procedures, a priori knowledge about the page layout is necessary. It relies on methods including run-length smearing [10], projection profile methods [11], white streams [8], Fourier Transform [3], etc. Bottom-up methods start with the smallest elements such as pixels, merging them recursively in connected components or regions of characters and words, and then in larger structures such as columns. They are more flexible but may suffer from accumulation of errors. It makes use of methods like connected component analysis [5], run-length smoothing [10], region-growing methods [4], and neural networks [9]. Most of these methods require high computation. Many other methods that do not fit into either of these categories and therefore are called hybrid methods. Among these methods are texture-based [1] and Gabor filter [6]. In this paper we present a multi-scale technique based on multi-resolution view of a document similar to human’s recognition of document objects. For each input binary document image, we first compute a dynamic local connectivity map (DLCM). The local connectivity is defined as distance between adjacent foreground pixels along certain directions. An efficient implementation of a local connectivity algorithm transforms a document image into a new image in which each pixel value at a pixel location represents a connectivity property for its neighboring foreground pixels in the original document image. A top-down approach with a linear search reveals the document regions at each scale levels in a nested fashion as text block, text lines and graphics. We consider our algorithm a transform based multiscale method. In section 2 we give a brief summary of methods related to our method. Then we present our method in section 3. The on-going experiments and future work will be discussed in section 4.
2 Background Among the published methods, the X-Y tree method by Nagy et al. [2] is an approach which segments a document in multiple steps into a tree structure consisting nested rectangular blocks. The method presents an intuitive procedure in which a document is segmented into big blocks through horizontal or vertical cuts. And then the same process proceeds in each one of the sub-blocks. The characteristic of the method is its tree structure that suggests a logical order of the document. The drawback of the method is its assuming that the text blocks in document images are in rectangular shapes which are well separated by rectangular streams of background pixels. Run-length smearing [10] is a popular method that has been used in combination with many other ideas. It is basically a simple image processing done as following. Along each scan-line of a binary image horizontally and/or vertically, it turns the color of small background runs into the color of foreground. The process ends up with a blurring effect that glues all the close foreground pixels together. runlength smearing efficiently increases the sizes of foreground connected components. It serves as a foundation for many other methods such as projection profile, connected component grouping, neural network and many background based methods including white stream method[8]. The problem in using run-length smearing method is that it requires a fixed threshold for the size of small background runs to smear. If the threshold is too small, the smearing may not be enough to have the expected effect. Determination of such a threshold is often done either empirically or through estimation of sizes of gaps between text blocks, text lines or sizes of printed character fonts. These parameters in terms of different sizes are often bottleneck of many block segmentation algorithms. In this paper we present a novel method of using a Dynamic Local Connectivity Map (DLCM) for block segmentation. Our method is based on the understanding of fundamental structure of document images. Although as an image, the original one dimensional sequential relations in any text streams and the isolations between different document information are lost, The grouping emphasis and information structure are represented and preserved by the layout arrangement in the image. Generally different streams of text and graphics are clearly separated visually by gaps of background pixels. Figure1 shows a example complex document with embedded graphics. The pixels representing same piece of information are relatively evenly distributed. We found that the distances between foreground pixels of a binary document image plays the central role in block segmentation. The statistics of printed document images also show document objects as a hierarchical structure. The linkage between the objects in the hierarchy is an ordered array of distances: the biggest distance sepa-
Figure 1. An example of a printed document image with embedded graphics.
rated the headings, page numbers, logos and titles from the body of a document page; Then smaller distances separate the text columns, graphics, tables and text blocks; At last the even smaller distances separate text lines, words and printed characters. Since the distances separating document blocks are in multiple levels, it is difficult to choose one single threshold for them to segment blocks. It is also impossible to choose one set of threshold values for segmentation applied on all kinds of document images. Multiple thresholds should be used and the threshold values have to be determined dynamically. For an input binary document image we first build its DLCM which is a transform of the image into a parameter domain. The transform can be viewed as a new image. At each pixel position, if the pixel value at the position in the original image is black(foreground color), then the pixel vale is set to 0. Otherwise the pixel value is set to be the distance between the two neighboring foreground pixels in the original image along certain directions. To define the distance, we have choices from the horizontal or vertical background run-length between the two neighboring foreground pixels, the minimal value of the two run-lengthes or some combination of the two, for example, the average of the two values. For our experiment, we have chosen to use the minimal value of the run-length along horizontal and vertical directions for block segmentation. In next section we present the details of our method and its implementation.
3 Our Method We assume the input images are binary document images scanned with resolutions from 200 to 400 dpi. These resolutions are required by most of OCR algorithms. For page segmentation we do not need such high resolutions. Without loss of performance, we down sample the images to a quarter of the original sizes before running our method.
3.1 Multi-scale Document Objects A Dynamic Local Connectivity Map (DLCM) can be built easily by scanning through a document image twice. We first locate two integer buffers with sizes of the input image(quarter-down-sampled from original image). One is for horizontal run-length and the other is for vertical runlength. At each pixel position, if the pixel value in the input image is black(foreground), we set the buffers at the position a value 0. Otherwise the position in the input image is a background pixel and we set the values at the position in the buffers the background horizontal and vertical run-lengthes respectively. Then a DLCM is represented by a grey scale image which is made from the two integer buffers. Its size is of the input image. Each pixel value is the minimal value of the two run-length values in the buffers at the corresponding position, see Figure 2. To get a real grey image, we scale the pixel values to be in the range of 0 to 255. We directly call the grey image DLCM in the following sections.
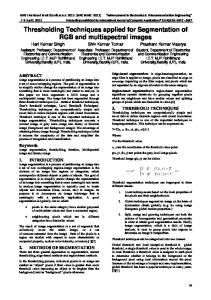
example binarization at 255 will fill entire image with foreground color. There is only one connected component in this case and it represents the entire document page as one block. This is actually considered as root of the document image. Starting from here, the connected components from the binarized DLCM at lower levels are finer partitions of the document image. If we follow this binarization - connected component procedure by using binarization threshold values from 255 downward, we will be able to build a partition tree, see examples in Figure 3. A single document block in a earlier level may be partitioned to several blocks at a lower level. Blocks on a same level can also be ordered by using their positions. For example the relative positions of their bounding boxes can be used to determine their orders.
(a)
(b)
(c)
(d)
(e)
(f)
Figure 2. Part of a DLCM image. The pixel values represent the nearest distances between neighboring foreground pixels horizontally or vertically. Each non-zero pixel value in a DLCM image represents a size of a nearest local gap between a pair of foreground pixels. If we binarize a DLCM by using a threshold t, then all the horizontal or vertical gaps between black pixels with sizes less or equal to t will be filled(smeared). The foreground pixels are glued together by the fillings into connected components each covers a block of text or graphics, or part of these document objects. Since a DLCM is a regular grey scale image with pixel values ranging from 0 to 255, there are up to 255 possible values for gap sizes. Binarization of a DLCM at each one of the possible values results in a partition of the document image into blocks. For
Figure 3. Binarizing DLCM at different threshold value t reveals multi-scale document blocks (a) DLCM image; (b) t=240, page number and headings are clearly separated; (c) t=150, separates footage; (d) t=130, columns are separated; (e) t=100, separation of major text blocks; (f) t=1, the extreme case in which the binarized DLCM becomes the input document image.
3.2 Thresholding for Multi-scale Objects Even with our re-scaling of the pixel values in DLCM, we still have 256 possible choices for different such kind of glued images. To find the right segmentation of document blocks, for each one of these binary images we need to compute its connected components. This is expensive although there exits a liner order algorithm for computing connected components. Still not willing to use any other document parameters, we want to find out relations between thresholding of DLCM and number of connected components corresponding to segmentation of page blocks. We have investigated these relations by using a set of 56 scanned machine printed document images from various sources including scientific journals, magazines and book pages. For each document image we plot the curve of the number of connected components vs threshold value t. See Figure 4. The conclusions of these plots are the following. First, the number of component does not change continually with the change of the threshold value t. In the other word, at many local neighborhood of t’s, the corresponding number of connected components does not change much or does not change at all. The curve in Figure 4 is in a step fashion. Second, we observe that the numbers of connected components at beginning of the curves are always huge and then quickly move down to some reasonable levels. This is a feature which we can use in a training of similar type of document images for finding a lower bound for threshold t.
Our second investigation is to find out the distribution of the distances. Since the pixel values in DLCM is directly related to the distances, we calculated the distribution of the pixel values in DLCM and plotted them in Figure 5. Distance distribution in DLCM shows that the distances are distributed sparsely. From our experiment images the distributions are always showing the sparse patterns of about 25 small neighborhood values with 10 pixels apart from each other. This tells us that the number of effective threshold values for different binarization of DLCM is even smaller. Since the computation of distance distribution is straightforward and can be done quickly, the determination of the small number of possible effective threshold values can be practically done dynamically for each input image. Combined with the conclusions we found earlier, efficient computation for segmentation of document images by our multiscale connected component analysis in a limited number of binarized DLCM images becomes possible.
Figure 5. Distance distribution in DLCM shows that the distances are distributed sparsely. From our experiment images the distributions are always showing the sparse patterns of about 25 small neighborhood values with 10 pixels apart from each other.
3.3
Figure 4. Threshold vs number of connected component in binarized BLCM. The horizontal direction represent threshold value t from 0 to 255. The vertical direction is the number of connected components.
Document image Segmentation in a Hierarchy
Document blocks are segmented in a hierarchical order. First, based on above discussion, we choose a safe range of threshold values t. From our experiment, the threshold values can generally be 10 different integer values. This is done by firstly choosing a lower bound of threshold values, in our experiments, we always found safe to use 50 as the lowest threshold. Then for each image a sparse distance distribution such as Figure 5 is calculated for choosing the candidates of threshold values. With these threshold values, from large to small, we binarize the DLCM and compute the connected components for document partitions. Based on certain conditions we decide to use the connected components for determining the document blocks or otherwise
move on to the next threshold value for a different binarization. Our method concerns segmentation of column blocks and graphics more than vertically aligned text blocks. This is because our method segments text lines rather easily. Using the separated text lines, a simple grouping for vertically aligned text blocks can be done in a straightforward way. Therefore the condition for wether we take a threshold level is simply set as wether we break the components at this level to be small enough to exhibit a column separation. Our rule for the judgement is measuring the biggest component in horizontal size, to see if it is smaller than 2/3 of the horizontal size of the input DLCM at this level. If a threshold level is taken for the determination of segmentation, we use the connected components in the binarized DLCM to form the document blocks. Those components with similar horizontal positions are grouped first. Here the horizontal bounding box sizes and positions are treated as similar due to the the differences between them are small, see within a 5% of the component size. If a component is mostly included in the bounding box of another component, we group them too. The grouped components provide covers for the page blocks in the input document image. The binarization procedure then continues by using each one of the block areas in DLCM as a new DLCM to repeat the above process, until the available threshold values are exhausted or a size constraint on connected components is met.
Figure 6. A example of block segmentation using our new idea.
4 Experiments and Conclusion For the research especially emphasized on finding feasibility of our method, we have chosen images from several difference document image sources. These include document pages scanned from IEEE journals, magazines and books. A total of 56 images in three rough categories are scanned with 300 dpi resolution. The three categories are for images with simply aligned multiple columns such as IEEE journal pages, single column book pages and complex magazine pages with multiple columns and graphics embedded in text. Figure 6 shows an example result. Subjective evaluations show that our method is a robust approach for segmentation of most printed documented images. An objective evaluation scheme is under consideration. Our research work is still continuing. The focus is on an efficient implementation of the algorithm. Other research is on dealing with the false connections between different document objects due to binarization noise. The possible solution is using our earlier designed Fuzzy Run-length which is a relaxation of run-length with tolerance for noise.
References [1] D. Chetverikov, J. Liang, J. Komuves, and R. Haralick. Zone classification using texture features. In Proc. of Intl. Conf. on Pattern Recognition, volume 3, pages 676–680, 1996. [2] S. S. G. Nagy and S. Stoddard. Document analysis with expert system. Procedings of Pattern Recognition in Practice II, June 1985. [3] M. Hose and Y. Hoshino. Segmentation method of document images by two-dimensional fourier transfor-mation. System and Computers in Japan. [4] A. Jain. Fundamentals of digital image processing. Prentice Hall, 1990. [5] A. Jain and B. Yu. Document representation and its application to page decomposition. IEEE trans. On Pattern Analysis and Machine Intelligence, 20(3):294–308, March 1998. [6] A. K. Jain and S. Bhattacharjee. Text segmentation using gabor filters for automatic document processing. Machine Vision and Applications, 5(3):169–184, 1992. [7] O. Okun, D. Doermann, and M. Pietikainen. Page segmentation and zone classification: The state of the art. In UMD, 1999. [8] T. Pavlidis and J. Zhou. Page segmentation by white streams. Proc. 1st Int. Conf. Document Analysis and Recognition (ICDAR),Int. Assoc. Pattern Recognition, pages 945– 953, 1991. [9] C. Tan and Z. Zhang. Text block segmentation using pyramid structure. SPIE Document Recognition and Retrieval, San Jose, USA, 8:297–306, January 24-25 2001. [10] F. Wahl, K. Wong, and R. Casey. Block segmentation and text extraction in mixed text/image documents. CGIP, 20:375–390, 1982. [11] D. Wang and S. Srihari. Classification of newspaper image blocks using texture analysis. CVGIP, 47:327–352, 1989.