Multi-Sensor 3D Image Fusion and Interactive Search1 W. D. Ross, A. M. Waxman, W. W. Streilein, M. Aguilar2, J. Verly, F. Liu, M. I. Braun, P. Harmon, and S. Rak Massachusetts Institute of Technology Lincoln Laboratory Lexington, MA, 02420, U.S.A.
[email protected]
Abstract – We describe a system under development for the three-dimensional (3D) fusion of multi-sensor surface surveillance imagery including EO, IR, SAR, multispectral, and hyperspectral sources. Our appraoch is founded on biologically–inspired image processing algorithms. We have developed a processing architecture enabling the unified interactive visualization of fused multi-sensor site data which utilizes a color image fusion algorithm based on retinal and cortical processing of color. We have also developed interactive web-based tools for training neural network search agents capable of automatically scanning site data for the fused multisensor signatures of targets and/or surface features of interest. Each search agent is an interactively trained instance of a neural network model of cortical pattern recognition called Fuzzy ARTMAP. The utilization of 3D site models is central to our approach because it enables the accurate multi-platform image registration neccessary for color image fusion and the designation, learning and seach for multi-sensor fused pixel signatures. Interactive stereo 3D viewing and fly-through tools enable efficient and intuitive site exploration and analysis. Web-based remote visualization and search agent training and utilization tools facilitate rapid, distributed, and collaborative site exploitation and dissemination of results. Keywords: sensor fusion, image fusion, data mining, target recognition, 3D visualization, collaborative exploitation, Fuzzy ARTMAP.
1 Introduction Remotely sensed image datasets are growing rapidly with the ever-increasing variety, number, and coverage area of both airborne and satellite sensors. The timely exploitation of these data for civilian as well as military applications requires techniques for efficient visualization and analysis of multi-dimensional image information. Our 1
approach has involved the development of biologically inspired algorithms for fusing multi-sensor imagery into unified 3D color visualizations, and to support an interactive tool for training software agents capable of searching across site data for multi-sensor signatures. Our fusion system enables informative and intuitive stereo 3D site fly-throughs and the web-based interactive training and utilization of search agents for the efficient exploitation of a variety of challenging datasets. Our approach is characterized at the highest system level by three stages of processing. First, we utilize 3D site models in order to accurately register multi-sensor imagery collected from different airborne or spaceborne platforms. Second, we apply our color fusion algorithms to the registered multi-sensor image data in order to produce unified visualizations of the complementary information provided by the different sensor types. These color fused image products can then be painted onto computer graphcial representations of the 3D site model for interactive stereo site fly-through. Third, we apply our image ‘mining’ tools which enable the interactive analysis of the registered and fused multi-sensor image data. These tools have been built into web-based clientserver interfaces enabling remote and collaborative access to views on the 3D fused site data as well as the capability to train and utilize software agents for searching site imagery for targets or surface features of interest. This paper presents an overview of our multi-sensor fusion system. We present a second paper at this conference which covers the details of our image mining tool in more depth [18]. Section 2 of this paper describes the overall system architecture as well as the algorithmic approach that we have taken. Section 3 describes our utilization of 3D site models for the purpose of the accurate registration of multi-perspective surface surveillance imagery. Section 4 explains the color image fusion algorithms that we utilize and shows results on a variety of data sets. Section 5 describes our web-based
This work was sponsored by the U.S. National Imagery and Mapping Agency, and in part by the U.S. Air Force, under U.S. Air Force Contract F19628-95-C-0002. Opinions, interpretations, conclusions, and recommendations are those of the authors and not necessarily endorsed by the U.S. Air Force. 2 Current address : MCIS Department, Jacksonville State University, Jacksonville, AL 36265, U.S.A.
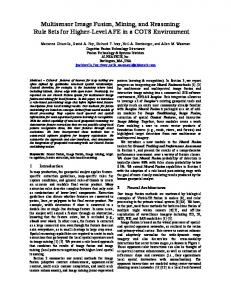
Figure 1: Multi-sensor 3D image fusion system architecture. Multi-sensor site imagery from different platforms are registered to each other utilizing a model of the 3D site geometry. When the image dataset is sufficiently rich, the site geometry can be derived from the multi-sensor imagery itself. Registered imagery comprises a geo-referenced database that can drive color fused visualizations, and support collaborative analysis through the interactive training of software agents capable of searching for distinct target and terrain signatures.
interactive tools for site data exploration and ‘mining’. The summary section provides a discussion of the advantages and extensibility of our approach.
2 Multi-Sensor 3D Image Fusion Past site analysis utilizing multi-sensor surface surveillance imagery has involved the separate, and sometimes comparative, visualization of multiperspective and multi-modality image collections. This process can be slow and exhausting since it burdens the image analyst (IA) with the task of spatially organizing, combining, and comparing information across images, in addition to the task of actually searching or analysing that information to discover an event of interest. The promise of multi-sensor 3D image fusion is the organization of the complementary site information collected by multiple sensors into a single unified computer graphical visualization and database analysis environment allowing more efficient, intuitive, and informative exploration and analysis by the IA. There are several advantages of our approach which is characterised by the synthesis of 3D image registration, color image fusion, and interactive visualization and image ‘mining’ tools. For enhanced site visualization we employ a combination of color image fusion algorithms and 3D site models. Our color image fusion algorithms bring together complementary information from multiple types
of sensors into a single, easily interpreted visualization. Color fusion renders non-literal data, such as infrared and radar imagery, in the more familar context of visible imagery, making the information more readily accessible to the non-expert in the natural color contrasts which the human visual system is tuned to perceive. When this color fused imagery is painted onto the 3D context of a site model, it can be intutitively explored by interactive computer graphical site fly-through in stereo. Multi-sensor fused pixel data offer spectrally rich signatures by which targets and surface features can be distinguished from backgrounds. These revealing signatures are harder to spoof through the use of camouflage or clutter, and tend to be more robust to noise and variations in the environment including time of day, weather, and seasonal influences on single sensor image quality. For this same reason, multi-sensor pixel information proves useful for target recognition and the extraction of maps of surface features. After successful target or feature search signatures have been discovered, such as through the interactive training of software search agents, they can be geo-located to the accuracy of the underlying georeferenced site model. In addition, the distiguishing characteristics of the target of interest can be revealed. This information can be useful in making decisions about which sensor information is critical for a particular search task in a particular environment.
Sensor imagery collected from different airborne or spaceborne platforms provides different perspectives on a 3D site. Accurately registering this data requires an accurate model of the underlying 3D site geometry. This geometry can be dervied from multi-perspective imagery itself, from purposefully collected stereo image pairs, or from ground survey information. Registration of multisensor imagery produces a geo-referenced intuitively organized database suited to efficient visualization through natural interactive site fly-throughs. Registered imagery can then be color fused to produce unified color composites that extract and enhance complementary multi-sensor data. The registered and fused image data can then be interactively ‘mined’, using tools that enable an analyst to train and deploy software agents capable of searching across the site data for the distinctive multi-sensor signatures of targets or land features of interest. Figure 1 shows our overall system concept. The image processing algorithms that we have developed to color fuse registered site imagery, and to enable the recognition of multi-sensor fused signatures are based on models of the human visual system (HVS). Biological visual systems, including the HVS, provide powerful existence proofs of successful multi-sensor image fusion architectures. The human retina, for example, has three cone receptor types, each of which is maximally sensitive to a different wavelength or color of visible light. Retinal and cortical networks process this ‘multi-sensor’ information to extract and enhance complementary information and derive a unified color representation [1,2,3]. Our color image fusion algorithms are based on mathematical models of this processing and, in a similar fashion to their biological counterparts, they extract and enhance complementary sensor information to support a unified color visualization. In the HVS, the outputs of retinal and early cortical color processing are inputs to the ventral or inferotemporal cortical processing stream, which is known to be largely concerned with recognizing object categories and object identities [3]. Our interactive image mining tool is founded on a neural network pattern recognition system that was originally developed as a model of this cortcal processing. Through the use of an interactive search agent training interface, example outputs of our color image fusion process are selected to provide the training set inputs to this neural network pattern recognition engine called Fuzzy ARTMAP [4,5].
3 3D Image Registration An overly simplistic, and yet still widely employed approach to registering remotely sensed images, involves the manual selection of tie points between the images and then the warping of one image to another. This process is difficult and time-consuming, since the number of tie points neccessary to make a good fit (based on polynomial
warping) increases rapidly with the complexity of the surface geometry of the site3. Multi-platform, and thus multi-perspective, sensor collects for a site can be better registered through the utilization of 3D site geometry models. In this case, the 3D geometry of the site can be utilized as a screen onto which the imagery is projected. The remaining problem becomes estimating the position, orientation, and field of view of the sensor relative to the site at the time of the collection. The imagery can then be projected onto the site model from a corresponding perspective. In our work, we make use of site model geometries obtained by a variety of methods. Digital Elevation Models (DEMs) or Digitial Terrain Elevation Data (DTED) are available at various resolutions and elevation accuracies for much of the land-area of the earth. These have been generated from ground surveys, or from disparity based structure extraction from stereoscopic or multi-platform image collects. Both building and terrain models can also be manually extracted from perspective imagery using commerical off-the-shelf (COTS) tools. When possible, we have used accurate mountainous and urban site models generated by semi-automatic systems called RealSite (building modeling) and N-View (terrain modeling) developed by Harris Information Systems. These tools achieve accurate site models from sets of many images collected from a variety of perspectives on a site. They compute site geometries by iterative relaxation toward a minimum error estimation of site geometry and corresponding imaging parameters, such as sensor positions, orientations, and fields of view. DEMs and DTEDs are maps of elevation estimates measured at regular intervals. These can be converted into triangulated irregular networks (TINs) using COTS geographical information systems (GIS). TINs minimize the number of triangles neccessary to approximate a site model, yeilding a representation that can be more responsively manipulated during a computer graphical flythrough. GIS tools can also be used to manually register imagery to site models. Once source imagery is registered to a site model, the images can be registered to each other by choosing a common viewing perspective and backing off images from each modality or collect. It frequently proves best to choose the viewing perspective from which the source
3
A simple way to understand this problem is to consider that 3 points are needed to register an image, or region of an image, to a single flat plane on the ground. If the ground surface is well modeled by a convoluted surface composed of many planar facets, then 3 tie points are needed for each of these planar facets and they must be well chosen to cover each of the planar regions. In a mountainous or urban scene, in which realisitc models are composed of thousands of planar surfaces, an alternative approach to multi-sensor registration is critical.
Figure 2 : Multi-sensor image fusion architecture. All stages of processing are founded on a nonlinear image processing operator which models how neurons in the human visual system extract spatial and color contrasts from imagery. After image registration, individual sensor images are contrast enhanced and normalized. Next, cross-sensor contrasts are extracted and enhanced by so-called single-opponent and then double-opponent sensor pairings. Sensor contrasts are then mapped to the color contrasts in a display that the human visual system is best tuned to perceive.
image of the highest resolution or quality was taken. The multi-sensor images backed off at this common viewing perspective can then be color fused and painted back onto the 3D models to support interactive stereo fly-through. Color fused perspective views can then also be accessed through interactive web-based client-server interfaces. Dissemination over these potentially low-bandwidth channels is enabled by wavelet-based image compression techniques [16].
4 HVS Models for Image Fusion Our image fusion architectures are motivated by the biological computational processes of the human retina and the primary visual cortex. The three different cone cells in the retina are sensitive to the short, medium, and long wavelengths of the visible spectrum. The outputs from these photoreceptors are then contrast enhanced within band by center-surround spatial opponent processes at the bipolar cells [2]. In later stages (ganglion cells in retina and V1) these signals are contrast enhanced by center-surround processes between the different bands. This opponent-color processing separates (i.e. decorellates) the complementary information that each band contains. This insight into how the visual system contrasts and combines information from different spectral bands provides one example of a working multi-spectral fusion system. Other biological fusion systems of
relevance are the visible / thermal processing pathways of the rattlesnake and python [6,7]. An initial stage in our opponent-sensor processing architecture normalizes and sharpens wide-dynamic range imagery in separate sensor processing channels allowing visualization on limited dynamic range displays without loss of significant scenic information. Next, single- and double-opponent processing operates to decorrellate image information across sensor channels to remove redundancy and enhance complementary information or contrasts. Opponent-sensor contrasts are then mapped to those color contrasts in a visual display that the human visual system is tuned to perceive. In particular, red-green and blue-yellow contrasts are driven by opponent-sensor contrasts. These color contrasts are a close match to the opponent colors that the human retina has evolved to perceive, and in fact, correspond to the two color contrast channels in the YIQ color space used to code and transmit television imagery. As a final stage of color processing, the hue space or ‘tint’ of the final fused imagery can be rotated to produce more natural imagery. Hue space rotation is a global color adjustment and does not involve the separate selection of colors for different objects or land surface types in the imagery. This opponent-sensor color image fusion algorithm has proven successful, not only for processing multi-sensor remote sensing imagery, but also for creating a color night vision capability through fusing visible and
Figure 3 : Comparison of direct mapping to hvs opponent-sensor fused results on Landsat and Radarsat imagery. (a) Direct mapping of visible, long-wave infrared, and SAR bands to green, red, and blue channels respectively. (b) HVS-motivated opponent-sensor fusion result. Direct mapping tends to obscure the highresolution visible detail, and through emphasizing the redundant information across the bands, washes out the complementary information. Our algorithm produces a color fused image in which the complementary information across the sensors is enhanced and presented in spatial and color contrasts. thermal infrared imagery [8,9,10]. Prior to our introduction of opponent-sensor image fusion, other methods of image fusion were based upon maximizing image contrasts across multiple scales via pixel comparisons and image blending [11,12,13]. Human factors testing has shown that the resulting gray-scale fused images do not provide the same target pop-out as our color fused results [14,15]. The fusion architecture in Figure 2 shows the specific architecture we have used to fuse multi-sensor image information from visible, infrared, and synthetic aperture radar sources. As shown, after an initial stage of within band contrast enhancement and normalization, the infrared and visible bands were contrasted to drive the red-green display contrasts, while the synthetic aperature radar (SAR) and visible bands were contrasted to drive the blueyellow display contrasts. Figure 3 shows the results of applying this architecture to the fusion of Landsat and Radarsat imagery. We averaged bands 1-3 of the Landsat collect to create our visible image, and the long-wave thermal infrared band 6 was used, along with the a Radarsat C-band SAR. The opponent-sensor fused color image in Figure 3b preserves the high resolution literal detail of the visible imagery, revealing an extensive road network, as well as the infrared contrasts between different soil and terrain types, and the strong radar returns from buildings in the urban areas. Much of the complementary multi-sensor
information, perhaps most notably the road detail from the visible imagery, gets washed out in the direct color mapping shown in Figure 3a. One of the strengths of the opponent-sensor fusion architecture is that it can easily be extended to handle different types and numbers of input imagery. Figure 4 shows the results of a 4-band fusion of visible, nearinfrared, near short-wave infrared, and longer short-wave infrared imagery of San Francisco, CA. The 4 bands were actually produced through an adaptive averaging of similar contiguous wavelength bands of the AVIRIS 224-band hyperspectral sensor. Experimentation revealed that opponent pairings of the near short-wave infrared and visible images, and of the longer short-wave infrared and near infrared images, gave the most contrastive inputs to the blue-yellow and red-green display color contrast channels, respectively. Figure 4b reveals road networks as well as soil and vegetation contrasts that are washed out in the direct mapping shown in Figure 4a. Figure 5 shows another example of 4-band fusion in which airborne multispectral imagery, collected in the red, green, blue, and near-infrared of Monterey, CA., was combined to enhance scenic color contrasts over natural color imagery. The image in Figure 5 was produced during an interactive fly-through of a 3D site model of the Monterey Naval Postgraduate School, painted with our color fused product. Such views give revealing perspectives on site data, and can be useful for mission
Figure 4 : Comparison of (a) direct mapping to (b) HVS opponent-sensor fused results on 4-bands, extracted by an adaptive pooling of the visible, near-infrared, short short-wave infrared, and long short-wave infrared of the 224 band AVIRIS hyperspectral sensor, for an airborne collection over San Francisco, CA. As in Fig. 3, the HVS opponent-sensor fusion shows improved preservation of the complementary information from the different bands as compared to a direct mapping of the near-infrared band to green, the short short-wave infrared band to red, and the visible band to blue.
planning and rehearsal. In fact, the Monterey color fused 3D site model was produced to support the Marine’s Urban Warrior Experiment held in Monterey and San Franciso, in March of 1999.
imagery, as well as single and double opponent-pair images. This data can then be further processed to extract registered maps of image features such as oriented boundaries or textures as well as 3D features. A stack of images results which consists of a vector of data for each pixel in an overhead view of the site. These multi-sensor fused vectors provide a rich signature which can be ‘mined’ to discover objects or surfaces of a similar type. As mentioned, the pattern recognition engine that we employ to learn and search for target or surface type signatures is a neural network of cortical pattern processing called Fuzzy ARTMAP. The second paper we’re presenting at this conference goes into more depth about this algorithm and the site mining user interface [18].
Figure 5 : 3D color fused 4-band multispectral imagery (red, green, blue, and near-infrared) from an airborne collection over Monterey, CA. This image was extracted during an interactive site fly-through on an SGI NT 540 PC. Perspective views such as this one can also be accessed through web-based client-server interfaces incorporating wavelet-based JPEG2000 image compression.
5 Interactive Web-based Interfaces for Visualization and Image Search The process of 3D image registration and opponent-sensor image fusion results in a registered database of source
We have also developed web-based site visualization and image mining interfaces which facilitate the real-time remote and collaborative exploitation of multi-sensor 3D fused site data. One component of the interface enables viewing of a low-resolution or untextured version of the 3D site model. This model can then be interactively rotated and manipulated to reveal a perspective view of interest. The click of a “view request button” then obtains a full resolution color fused image for that view from the server. This view request process is achieved through the integration of wavelet-based JPEG 2000 image compression and decompression techniques [16] which enable high resolution view requests even over low bandwidth links. We have demonstrated this client capability on a wireless palmtop computer. The image mining interface enables the training and utilization of an instance of Fuzzy ARTMAP on a remote,
Figure 6 : Upper left shows an SGI O2 computer which supports 3D color fused site fly-throughs. Polarized display screens and matching polarized sunglasses enable stereo viewing. Lower left shows a Windows NT laptop running our web-based client-server interface for remote, collaborative site visualization and search. Right shows a blow-up of the client-server image mining interface. The analyst can position a zoom box (magnification window) and then select within it example and counterexample pixels of the target of interest (In this example, we are training a search agent to find red cars.) The multidimensional pixel vectors behind each of these selections is sent to the server, where the data becomes a training set for Fuzzy ARTMAP to learn the designated target or surface signature. The computations involved in searching the site for more targets are carried out on the server, and the target locations are then sent back to the client interface as image overlay.
and often less powerful, platform such as a laptop or palmtop PC. The mining tool is a client-server system in which the computations required to learn signatures and search imagery for targets is carried out on the server machine, and the client needs only to support the interactive interface which launches directly from a Netscape web browser. Another advantage of the clientserver organization of our system is that trained networks or search agents or search results can be stored on the server and made available to any analyst with access to the web site. This enables collaborative exploitation and rapid dissemination of results The client side interactive interface enables the iterative selection of a training set, including both examples and counterexamples of the target or surface type of interest. This interface evolved from previous work on interactive image mining tools for multi-dimensional image analysis [17]. As seen in Figure 6, the image mining interface includes an upper scrollable window which gives an overview of the color fused site imagery. Beneath and to the left of this overview window is a smaller magnification window or “zoom box”. The analyst positions the zoom box in the overview window image and can adjust the magnificiation
factor. The zoom box can then be used directly to inspect image pixels and select a training set by brushing pixels with either the left (examples) or the right (counterexamples) mouse button depressed. It should be noted that pixel selection chooses the entire vector of registered image information behind each pixel, and not just the color pixel itself. Searches can be executed across just the zoom box portion of the imagery for rapid verification that a search agent has been properly trained, or a search across the entire site imagery can be requested. In either case, the server system executes the search computations and only the results are sent to the client for display as an overlayed detection map. See our second paper at this conference for an analysis of our mining results on a variety of different datasets [18].
6 Summary In summary, we have developed a multi-sensor 3D image fusion system which brings together complementary sensor information into a single interactive display. Color 3D fused signatures can be explored on by interactive site fly-throughs which can be viewed in stereo on sufficiently powerful computer graphics enabled machines. Multi-sensor fused signatures provide rich spectral information by which targets and surface types
can be recognized and found across site data. This search process is facilitated by our development of web-based client–server interfaces for interactive target designation, learning, and search for signatures of interest. Our webbased approach facilitates both remote and collaborative site data exploitation. Finally, our approach is general and can be extended to address different as well as larger databases. In principle, any set of sensors which generate imagery can provide inputs to our fusion architecture, as long as the imagery can be geo-spatially registered. We believe that our approach of integrating 3D site models, color image fusion algorithms for enhanced site data visualization, and interactively trained search agents is essential to meet the growing challenges of increasing quantities and varieties of multi-sensor surface surveillance imagery.
References [1] Gouras, P. (1991). Color vision. Chapter 31 in Principles of Neural Science (E.R. Kandel, J.H. Schwartz & T.M. Jessell, editors), pp. 467-480, New York: Elsevier Science Publishers. [2] Schiller, P., & Logothetis, N.K. (1990). The coloropponent and broad-band channels of the primate visual system. Trends in Neuroscience, TINS-13, 392-398. [3] Kaiser, P.K., & Boynton, R.M. (1996). Human Color Vision (2nd edition), Washington, D.C.: Optical Society of America. [4] Carpenter, G. A. Carpenter & Grossberg, S. Markuzon, J. H., Reynolds, J. H. & Rosen, D. B., Fuzzy ARTMAP : A neural architecture for incremental supervised learning of analog multidimensional maps. IEEE Transactions on Neural Networks, 3 (5), 698-713, 1688-1692 [5] Carpenter, G.A., Grossberg, S., & Rosen, D. B. (1991). Fuzzy ART: Fast stable learning and categorization of analog patterns by an adaptive resonance system. Neural Networks, 4, 759-771. [6] Newman, E.A. & Hartline, P.H. (1981). Integration of visual and infrared information in bimodal neurons of the rattlesnake optic tectum. Science, 213, 789-791. [7] Newman, E.A. & Hartline, P.H. (1982). The infrared vision of snakes. Scientific American, 246 (March), 116-127. [8] Aguilar, M., Fay D.A., Ireland D.B., Racamato J.P., Ross W.D., and Waxman A.M., “Field Evaluations of Dual-Band Fusion for Color Night Vision,” Proc. of SPIE Conf. On Enhanced and Synthetic Vision 1999, SPIE3691, pp. 168-175, 1999. [9] Waxman, A.M., Aguilar, M., Fay, D.A., Ireland, D.B., Racamato, J.P., Ross, W.D., Carrick, J.E., Gove, A.N., Seibert, M.C., Savoye, E.D., Reich, R.K., Burke, B.E., McGonagle, W.H., and Craig, D.M., “Solid state color night vision: Fusion of low-light visible and thermal IR imagery,” Lincoln Laboratory Journal, 11 (1), pp. 4160, 1998. [10] Waxman, A.M., Gove, A.N., Fay, D.A., Racamato, J.P., Carrick, J.E., Seibert M.C., and Savoye, E.D., “Color Night Vision: Opponent Processing in the Fusion
of Visible and IR Imagery,” Neural Networks, 10 (1), pp. 1-6, 1997. [11] Toet, A. (1990). Hierarchical image fusion. Machine Vision and Applications, 3, 1-11. [12] Toet, A. (1992). Multiscale contrast enhancement with applications to image fusion. Optical Engineering, 31, 1026-1031. [13] Toet, A., van Ruyven, L.J., & Valeton, J.M. (1989). Merging thermal and visual images by a contrast pyramid. Optical Engineering, 28, 789-792. [14] Toet, A., IJspeert, J.K., Waxman, A.M., & Aguilar, M. (1997). Fusion of visible and thermal imagery improves situational awareness. Proceeds. of the SPIE Conf. on Enhanced and Synthetic Vision 1997, SPIE-3088, 177-188. [15] Steele, P.M., & Perconti, P. (1997). Part task investigation of multispectral image fusion using gray scale and synthetic color night vision sensor imagery for helicopter pilotage. Targets and Backgrounds: Characterization and Representation III, SPIE-3062, 88100. [16] Charrier, M., Santa Cruz, D., Larsson, M., "JPEG2000, the Next Millenium Compression Standard for Still Images", In Proc. of the IEEE ICMCS´99, 1(2):pp. 131-132. [17] Delanoy, R.L., “Toolkit for Image Mining: UserTrainable Search Tools,” Lincoln Laboratory Journal, 8 (2), pp. 145-160, 1995. [18] Streilein, W., Waxman, A., Ross, Liu, F., Braun, M., Fay D., Harmon, P., and Read C.H., (2000), Fused Multi-Sensor Image Mining for Feature Foundation Data, To appear in Proceedings of Third International Conference on Information Fusion, Paris, July 2000.