Article
Multi-Sensor As-Built Models of Complex Industrial Architectures Jean-François Hullo *, Guillaume Thibault, Christian Boucheny, Fabien Dory and Arnaud Mas Received: 30 June 2015; Accepted: 23 November 2015; Published: 4 December 2015 Academic Editors: Diego Gonzalez-Aguilera, Norman Kerle and Prasad S. Thenkabail Electricité De France Lab, 1 Avenue du Général de Gaulle, 92140 Clamart, France;
[email protected] (G.T.);
[email protected] (C.B.);
[email protected] (F.D.);
[email protected] (A.M.) * Correspondence:
[email protected] or
[email protected]; Tel.: +33-147-653-731
Abstract: In the context of increased maintenance operations and generational renewal work, a nuclear owner and operator, like Electricité de France (EDF), is invested in the scaling-up of tools and methods of “as-built virtual reality” for whole buildings and large audiences. In this paper, we first present the state of the art of scanning tools and methods used to represent a very complex architecture. Then, we propose a methodology and assess it in a large experiment carried out on the most complex building of a 1300-megawatt power plant, an 11-floor reactor building. We also present several developments that made possible the acquisition, processing and georeferencing of multiple data sources (1000+ 3D laser scans and RGB panoramic, total-station surveying, 2D floor plans and the 3D reconstruction of CAD as-built models). In addition, we introduce new concepts for user interaction with complex architecture, elaborated during the development of an application that allows a painless exploration of the whole dataset by professionals, unfamiliar with such data types. Finally, we discuss the main feedback items from this large experiment, the remaining issues for the generalization of such large-scale surveys and the future technical and scientific challenges in the field of industrial “virtual reality”. Keywords: 3D as-built reconstruction; multi-sensor dataset production; terrestrial laser scanner; panoramic images; 2D and 3D CAD models; virtual mock-up; complex scene visualization
1. Introduction 1.1. Industrial Context In order to fulfill the need for as-built datasets to help workers in complex buildings in their daily jobs, large and multi-sensor surveys now have to be considered at the whole building size. Unfortunately, many current tools (including sensors, processing programs and visualization applications) have not been designed for such large surveys of complex indoor facilities. Until today, the major uses with as-built data in the industry are related to the description of the actual shape of only a part of the facility, with its obstacles and free spaces with centimeter accuracy, to help maintenance planning, handling, storage, replacement or changing important components in that specific part of the plant; see Figure 1. The next step in the field of 3D surveying of facilities consists both of scaling up the current state of the art, without compromising data quality, and in dedicating as-built datasets to new users, who are not experts in CAD or terrestrial laser scanner (TLS) data.
Remote Sens. 2015, 7, 16339–16362; doi:10.3390/rs71215827
www.mdpi.com/journal/remotesensing
shape of only a part of the facility, with its obstacles and free spaces with centimeter accuracy, to help maintenance planning, handling, storage, replacement or changing important components in that specific part of the plant; see Figure 1. The next step in the field of 3D surveying of facilities consists both of scaling up the current state of the art, without compromising data quality, and in dedicating as-built Remote Sens. 2015, 7, 16339–16362 datasets to new users, who are not experts in CAD or terrestrial laser scanner (TLS) data.
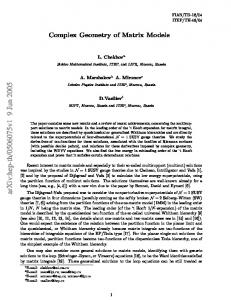
Figure 1. Review of three breakthrough projects (1993–2014) of as-built reconstruction from laser Figure 1. Review of three breakthrough projects (1993–2014) of as-built reconstruction scanning data of industrial facilities at Electricité de France (EDF) [1]: (a) first water tank (1993); from laserturbine scanning data of at Electricité de France (EDF) [1]: (a) first (b) first hall (2009); (c) industrial first reactorfacilities building (2014). water tank (1993); (b) first turbine hall (2009); (c) first reactor building (2014).
1.2. Contributions
1.2. Contributions
The contributions of this paper, which is an enhanced and detailed version of [1], are the following:
The contributions of this paper, which is an enhanced and detailed version of [1], are the following: ‚
‚ ‚
‚ ‚
‚
The state of the art of tools and methods for the acquisition, processing and georeferencing of as-built datasets dedicated to the specific conditions of complex indoor facilities, Subsection 2.1 and Subsection 2.2; The proposition of a global method for multi-sensor acquisition and processing to represent complex architecture, Subsection 2.3 and Figure 2; Settings, processes and feedback from a large-scale multi-sensor scanning survey experiment on a whole 1300-megawatt nuclear reactor building (1000+ stations of both TLS and panoramic images) with a highlight of the role of the human beings in the process, Section 3; A new interactive tool for pose estimation of panoramic images, Section 4; Recommendations and examples for developing dedicated applications for virtual tours of complex architectures using multiple data types in order to increase the value of the dataset and answer users’ requirements, Section 5; An overview of the remaining bottlenecks and challenges in view of the generalization of large, dense, multi-sensor scanning surveys, Section 6.
16340
•
Recommendations and examples for developing dedicated applications for virtual tours of complex architectures using multiple data types in order to increase the value of the dataset and answer users’ requirements, Section 5; • An overview of the remaining bottlenecks and challenges in view of the generalization of large, Remote Sens. 2015, 7, 16339–16362 dense, multi-sensor scanning surveys, Section 6.
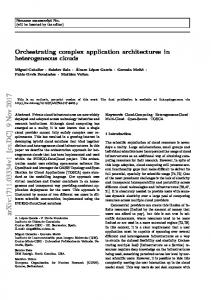
Figure 2. 2. Global Global framework framework ofofas-built production in the experiment. White boxesboxes are theare Figure as-builtdata data production in the experiment. White initial data sources; grey boxes are intermediate data versions; and black boxes are the datasets the initial data sources; grey boxes are intermediate data versions; and black boxes are the that composed the virtual replica of a complex building. Orange outlines represent stronger control datasets thatincomposed the virtual replica of a complex building. Orange outlines represent procedures the data production process. stronger control procedures in the data production process.
2. State of the Art in 3D Surveying for the Industry
2. State of the Art in 3D Surveying for the Industry 2.1. Scanning Industrial Interiors, a 20-Year-Old Challenge
2.1. Scanning Industrial Interiors, a 20-Year-Old As shown in Figure 3, power facilities are aChallenge specific subset of industrial environments, in their shapes (congested, with a huge number of objects, whose manufactured geometries correspond to
As shown Figure 3, power facilitiesboxes, are a specific subset of industrial in reflective their shapes a set of 3Dinprimitives, like cylinders, etc.), their surfaces (objects environments, sometimes very or with very dark albedos) and accessibility (on-site restricted access time, difficult temperature (congested, with a huge number of objects, whose manufactured geometries correspond to a setand of 3D vibration conditions). The geometric complexity of these scenes led to the development of dedicated acquisition and processing tools, such as terrestrial laser scanning in the 1990s [2], used very often since then, see Figure 1a. These methods have been used until today to help maintenance workers, by providing a description of the geometry of key areas of the facilities. Unfortunately, and because of the specific nature of industrial environments, many developments intended for the 3D laser scanning of non-industrial objects have not solved all of the issues arising in the large-scale dense scanning survey of whole industrial scenes with multiple floor heights. These main issues are the speed of surveying (since the plant is only accessible a couple of weeks in the year), the accuracy of the raw points for a large spectrum of albedos (with both mirror-like and dark surfaces in the same scene), the accuracy of registration and referencing (the 2.58σ global geometric tolerance is ˘2 cm) and, also, the productivity of 3D reconstruction (up to 100.000 objects for one single building).
16341
primitives, like cylinders, boxes, etc.), their surfaces (objects sometimes very reflective or with very dark albedos) and accessibility (on-site restricted access time, difficult temperature and vibration conditions). The geometric complexity of these scenes led to the development of dedicated acquisition and processing tools, such as terrestrial laser scanning in the 1990s [2], used very often since then, see Figure 1a. These methods been used until today to help maintenance workers, by providing a description of the Remote Sens.have 2015, 7, 16339–16362 geometry of key areas of the facilities.
Figure 3. Specific issues of a power facility: (a) rooms often very congested; (b) objects(b) canobjects be very Figure 3. Specific issues of a power facility: (a) are rooms are often very congested, dark and (c) stainless objects can be clean and then very reflective; (d) often coexisting in one place.
can be very dark and (c) stainless objects can be clean and then very reflective, (d) often coexisting in one place.
In an industrial context, many users are not experienced users of laser scanner or CAD data. Furthermore, geometry alone isofnot to meetofall maintenance needs and to represent all of Unfortunately, and because thesufficient specific nature industrial environments, many developments the complexity of the architecture and the details of a power plant. These observations lead to intended for the 3D laser scanning of non-industrial objects have not solved all of the issues arisingthe in following requirements for the tools and methods used in these new standards in the production and the large-scale dense scanning survey of whole industrial scenes with multiple floor heights. These main use of as-built datasets for the maintenance of facilities:
issues are the speed of surveying (since the plant is only accessible a couple of weeks in the year), the
(1)accuracy Multi-sensor datasets both the and appearance of a facility; of the raw points that for adescribe large spectrum ofgeometry albedos (with both mirror-like and dark surfaces in (2)the same Fast and accurate sensors,ofresponsive harsh albedos or very reflective scene), the accuracy registrationtoand referencing (the 2.58 globalsurfaces; geometric tolerance is (3)±2 cm) Automated pipelines for conversions and formatting; and, also, the productivity of 3D reconstruction (up to 100.000 objects for one single building). (4) InLarge-scale efficient tools for registration andexperienced processing; users of laser scanner or CAD data. an industrial context, many users are not (5)Furthermore, User-friendly diagnostic achieve high quality requirements on large complexall datasets; geometry alone tools is nottosufficient to meet all maintenance needs and and to represent of the (6)complexity Dedicated solutions for the intuitive exploration and use of multi-sensor datasets. of the architecture and the details of a power plant. These observations lead to the following
requirements for the tools and methods used in these new standards in the production and use of as-built datasets for the maintenance of facilities:
2.2. Requirement Engineering for As-Built Datasets of Complex Architectures
In order to represent a complex facility, the requirement engineering of several jobs, through (1) Multi-sensor datasetstothat describethe both the geometry andthe appearance of a facility;has led to the meetings and discussions, estimate optimal value of dataset produced, (2) Fast and accurate sensors, responsive to harsh albedos or very reflective surfaces; conclusion that the following data types must be produced together; see Figure 4: (1)
(2)
(3) (4)
(3) Automated pipelines for conversions and formatting; Panoramic images, in order to be able to read each equipment tag that might be visible up to (4) Large-scale efficient tools for registration and processing; 5 m from the main pathways in the facility, as well as to understand the overall architecture of (5) User-friendly diagnostic tools to achieve high quality requirements on large and complex the building; datasets; Georeferenced terrestrial laser scans, in order to deliver local sub-centimeter geometric accuracy (6) solutions for theasintuitive and use of multi-sensor on Dedicated distance measurements, well as exploration global 3D locations with less than 2datasets. cm of deviation from the ground truth (2.58σ tolerance); 2D floor maps, with all elements relative to the structure of the building (walls, floors, ladders, stairs, etc.), as well as landmarks to help pedestrians navigate the plant; 3D, as-built CAD models with categories, to capture empty areas or open walking spaces with less than 5 cm of error (2.58σ tolerance), as well as the shape of the main equipment of the facility.
16342
the ground truth (2.58 tolerance); (3) 2D floor maps, with all elements relative to the structure of the building (walls, floors, ladders, stairs, etc.), as well as landmarks to help pedestrians navigate the plant; (4) 3D, as-built CAD models with categories, to capture empty areas or open walking spaces with less2015, than 5 cm of error (2.58 tolerance), as well as the shape of the main equipment of Remote Sens. 7, 16339–16362 the facility.
Figure 4. 4. Four types of data are required to represent a power plant facility with a high Figure Four types of data are required to represent a power plant facility with degree a highof confidence (geometry and appearance): panoramic images, laser scans, floor maps and 3D CAD model. degree of confidence (geometry and appearance): panoramic images, laser scans, floor maps
and 3D CAD model. In order to match these requirements, one must define relevant specification criteria for each type data,toasmatch presented in Table 1. Inoforder these requirements, one must define relevant specification criteria for each type of the tools and 1. methods that might meet all of these criteria were selected using the data,Then, as presented in Table experience survey thatthat should sample datasets prove their expertise either Then, theoftools andteams methods mightsubmit meet all of these criteriatowere selected using the(from experience previous or should small-scale experiments in similar conditions). The (from initialeither estimates of costs and of survey surveys teams that submit sample datasets to prove their expertise previous surveys delays were extrapolated to the building scale thanks to a deep analysis of these previous acquisitions. or small-scale experiments in similar conditions). The initial estimates of costs and delays were Finally, to ensure the consistency of results for initial user needs, the dataset was fully checked, extrapolated to the building scale thanks to a deep analysis of these previous acquisitions. using a Level 2 control procedure and then reworked until quality standards were achieved. Finally, to ensure thethe consistency ofsuch results for initial user needs, the dataset was fully checked, using userFinally, feedback showed validity of approaches.
a Level 2 control procedure and then reworked until quality standards were achieved. Finally, user Tablethe 1. validity Criteria of multi-sensor survey of a building with complex architecture. feedback showed ofasuch approaches. Type of Data
Criteria
Panoramic images
completeness, location of stations, field of view, resolution and noise level of digital images, white balance and high dynamic range (HDR), naming, approximate poses, vertical estimation and mapping completeness, location of stations, block structure of sub-networks, targets for registration, reference targets for georeferencing, field of view, resolution, signal and total station traverse survey completeness, geometry, naming and formatting completeness, categories of objects, type of shapes, geometric accuracies by category, names and structure
Georeferenced and cleaned laser scans 2D floor maps 3D as-built CAD model
2.3. State of the Art of Large-Scale Dense Scanning Surveys Recent breakthroughs offer the prospect of large-scale and multi-sensor scanning surveys that comply with the previously defined technical requirements and tolerances, from acquisition and processing to data integration in dedicated software, developed specifically for maintenance work in a power plant. As will be shown in this section, new developments in data acquisition in the past five years have mainly improved the speed rate, with almost no gain in accuracy. The real benefit for scaling up dense scanning surveys consists of the improvement in data storage, visualization and processing.
16343
Remote Sens. 2015, 7, 16339–16362
2.3.1. Panorama Acquisition Regarding panoramic image acquisition, current 360˝ video cameras allow fast acquisition of equirectangular images; the state-of-the-art highest resolution panoramic systems use 44 sensors to produce videos with a resolution of 9000 ˆ 2400 pixels at a rate of 30 frames per second [3]. However, static tripod-mounted motorized heads with full frame digital single lens cameras (DLSR) can generate higher resolutions (gigapixels) panoramas, for example half a billion pixels in five minutes [4], with a high automation rate in stitching. This resolution allows reading labels up to 5 m, and the high dynamic range (HDR) rendering can deal with high contrast and poor lightning conditions. 2.3.2. 3D Point Cloud Acquisition and Registration Regarding 3D georeferenced point cloud acquisition, some noticeable improvements have come from robotic and computer vision research programs on fast 3D scanning indoors, such as range sensors [5], backpack scanning systems [6], handheld [7] or mounted on mobile platforms in various shapes and sizes [8,9]. However, these systems, either for local precision [5–7] or global georeferencing errors [9], deal mostly with decimeter accuracy. Moreover, many indoor localization and mapping systems require planar objects and/or straight corridors to reduce drift using elaborate algorithms, such as “iterate closest point + inertial measurement unit + planar” proposed in [6]. For labyrinthine and crowded indoors, a fusion of several techniques may be available in a few years, including indoor localization systems based on inertial sensors (the state of the art may be found in the EVAAL indoor positioning competition—Evaluating Ambient Assisted Living Systems Through Competitive Benchmarking—won in 2015 by [10]), graph-SLAM (simultaneous localization and mapping) sensor positioning [11], efficient loop closure [12] and robust detection of features for geo-referencing [13]. Currently, phase-based terrestrial laser scanners are better sensors for small distances, and acquisition rate and can for instance capture 50 million points of mid-range measurements in approximately five minutes (50% of current cost) the productivity of 3D as-built CAD (or BIM) models from very large point clouds (hundreds of billions)? Which procedures and resources should be employed to update a large multi-sensor dataset and detect errors or inconsistencies between two epochs?
Acknowledgments: The authors would like to thank the reviewers and copy editors, whose helpful comments led to a better paper overall. The authors also want to thank all the involved teams in this project, with a special mention to survey teams (photographers and surveyors), CAD operators and software developers. Author Contributions: Jean-François Hullo and Guillaume Thibault conceived and designed the tools and the methods of data acquisition and processing. Christian Boucheny and Arnaud Mas conceived and designed the end-user application. Fabien Dory developed tools for 3D path computations and panoramic pose estimation. Conflicts of Interest: The authors declare no conflict of interest.
References 1. 2. 3.
4. 5. 6.
7. 8. 9. 10.
11. 12.
13.
Hullo, J.-F.; Thibault, G.; Boucheny, C. Advances in multi-sensor scanning and visualization of complex plants: The utmost case of a reactor building. ISPRS Arch. Photogramm. 2015, 1, 163–169. [CrossRef] Pot, J.; Thibault, G.; Levesque, P. Techniques for CAD reconstruction of “as-built” environments and application to preparing for dismantling of plants. Nucl. Eng. Des. 1997, 178, 135–143. [CrossRef] Depraz, F.; Popovic, V.; Ott, B.; Wellig, P.; Leblebici, Y. Real-time object detection and tracking in omni-directional surveillance using GPU. In Proceedings of the 2015 SPIE Target and Background Signatures, Toulouse, France, 21 September 2015. Kopf, J.; Uyttendaele, M.; Deussen, O.; Cohen, M. Capturing and viewing gigapixel images. ACM Trans. Gr. 2007, 26, 93. [CrossRef] Khoshelham, K.; Elberink, S.O. Accuracy and resolution of kinect depth data for indoor mapping applications. Sensors 2012, 12, 1437–1454. [CrossRef] [PubMed] Chen, G.; Kua, J.; Shum, S.; Naikal, N.; Carlberg, M.; Zakhor, A. Indoor localization algorithms for a human-operated backpack system. In Proceedings of the 5th International Symposium 3D Data Conference on Visualization, and Transmission, Paris, France, 17–20 May 2010. Bosse, M.; Zlot, R.; Flick, P. Zebedee: Design of a spring-mounted 3-d range sensor with application to mobile mapping. IEEE Trans. Robot. 2012, 28, 1104–1119. [CrossRef] Adán, A.; Quintana, B.; Vázquez, A.S.; Olivares, A.; Parra, E.; Prieto, S. Towards the automatic scanning of indoors with robots. Sensors 2015, 15, 11551–11574. [CrossRef] [PubMed] Zlot, R.; Bosse, M. Efficient large-scale three-dimensional mobile mapping for underground mines. J. Field Robot. 2014, 31, 758–779. [CrossRef] Li, Y.; Zhang, P.; Lan, H.; Yuan, Z.; Niu, X.; El-Sheimy, N. Real-time indoor navigation using smartphones. In Proceedings of IPIN 2015 Conference on Evaal Indoor Navigation Competition, Banff, AB, Canada, 13–16 October 2015. De la Puente, P.; Rodriguez-Losada, D. Feature based graph-SLAM in structured environments. Auton. Robot. 2014, 37, 243–260. [CrossRef] Labbe, M.; Michaud, F. Online global loop closure detection for large-scale multi-session graph-based slam. In Proceedings of THE 2014 IEEE/RSJ International Conference on Intelligent Robots and Systems, Chicago, IL, USA, 14–18 September 2014. Ji, S.; Shi, Y.; Shan, J.; Shao, X.; Shi, Z.; Yuan, X.; Ynag, P.; Wu, W.; Tang, H.; Shibasaki, R. Particle filtering methods for georeferencing panoramic image sequence in complex urban scenes. ISPRS J. Photogramm. 2015, 105, 1–12. [CrossRef]
16360
Remote Sens. 2015, 7, 16339–16362
14. 15.
16.
17.
18. 19. 20. 21. 22. 23. 24. 25.
26.
27. 28. 29.
30. 31. 32. 33. 34.
35.
Barras, V.; Delley, N.; Chapotte, G. Analyses aux limites des scanners laser terrestres. XYZ Rev. Assoc. Fr. Topogr. 2013, 137, 19–26. Voegtle, T.; Wakaluk, S. Effects on the measurements of the terrestrial laser scanner HDS 6000 (Leica) caused by different object materials. In Proceedings of the 2009 ISPRS Work on Laser Scanning, Paris, France, 1–2 September 2009. Tang, P.; Huber, D.; Akinci, B. A comparative analysis of depth-discontinuity and mixed-pixel detection algorithms. In Proceedings of the IEEE Sixth International Conference on 3-D Digital Imaging and Modeling, Montreal, QC, Canada, 21–23 August 2007. Hullo, J.-F.; Thibault, G.; Grussenmeyer, P.; Landes, T.; Bennequin, D. Probabilistic feature matching applied to primitive based registration of TLS data. In Proceedings of the XXII ISPRS Congress on Annals of the Photogrammetry, Remote Sensing and Spatial Information Sciences, Melbourne, Australia, 25 August–1 September 2012. Komorowski, M. A History of Storage Cost. Available online: http://www.mkomo.com/cost-per -gigabyte-update (accessed 30 October 2015). Wikipedia. List of Device Bit Rates. Available online: https://en.wikipedia.org/wiki/List_of_device_bit _rates (accessed 4 October 2015). Elseberg, J.; Borrmann, D.; Nüchter, A. One billion points in the cloud—An octree for efficient processing of 3D laser scans. ISPRS J. Photogramm. 2013, 76, 76–88. [CrossRef] Scheiblauer, C. Interactions with Gigantic Point Clouds. Ph.D. Thesis, Institute of Computer Graphics and Algorithms, Vienna, Austria, 2014. Schütz, M. Potree, A Free Open-Source WebGL Based Point Cloud Renderer for Large Point Clouds. SCANOPY Project. Available online: https://github.com/potree/potree (accessed 30 October 2015). Boucheny, C. Interactive Scientific Visualization of Large Datasets: Towards a Perceptive-Based Approach. Ph.D. Thesis, Université Joseph Fourier, Grenoble, France, 2009. Azhar, S. Building information modeling (BIM): Trends, benefits, risks, and challenges for the AEC industry. Leadersh. Manag. Eng. 2011, 11, 241–252. [CrossRef] Golparvar-Fard, M.; Peña-Mora, F.; Savarese, S. Automated progress monitoring using unordered daily construction photographs and IFC-based building information models. J. Comput. Civil. Eng. 2012, 29, 04014025. [CrossRef] Jung, I.; Kim, W. Analysis of the possibility of required resources estimation for nuclear power plant decommissioning applying BIM. In Proceedings of the KNS 2014 Spring Meeting, Jeju, Korea, 28–30 May 2014. Volk, R.; Stengel, J.; Schultmann, F. Building Information Modeling (BIM) for existing buildings—Literature review and future needs. Automat. Constr. 2014, 38, 109–127. [CrossRef] Trickett, K.G.; Chaney, J.C. PDMS: Plant Layout and Piping Design; Gulf Publishing Company: Houston, TX, USA, 1982. Tang, P.; Huber, D.; Akinci, B.; Lipman, R.; Lytle, A. Automatic reconstruction of as-built building information models from laser-scanned point clouds: A review of related techniques. Automat. Constr. 2010, 19, 829–843. [CrossRef] Son, H.; Kim, C.; Kim, C. 3D reconstruction of as-built industrial instrumentation models from laser-scan data and a 3D CAD database based on prior knowledge. Automat. Constr. 2015, 49, 193–200. [CrossRef] Kang, Z.; Li, Z. Primitive fitting based on the efficient multiBaySAC algorithm. PLoS ONE 2015, 10, e0117341. [CrossRef] [PubMed] Whyte, J.; Bouchlaghem, N.; Thorpe, A.; McCaffer, R. From CAD to virtual reality: Modelling approaches, data exchange and interactive 3D building design tools. Automat. Constr. 2000, 10, 43–55. [CrossRef] Girardeau-Montaut, D.; Roux, M.; Marc, R.; Thibault, G. Change detection on points cloud data acquired with a ground laser scanner. ISPRS Arch. Photogramm. 2005, 36, 30–35. Bey, A.; Chaine, R.; Marc, R.; Thibault, G.; Akkouche, S. Reconstruction of consistent 3D CAD models from point cloud data using a priori CAD models. In Proceedings of the 2011 ISPRS Workshop on Laser Scanning, Calgary, AB, Canada, 29–31 August 2011. Hullo, J.-F.; Thibault, G. Scaling up close-range surveys: A challenge for the generalization of as-built data in industrial applications. ISPRS Arch. Photogramm. 2014, 1, 293–299. [CrossRef]
16361
Remote Sens. 2015, 7, 16339–16362
36.
37. 38. 39.
40.
41.
Wicki, F. Robust estimator for the adjustment of geodetic networks. In Proceedings of the First International Symposium on Robust Statistics and Fuzzy Techniques in Geodesy and GIS, Zurich, Switzerland, 12–16 March 2001. Whiting, E. Geometric, Topological & Semantic Analysis of Multi-Building Floor Plan Data. Master’s Thesis, Massachusetts Institute of Technology, Deptment of Architecture, Cambridge, MA, USA, 2006. Vatti, B.R. A generic solution to polygon clipping. Commun. ACM 1992, 35, 56–63. [CrossRef] Koehl, M.; Scheider, A.; Fritsch, E.; Fritsch, F.; Rachebi, A.; Guillemin, S. Documentation of historical building via virtual tour: the complex building of baths in Strasbourg. In Proceedings of the XXIV International CIPA Symposium on Archives of the Photogrammetry, Remote Sensing and Spatial Information Sciences, Strasbourg, France, 2–6 September 2013. Thibault, G.; Pasqualotto, A.; Vidal, M.; Droulez, J.; Berthoz, A. How does horizontal and vertical navigation influence spatial memory of multifloored environments? Atten. Percept. Psychophys. 2013, 75, 10–15. [CrossRef] [PubMed] Dollé, L.; Droulez, J.; Bennequin, D.; Berthoz, A.; Thibault, G. How the learning path and the very structure of a multifloored environment influence human spatial memory? Adv. Cogniti. Psychol. 2015, in press. © 2015 by the authors; licensee MDPI, Basel, Switzerland. This article is an open access article distributed under the terms and conditions of the Creative Commons by Attribution (CC-BY) license (http://creativecommons.org/licenses/by/4.0/).
16362