International Conference on Communication and Signal Processing, April 2-4, 2015, India
Multidimensional Approaches for Noise Cancellation of ECG signal Akash Kumar Bhoi, Karma Sonam Sherpa, Devakishore Phurailatpam, Jitendra Singh Tamang, Pankaj Kumar Giri
Abstract: In many situations, the Electrocardiogram (ECG) is recorded during ambulatory or strenuous conditions such that the signal is corrupted by different types of noise, sometimes originating from another physiological process of the body. Hence, noise removal is an important aspect of signal processing. Here five different filters i.e. median, Low Pass Butter worth, FIR, Weighted Moving Average and Stationary Wavelet Transform (SWT) with their filtering effect on noisy ECG are presented. Comparative analyses among these filtering techniques are described and statically results are evaluated.
The wavelet coefficients represent a measure of similarity in the frequency content between a signal and a chosen wavelet function [1]. These coefficients are computed as a convolution of the signal and the scaled wavelet function, which can be interpreted as a dilated band-pass filter because of its band-pass like spectrum [2]. Sander et al. designed a 50/60Hz notch filter to eliminate baseline drift from high resolution ECG Signal [3]. Markovsky et al. used band pass, kalman adaptive filter for removal of resuscitation artifacts from human ECG signal [4]. For wavelet transform, daubechies wavelets were used because the scaling functions of this wavelet filter are similar to the shape of the ECG. From the decomposition of the ECG signal it was seen that the low frequency component cause the baseline shift, theses component were deducted to get a signal without baseline drift. Also the high frequency components of the signal were removed for getting denoised signal [22]. Below chapters sequentially elaborate the filtering performances of five different filters.
Index Terms- Electrocardiography, Active noise reduction, Filters, Noise cancellation.
I.
INTRODUCTION
A physician can detect a heart problem from this information and can suggest timely measures. But during the acquisition of ECG signal, it may get corrupted by different types of noises [21] which make it difficult for the physician to give his diagnosis. Power Line Interference (PLI) is one such kind of noise which superimposes on the vital information. The frequency range of ECG signal is 0.05Hz to 150Hz, and the frequency of the PLI noise is 50/60 Hz which lies within the frequency spectrum of the ECG signal, so for the meaningful and accurate detection, steps have to be taken to filter out or discard all these noise sources. Hamilton PS in his article compared adaptive and non adaptive filters for reduction of power line interference in the ECG [5]. Iders YZ, Saki MC, Gcer HA have developed a method for line interference reduction to be used in signal averaged electrocardiography [6]. Cramer E, McManus CD, Neubert D has introduced a global filtering approach. In this method two types of the digital filters are used where, one is using lest square method and other is using special summation method [7]. Different scientists have tried for removing the power line interference and base line wonder specifically from the ECG signal [8-17]. Zschorlich VR and Zschorlich VR, have also designed digital filters to cope with EMG signals [18-19]. Webster has explained the instrumentation requirements for the ECG [20].
II. METHODOLOGY
ECG signal
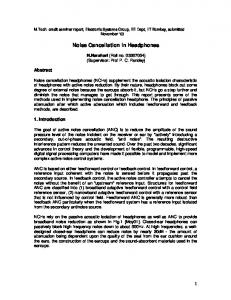
Filtering Efficiency Analysis Fig.1. Block diagram of proposed methodology
“Fig. 1” illustrates the workflow of proposed methodology. Filtering operations are performed for the selected initial waveform (i.e. 4 sec data) “fig.2” of the full length noisy ECG signal for better visualization of filtering results “fig.3-7”. The statistical analysis results are shown in “fig.8-12”. Devakishore Phurailatpam is with the Electrical & Electronics Engineering Department, National Institute of Technology, Manipur, India (email:
[email protected]). Jitendra Singh Tamang is with Electronics & Communication Department, SMIT, India (email:
[email protected]). Pankaj Kumar Giri is with and Applied Electronics & Instrumentation Engineering Department, SMIT, India (email:
[email protected]).
Akash Kumar Bhoi is with the Applied Electronics & Instrumentation Engineering Department, Sikkim Manipal Institute of Technology (SMIT), India (email:
[email protected]). Karma Sonam Sherpa is with the Electrical & Electronics Engineering Department, Sikkim Manipal Institute of Technology (SMIT), India (email:
[email protected]).
ISBN 978-1-4799-8080-2
Noise Cancellation
Adhiparasakthi Engineering College, Melmaruvathur 060
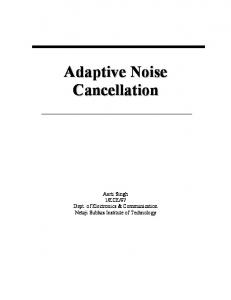
where, n represents the filter order, Omega ω is equal to 2πƒ , Epsilon ε is the maximum pass band gain, (Amax). If Amax is defined at a frequency equal to the cut-off -3dB corner point (ƒc), ε will then be equal to one and therefore ε2 will also be one. However, if you now wish to define Amax at a different voltage gain value, for example 1dB, or 1.1220 (1dB = 20logAmax) then the new value of epsilon, ε is found by (2): = Fig.2. Input Noisy ECG signal
(2)
where, H0 = the Maximum Pass band Gain, Amax. H1 = the Minimum Pass band Gain.
A. Median Filter
Transpose the equation to give:
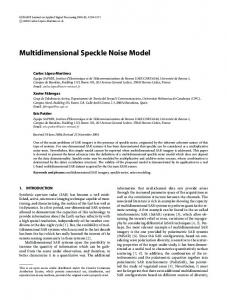
The median filter is a nonlinear digital filtering technique, often used to remove noise. Such noise reduction is a typical preprocessing step to improve the results of later processing. The main idea of the median filter is to run through the signal entry by entry, replacing each entry with the median of neighboring entries. The pattern of neighbors is called the "window", which slides, entry by entry, over the entire signal. The function considers the signal to be 0 beyond the endpoints. The output has the same length as x. For odd n, y (k) is the median of ( − ( − 1)/2: + ( − 1)/2). For even n, y(k) is the median of ( − /2), ( − ( /2) + 1), . . . , ( + ( /2) − 1).
= 1.1220 =
(1 +
)
(3)
gives ε = 0.5088 The Frequency Response (3) of a filter can be defined mathematically by its Transfer Function with the standard Voltage Transfer Function H(jω) (4) written as: (
)=
(
)
(
)
(4)
where: Vout = the output signal voltage. Vin = the input signal voltage. ω = the radian frequency (2πƒ)
In this case, medfilt1 sorts the numbers, then takes the average of the n/2 and (n/2) +1 elements with window=15.
Fig.4. Filtered ECG signal (using LP Butterworth filter with order 10)
C. Finite Impulse Response (FIR) Filter
Fig.3. Filtered ECG signal (using Median filter)
B. Low Pass Butter Worth Filter
fir1 implements the classical method of windowed linearphase FIR digital filter design. It designs filters in standard low pass, band pass, high pass, and band pass configurations. Here the output of filtered signal contains the n + 1 coefficients of an order n low pass FIR filter. This is a Hamming-windowed, linear-phase filter with cutoff frequency Wn. The output filter coefficients, b, (5) are ordered in descending powers of z.
The generalized equation representing an “nth” Order Butterworth filter, the frequency response (1) is given as: (
)=
(1)
061
( ) = (1) + (2)
+ ⋯ . + ( + 1)
(5)
Wn, the cutoff frequency, is a number between 0 and 1, where 1 corresponds to half the sampling frequency (the Nyquist frequency).
Fig.6. Filtered ECG signal (using WMA filter with window size 7)
E. Stationary Wavelet Transform (SWT) The Stationary Wavelet Transform (SWT) is a wavelet transform algorithm designed to overcome the lack of translation-invariance of the discrete wavelet transform (DWT). Translation-invariance is achieved by removing the down samplers and up samplers in the DWT and up sampling the filter coefficients by a factor of 2( ) in the jth level of the algorithm.
Fig.5. Filtered ECG signal (using FIR1 filter with order 15)
D. Weighted Moving Average A weighted average is any average that has multiplying factors to give different weights to data at different positions in the sample window. Mathematically (6), the moving average is the convolution of the datum points with a fixed weighting function. (
=
)
⋯ (
(
)
(
)
(6)
) ⋯ (
)
The denominator is a triangle number equal to . In the more general case the denominator (8) will always be the sum of the individual weights. When calculating the WMA across successive values, the difference between the numerators of WMAM+1 (9) and WMAM is − − ⋅⋅⋅ − − + 1. If we denote the sum then =
−
+
+1
−
− +1
+
+1 =
III. STATISTICAL ANALYSIS
+ 1 by Total M,
A. Amplitude
= 1 −
−
+ ( − 1) + ⋯ + 2 + 1
(7)
0.112 0.11
+ (8)
0.110528 0.10963
0.109587 0.108252 0.107243
0.108
AMP
+1
+ ⋅⋅⋅ +
Fig.7. Filtered ECG signal (using SWT filter with level 5 & wavelet ‘db1’)
(9)
0.106 0.103966 0.104 0.102 0.1
Noisy
FIR
btrworth Median Moving Window
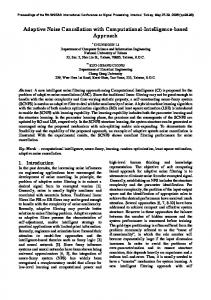
Fig.8. Amplitude changes after filtering ECG signal
062
Swt
∞
Nonlinearities that give rise to amplitude distortion can be
( )=
analyzed from the amplitude changes after filtering from the bar graph where, the input noisy ECG signal amplitude compared with filtered ECG signals of five different filters.
( )=
0.007378
0.007377
FREQUECY
0.007281
(12)
0.007372
The nonparametric methods are methods in which the estimate of PSD is made directly from a signal itself. One type of such methods is called periodogram. The periodogram estimate for PSD for discrete time sequence , , ,…., is defined as square magnitude of the Fourier transform (13) of data:
0.0072 0.007
0.00687
0.0068 0.0066 0.0064
Noisy
FIR
btrworth Median Moving Window
Swt
Fig.9. Frequency changes after filtering ECG signal
%(
The use of these filters is to remove undesired frequency imbedded in the ECG signal. The effect of filtering clearly shown in SWT while, compared to other filters.
1 )= .
.
(13)
0 -20
Noisy
FIR
-40
C. RMS
btrworth Median Moving Window
Swt
PSD
-60
RMS is a statistical measure of the magnitude of a varying quantity. In the case of a set of n values { , (
[ ( + ) ( )]
0.007509
0.0074
=
(11)
where, the autocorrelation (12) function
B. Frequency 0.0076
( ). ∞
+
+ ⋯.+
,
……
)
-80
-58.9664
-67.3009
-68.9432
-100 -120
} the RMS (10) is
-116.798
-117.244 -140 -142.78
-160
(10)
Fig.11. PSD changes after filtering ECG signal
E.
0 -20
Noisy
FIR
-40
btrworth Median Moving Window
Swt
6
KURTOSIS
RMS
-80 -82.7685
-91.103
-93.0256
-120 -140 -160 -180
4.98065
5.06952
4.92353
5
-60
-100
Kurtosis
-140.601
-141.047
4.04205
4
3.44756
3.38912
3 2 1 0
-166.582
Noisy
FIR
btrworth
Median
Moving Window
Swt
Fig.10. RMS changes after filtering ECG signal
D.
Fig.12. kurtosis changes after filtering ECG signal
Power Spectral Density
In probability theory and statistics, kurtosis is any measure of the "peakedness" of the probability distribution of a realvalued random variable. There are various interpretations of kurtosis, and of how particular measures should be interpreted; these are primarily peakedness (width of peak), tail weight, and
The power spectral density (PSD) of a wide sense stationary random process X (t) is computed (11) from the Fourier transform of the autocorrelation function R(τ);
063
[5]
lack of shoulders (distribution primarily peak and tails, not in between).
[6]
The fourth standardized moment (14) is defined as =
[( − ) ] = ( [( − ) ])
[7]
(14) [8]
where, is the fourth moment about the mean and is the standard deviation. The fourth standardized moment (15) is bounded below by the squared skewness plus 1.
[9] [10]
≥ ( ) +1
(15) [11]
IV. DISCUSSION
[12]
The morphological changes in ECG waveforms are shown in the filtering results of median and FIR filters where as there is no significant change in the noisy and filtered signal in case of LP Butterworth filter. There are no morphological changes (other than filtering of noises) in the filtered signals of WMA and SWT filters and the filtering result is quite promising. The statistical parameters like PSD, RMS and kurtosis showed that the SWT filter is performing better than the other filters where, the power of signal is not utterly disturbed. Moving average type regression line is drawn for PSD and RSM bar graphs and it clears shows the variation of filtering operations other than SWT filter. WMA filter is also performed well as compared to median, LP Butterworth and FIR-1.
[13]
[14]
[15]
[16]
[17]
[18]
V. CONCLUSION
[19]
In many situations, the ECG is recorded during ambulatory or strenuous conditions such that the signal is corrupted by different types of noise, sometimes originating from another physiological process of the body, so significant filtering technique is required. Here, five different filters performances are analyzed and their statistical parameters are extracted to compute the filtering efficiencies. SWT is found to be a suitable filter for noise cancellation from ECG signal. The further research involves real-time implementation of these filters for removal of different types of noise from ECG signal.
[20] [21]
[22]
REFERENCES [1] [2] [3]
[4]
T. Nguyen G. Strang. “Wavelets and Filter Banks”. Wellesley-Cambridge Press, 1996. C. Valens. “A really friendly guide to wavelets”. eBook, 2004. Available: http://perso.wanadoo.fr. Sander A, Voss A, “Griessbach G “An Optimized Filter System For Eliminating 50 Hz Interference from High Resolution ECG” Biomed Tech Berl; 1995 40(4): 82-7. Markovsky Ivan A Anton, Van H and Sabine 2008 “Application of Filtering methods for Removal of Resuscitation Artifacts from ECG signals” IEEE conference of Engg. In Medicine and Biology, pp 13-16
064
Hamilton PS, “A comparison of adaptive and nonadaptive filters for reduction of power line interference in the ECG”, IEEE Trans Biomed Eng. 1996 Jan; 43(1):105-9. Ider YZ, Saki MC, Gcer HA, “Removal of power line interference in signal-averaged electrocardiography systems”, IEEE Trans Biomed Eng. 1995 Jul; 42(7):731-5. Cramer E, McManus CD, Neubert D, “Estimation and removal of power line interference in the electrocardiogram: a comparison of digital approaches”, Comput Biomed Res. 1987 Feb; 20(1):12-28. McManus CD, Neubert KD, Cramer E, “Characterization and elimination of AC noise in electrocardiograms: a comparison of digital filtering methods”, Comput Biomed Res. 1993 Feb; 26(1):48-67. Sun Y, Chan K, Krishnan SM, “ECG signal conditioning by morphological filtering”, Comput Biol Med. 2002 Nov;32(6):465-79. Levkov C, Mihov G, Ivanov R, Daskalov I, Christov I, Dotsinsky I, “Removal of power-line interference from the ECG: a review of the subtraction procedure”, Biomed Eng Online. 2005 Aug 23;4:50. Wu Y, Yang Y, “A new digital filter method for eliminating 50Hz interference from the ECG”, Chinese journal of medical instrumentation. 1999 May;23(3):145-8. Ferdjallah M, Barr RE, “Frequency-domain digital filtering techniques for the removal of powerline noise with application to the electrocardiogram”, Comput Biomed Res. 1990 Oct; 23(5):473-89. P.K. Kulkarni, Vinod Kumar, H.K. Verma, “ Removal of power line interference and baseline wonder using real time digital filter”, Proceedings of international conference on computer applications in electrical engineering, recent advances; Roorkee; India, pp 20-25 Sept. 1997. Ahlstrom M.L. and Tomkins W.J. “Digital filter for ECG real time processing using microprocessors”, IEEE transactions on BME-32 pp.708713; 1885. Lynn,P.A., “ On line digital filter for biological filters: some fast designs for small computers”, Medical Biological Engineering and computing vol.15,pp 91-101. Challis RE, Kitney RI., “The design of digital filters for biomedical signal processing. Part 3: The design of Butterworth and Chebychev filters”, J Biomed Eng. 1983 Apr; 5(2):91-102. Robertson DG, Dowling JJ, “Design and responses of Butterworth and critically damped digital filters”, J Electromyogr Kinesiol. 2003 Dec; 13(6):569-73. Zschorlich VR, “Digital filtering of EMG-signals”, Electromyogr Clin Neurophysiol. 1989 Mar; 29(2):81-6. G.S.Furno and W.j. Tompkins, “A learning filter for reducing noise interference,” IEEE trans. Biomed. Eng, vol. BME-30, pp. 234- 235, 1983. John G. Webster, Ed., “Medical Instrumentation-Application and Design” Bosten: Houghton Mifflin, 1978. Tang Jing-tian, Zou Qing, Tang Yan, Liu Bin, Zhang Xiaokai, “HilbertHuang Transform for ECG De-noising” Bioinformatics and Biomedical Engineering, ICBBE, Year: 2007, pp. 664 – 667. Iffat Ara, Md. Najmul Hossain, S. M. Yahea Mahbub “Baseline Drift Removal and De-Noising of the ECG Signal using Wavelet Transform” International Journal of Computer Applications (0975 – 8887) Volume 95– No.16, June 2014.