calculations for an axisymmetric piston-cylinder assembly shown in Fig. 4. ..... 900257. Haworth, D. C, and El Tahry, S. H., 1991, "A pdf Approach for Multi-.
Bahram Khalighi staff Research Engineer, Engine Research Department, General l\flotors Research and Development Center, Warren, iVIl 48090-9055
Multidimensional In-Cylinder Flow Calculations and Flow Visualization in a Motored Engine Multidimensional simulations of coupled intake port/valve and in-cylinder flow structures in a pancake-shape combustion chamber engine are reported. The engine calculations include moving piston, moving intake valve, and valve stem. In order to verify the calculated results, qualitative flow visualization experiments were carried out for the same intake geometry during the induction process using a transient water analog. During the intake process the results of the multidimensional simulation agreed very well with the qualitative flow visualization experiments. An important finding in this study is the generation of a well-defined tumblingflowstructure at BDC in the engine. In addition, this tumblingflowis sustained and amplified by the compression process and in turn causes generation of a high turbulence level before TDC. Many interesting features of the in-cylinder flow structures such as tumble, swirl, and global turbulent kinetic energy are discussed.
Introduction The in-cylinder fluid motion in internal combustion engines is one of the most important factors controlling the combustion process. A good understanding of fluid motion during induction and compression strokes is critical to developing engine designs with the most desirable operating and emissions characteristies (Heywood, 1987). Many experimental and computational methods have contributed to understanding the role of in-cylinder flow structures in internal combustion engines (Kyriakides and Glover, 1985; Gosman, 1985; Arcoiimanis et al., 1982; Haworth et al., 1990; Khalighi, 1990; Henriot et al., 1989; Hirotomi et al., 1981; Vafidis et al., 1987). In recent years, many multidimensional modeling programs have emerged that offer researchers and designers valuable insights that can not be gleaned from the use of test-bed analysis alone (O'Conner, 1992). Although there are common flow characteristics in all engines, the exact flow depends on the particular engine under investigation. In most cases, multidimensional models have complemented the experimental work in identifying important in-cylinder flow characteristics for a particular engine that can impact the engine performance. The aim of the present investigation is to apply an in-house developed Computational Fluid Dynamics (CFD) code (Haworth et al., 1990) to investigate the iil-cyHnder flow structures generated in a pancake-shaped combustion chamber engine during both intake and compression strokes. An attempt has been made to verify the computational results using qualContributed by the Fluids Engineering Division for publication in the JOURNAL OF FLUIDS ENGINEERING. Manuscript received by the Fluids Engineering Division September 21, 1993: revised manuscript received June 27, 1994. Associate Technical Editor: O. Baysal.
itative in-cylinder flow visualization. The flow visualization study was carried out for the same engine utilizing the transient water analog used in our previous studies (Khalighi, 1990 and Khalighi, 1991). Engine Geometry and Configurations The engine specifications adopted for the present study are summarized in Table I. This engine geometry is intended to represent a pancake-shape combustion chamber with one intake valve and a centrally located spark plug. The engine's intake system consists of a bell-mouth, a 90-degree circular bend, a straight pipe (intake runner), and a 90-degree circular intake port all with the same circular cross sections. The bellmouth is installed at the entrance of the runner to ensure a uniform entry velocity distribution into the intake system. A schematic of the intake runner and port is illustrated in Fig. 1. The valve guide does not protrude into the port and thus the illustrated port-wall curvature is maintained where the valve stem passes through the port wall.
Computational Approach In this section, a brief description of the numerical algorithm and turbulence modeling is given. Next, initial and boundary conditions are described, followed by a brief presentation of the computational mesh and grid generation. Numerical Algorithm and Modeling. An in-house computational fluid dynamics (CFD) code is used for the present study (Haworth et al., 1990 and Haworth et al., 1993a). This code is a general finite volume based approach and is suitable for solving problems which are: one, two, or three-dimen-
2 8 2 / Vol. 117, JUNE 1995
Transactions of the ASME
Copyright © 1995 by ASME
Table 1 Engine specifications 92.00 ram Bore 86.00 mm Stroke 223.50 mm Con. rod length 8:1 Compression ratio 8.90 mm at 474 degree after TDC Max. intake valve lift 364 deg after TDC (lift = 0.50 mm) IVO 590 deg after TDC (lift = 0.25 mm) IVC 1300.00 r/min Engine speed 46.00 kPa MAP
Runner-to-Port Interface
Fig. 1 The engine Intake runner, port, and valve seat
sional, transient or steady, turbulent or laminar, compressible or incompressible; and which depend on heat and species transfers. The principal equations solved are the mean momentum, mean internal energy, turbulence kinetic energy (k), and viscous dissipation rate of turbulence energy (e). The mean density is calculated from an equation of state. A standard twoequation k—e turbulence model is used. The model constants adopted for this study are summarized in Table 2. These constants have been used for several previous engine calculations (Haworth et al., 1990) and, hence, are adequate for our application. Complete details of the derivation of the governing equations and the turbulence modeling may be found in Haworth et al., 1990. The governing partial differential equations are discretized on an unstructured finite element-like mesh of arbitrary hexahedral cells (Haworth et al., 1990 and Haworth et al., 1993a). This approach provides maximum geometric flexibility, which is particularly important for generating grids in engine applications. All computed variables (velocities, turbulence, densities, etc.) are located at cell centers. Blended differencing has been implemented for the approximation of spatial derivatives in the mean momentum equations. This includes the standard (first-order) upwind differencing and the central differencing (second-order) numerical schemes. Blending is controlled by a parameter y as described by Haworth et al. (1990). This parameter varies between y = 0 for pure upwind differ-
Table 2 Constant
c, C2
c, k
Model constants used in the k-e equations Value 0.09 1.44 1.93 -0.34 1.00 1.19 0.4187
encing and y = 1 for pure central differencing. For our study, the value of 7 = 0.5 was used. Another important parameter is the computational time-step which was varied from 1/4 crankangle at intake valve opening (IVO) and intake valve closing (IVC) to one crank-angle during the computation. To account for the motion of the intake valve and the piston in an unstructured grid environment, a general grid motion treatment was employed. This algorithm allows three-dimensional deformation of the computational mesh in response to arbitrary motion of the boundaries (Haworth et al., 1990). In addition, a nonaligned-interface (shearing grid) capability is utilized which allows for surfaces inside the computational mesh whose cell faces need not match across common surfaces. This allows simpler or optimum mesh topologies to be selected. In a recent article, Demirdzic and Peric (1988) have presented a volume conservation constraints applicable to numerical solutions of fluid flow problems in moving coordinates. The algorithm used in the present study satisfies this constraint exactly, since grid point, and not cell face, velocities are being solved for. Initial and Boundary Conditions. The calculations are started at intake valve opening (IVO) with the piston and the intake valve assigned their appropriate position and speeds. The in-cylinder axial mean velocity is assumed to vary linearly between the piston velocity and the velocity at the port outlet. The in-cylinder radial and tangential {x and y) velocity components as well as mean velocity in the port, are set to be zero. The initial fluid temperature, mean density, pressure and species concentrations are assumed to be uniform inside the cylinder as well as inside the intake port. Initial turbulence kinetic energy and its dissipation rate are scaled to the mean piston speed as described by Haworth et al., 1990. Boundary conditions are specified at all moving (piston and valve) and stationary walls (cylinder and port walls) as well as the intake port entrance (orifice). This includes mean velocities, temperatures, turbulent kinetic energy (k) and turbulence dissipation rate (e). At the port-orifice entrance, constant and uniform mean static pressure and temperature are specified. Turbulence kinetic energy at the orifice is scaled to the mean velocity, while the dissipation term is tied to the port diameter. A detailed description of boundary treatments may be found in Haworth et al., 1990. Grid Generation. Figure 2 outlines the computational mesh at 540 deg crank angle (BDC) used in this investigation. TDC at the start of intake is defined as 360 deg crank angle throughout this paper. The computational model reflects the geometry of the hardware used in the experimental studies. The total number of computational cells is approximately 60,000 for this model. The model includes the intake port, intake valve, valve stem, runner, and the intake bell-mouth as shown in Figs. 1
Nomenclature BDC IVC IVO TDC
= = = =
bottom dead center intake valve closure intake valve opening top dead center
Journal of Fluids Engineering
77?;^ = TRy = SR^ = Up =
X component of tumble ratio y component of tumble ratio swirl ratio mean piston speed
k = turbulent kinetic energy u' = turbulence fluctuation e = dissipation rate
JUNE 1995, Vol. 117/283
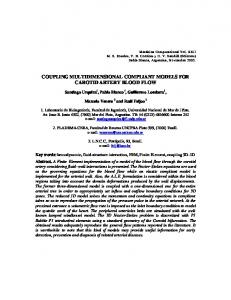
Fig. 4 1984)
Fig. 2 Outline of the computational mesh at BDC
/ /
\
/
IVO 3&0
'
37fi
"^ 400
42K
4S0
476
600
6&6
B50
Crank angle (380 = TDC lintake)
Fig. 3
intake valve lift profile
and 2. The exhaust valve and port are not modeled for this study. The intake valve lift profile used for the calculations is shown in Fig. 3. In order to carry out the computations, the valve lift profile had to be truncated at both ends (opening and closing). This compromise was made to ensure that the minimum valve lift was limited to a nonzero value so that computational cells in the valve seat region remain of nonzero volume. In all the calculations, the intake valve opening (IVO) and intake valve closing (IVC) are set at 364 and 590 deg, respectively (see Fig. 3). Numerical Accuracy. Numerical accuracy remains an issue in multidimensional computational fluid dynamics for incylinder flows. The degree of spatial accuracy of the numerical solution is known to have a strong influence on computed incylinder angular momentum, turbulence level, and mixing between fresh charge and residual gas, in particular. The conventional approach to assessing numerical accuracy in multidimensional fluid flow calculations has been to per* 284 / Vol. 117, JUNE 1995
Axisymmetric piston-cylinder assembly (Vafldls and Whitlaw,
form grid refinement tests. Our present calculations with two different grid sizes 60,000 and 120,000, showed insignificant changes in the levels of tumble (TRj, and 77?,,) and swirl (SR,) inside the engine. Based on our calculations an order-of-magnitude increase in the number of cells are required for substantial benefits in accuracy. On the other hand, higher-order schemes have been seen to yield substantial improvement in results. It is well known that standard linear-upwind differencing yields excessive artificial dissipation. Higher-order numerical schemes offer a computationally efficient route to the accurate representation of three-dimensional time-dependent internal flows on practical computational meshes. There is a substantial benefit to using values of y as small as 0.5 (for the present study), even though the formal accuracy of the convective differencing remains first order in space. To illustrate the importance of numerics, the computed BDC tumble ratio (TR^) in the present computation is 77?;t = -1.5 using the 50/50 percent blend, while pure linear upwind differencing (y = 0) yields TR^ = - 1 . 3 . The higher tumble ratio magnitude results from improved conservation of angular momentum with higherorder scheme. Furthermore, the computed turbulence kinetic energy increased markedly (20 percent) with improved numerics. To address the issue of accuracy in more details we present calculations for an axisymmetric piston-cylinder assembly shown in Fig. 4. This flow has been the subject of numerous modeling and experimental studies (Gosman et al., 1980, Diwaker and El Tahry, 1983, Vafidis and Whitelaw, 1984, Haworth and El Tahry, 1991, Haworth et al., 1993b), and the reader is referred to these studies for details of the flow and for comparison between computations and measurements. Example comparisons between computed and measured mean axial velocities at 36 deg after top-dead-center (TDC) is shown in Fig. 5 (Haworth et al., 1993b). It can be seen that agreement is good except at the second measurement station, where computed profile undershoots the measured one. Local convergence is shown in Fig. 6. In this figure, the computed peak mean axial velocity at the measurement location closest to the head plane at 36 deg after TDC (Fig. 5) has been plotted as a function of mesh spacing rir and of differencing parameter y. It can be seen that increasing the spatial accuracy of the convective differencing scheme is an effective approach to improved accuracy: an order-of-magnitude increase in the number of computational cells with y = 0 gives the same improvement as increasing y from 0.0 to 0.7 with tir = 28 (Haworth et al., 1993b). These results are typical of our experience with in-cylinder and other internal flows.
Experimental Procedures In order to validate the computational results obtained from our calculations, an experimental flow investigation was carTransactions of the ASME
lOVp
Fig. 5 Computed (bold solid lines) and Measured (symbols, light dashed lines) mean axial velocity profiles at 36 deg after TOC normalized by the mean piston speed. Computations are for a 50 x SO mesh with y = 0.9 (Haworth et al., 1993b)
126 88
62
43
28
%
100 m/s
o 7 = 0.0 (linear upwind) A 7 = 0.3 V 7 = 0.5 D 7 = 0.7 7 = 1.0 (central)
Fig. 6 Peal( mean axial velocity at 10 mm from the head versus grid spacing n,"' and differencing scheme y, axisymmetric configuration (Haworth et al., 1993b)
(c)
100 m/s
ried out. The experimental study involved in-cylinder flow visualization during the induction stroke. A flow box model of the engine head was fabricated and mounted on the transient water analog (Khalighi, 1990 and Khalighi, 1991). The working fluid was water which was seeded with a small amount of neutral density particles. Particles used for the flow visualization were Pliolite spheres with sizes of 250-300 /xm. For these experiments, the field of interest was illuminated by a continuous laser light sheet, and a Panasonic video system (S-VHS system) was used to record the in-cylinder flow development during the induction process. For this study the transient water analog was operated at 65 r/min, which corresponds to an equivalent engine speed of 1300 r/min. Details of the operation and similarity discussion for the transient water analog are given in Khalighi, 1991. It should be mentioned that the water analog experiment is used only to validate the intake process and can not be used for validation of the compression stroke.
Results The coupled port-and-cylinder modeling (computation) study for the engine is carried through the induction and compression strokes starting shortly after TDC intake (TDC intake is 360 deg). Computational results presented in this report are for the in-cylinder flow simulating a single part-load, low-speed engine operating condition (46 kPa manifold pressure, 13()0 r/min) under motored conditions (no combustion). Results are presented in two sections. First, detailed in-cylinder spatial mean velocity fields are discussed. The corresponding in-cylinder flow visualization (experimental) result is presented and compared with the computed one. The second set of results (computed) are global quantities of interest such Journal of Fluids Engineering
(d)
^° ™'«
Fig. 7 Computed velocity field on cutting plane 1: (a) position of the cutting plane; (b) 420 deg; (c) 450 deg; (o^ BDC
as tumble and swirl ratios, and the mass-averaged turbulence kinetic energy (k). Spatial In-Cylinder Flow Structures Induction Process (Intake Stroke). Figure 7 illustrates the calculated in-cylinder flow structures on an axial cutting plane. JUNE 1995, Vol. 117/285
Fig. 8 Velocity contours on cutting piane 1 at 420 deg. Daric coior (around the intalce valve) represents the Jet penetration Inside the cylinder.
The cutting plane, the location of the intake valve, and the coordinate system are also depicted in the figure. This figure shows the development of the intake process during an engine cycle at three different crank angles. Velocity fields are presented with vectors (arrows) whose lengths are proportional to the local velocities at the corresponding locations in the flow field. The directions of the velocities are specified by the direction of the arrows. These velocity fields indicate the presence of a structured flow comprised of two pairs of counter-rotating vortices under the intake valve during the early induction (420 deg in Fig. lib)). These flow structures are visible for most of the intake flow process. As the piston moves towards BDC, a coherent tumbling motion is being developed in this cutting plane. At BDC the in-cylinder flow field is clearly dominated by this single large scale flow structure (Fig. 7(d)) with its axis of rotation in the -x direction (clockwise rotation in the figure). The +x direction defines the axis of a counter clockwise vortical motion on this plane. To see how the tumbling flow is generated in this engine configuration, it is useful to re-examine Fig. 7; this time using contour plots as shown in Fig. 8 to represent velocities. Different gray levels in this figure correspond to instantaneous spatial velocities, and it is suitable to observe the jet flow penetrations inside the cylinder. As can be observed from this figure, the in-cylinder flow is characterized by the presence of two distinct jet-like flows emerging from the valve curtain area during early induction (dark area on the right and left sides inside the valve). It should be noted that these two distinct jet flows are parts of a single annular (conical) jet produced by the intake valve opening. However, for convenience it is treated as two separate jets on a two-dimensional cutting plane. As the piston moves downward, the jet flow on the right side (see Fig. 8) maintains its relatively high momentum and attaches to the cylinder walls while the jet flow on the left side goes down the cylinder axis. During the induction stroke the strong jet (right side) is redirected by the piston face which produces the tumbling flow later at BDC. It was rather surprising that such a well defined tumbling flow structure (Fig. 7(d)) existed for this engine configuration (with standard intake valve) since in most previously reported works, shrouds were used to produce such a well defined tumble in pancake-shape geometry engines (Kyriakides and Glover, 1985; Gosman et al., 1985). Therefore, it was necessary to verify the in-cylinder flow structure obtained from these calculations. As mentioned earlier, this was accomplished by conductingflowvisualization experiments using a transient water analog. In making comparisons between the flow structures observed in the water rig and the calculated flow, one must remain aware of different natures of the quantities involved, i.e., cycle-resolved flow field for the former versus phase-averaged velocities for the latter. In cases where flow structures are repeatable from cycle to cycle, these comparisons are justified. 286 / Vol. 117, JUNE 1995
(a)
Fig. 9 Flow visualization pictures of the flow field on cutting piane 1: (a) 450 deg; (b) BDC
Our flow visualization experiments for the present engine configuration showed that the in-cylinder flow structure was repeatable from cycle to cycle except during early induction (to about 480 deg). Figure 9 presents video images showing the in-cylinder flow structures for two different crank angles during intake for the same intake configuration. These pictures were taken on the same plane (cutting plane 1). As can be seen from these images, this intake configuration generates a well defined tumble at BDC, and the calculations (Fig. 7) have captured the qualitative features of in-cylinder flow structures very well. In particular, one can observe the generation of the counter rotating vortices under the valve during mid-induction and the welldefined tumbling flow at BDC (Fig. 9 (b)). In the water rig, it was also observed that a coherent tumbling motion is not established until near BDC intake; this is consistent with the computational results of Fig. 7. Compression Process. Development of the in-cylinder flow structures during the compression stroke is shown in Figure 10 on the same cutting plane. This figure contains a sequence of velocity fields at three different crank angles, namely 630, 690, and 720 deg. As evident in this figure, the dominant feature of the mean flow field continues to be the main tumbling flow which becomes considerably compressed and weaker during the compression stroke. As the piston moves toward TDC, the vortex is confined under the intake valve near the cylinder Wall (right-side wall in Fig. 10(a)). At TDC, however, the tumbling vortex is clearly dissipated and a pair of very weak vortices Transactions of the ASME
y
v*-.^ 3^-^^„
"^.
•
'/lit
-
-
-
-
'
""--
V
^'
/\
\^ ^
\
7'
'~ '
•
\
.
,
^
-
^
/
•
/
.EGEND 1-SRz
-3350
400
460
500
550
600
1
650
1
700
750
Crank angle (360 = TDC Intake)
(a)
Fig. 12 Tumble and swirl ratios about the Instantaneous center-of-mass
schematic of the various tumble and swirl components (TO,,, TRy, and SR^) and their corresponding axes of rotation.
(b)
Ji^^ I < •
I
^ 'M
*•*—
Fig. 10 Development of the In-cylinder flow during compression on cutting plane 1: (a) 630 deg; (b) 690 deg; (c) 720 deg
Fig. 11 Schematic of the tumble and swirl components and their corresponding axes of rotations
are apparent (with mean velocity of less than 1.5 m/s, Fig. 10(c)). Evolution of Global Quantities. In this section we discuss the evolution of the computed global in-cylinder quantities during intake and compression strokes. These quantities are: tumble, swirl, and turbulence kinetic energy (fc = u'/U^. Up is the mean piston speed. Tumble and swirl ratios are the total angular momentum of the in-cylinder fluid about the respective axis, divided by the moment of inertia about that axis, and normalized by the crankshaft angular speed. Tumble and swirl ratios are calculated with respect to the instantaneous fluid center of mass as described in Haworth et al., 1990. Figure 11 illustrates the Journal of Fluids Engineering
Tumble and Swirl Ratios. Figure 12 shows the evolution with crank angle of the tumble (TR^ and 77?,,) and swirl (SR,) ratios for this engine. Looking at angular momentum as an equivalent rotation rate in this engine, we observe some interesting features of the global behavior of the in-cylinder tumble. First, in general the dominant tumble components 77?^ (Fig. 12) increases (absolute value) during (he early induction, reaches its peak, and then significant decay occurs, particularly during late compression to a level of almost zero at TDC. Second, TRy increases (absolute value) somewhat during part of the compression stroke as the piston moves upward. This is usually referred to as "spinning-up" during compression. Similar observations have been reported by Gosman et al., 1985 and Haworth et al., 1990. This "spin-up" process is due to decreasing moment of inertia of the in-cylinder fluid as the piston rises while the fluid tends to maintain its angular momentum (Gosman et al., 1985; Haworth et al., 1990). Both the rapid destruction of the tumble motion and the "spin-up" are linked to turbulence generation at TDC and will be discussed later. As seen in Fig. 12, swirl ratio (SR^) increases (absolute value) during the intake stroke and reaches its maximum level (swirl ratio of 1) at approximately 480 deg. From this crank angle on, swirl magnitude decreases (absolute value) through the rest of the engine cycle (i.e., intake and compression). This reduction is due to the dissipation of angular momentum in the cylinder (physical), and also some artificial dissipation introduced by the numerical scheme. Therefore, the actual dissipation rate in the swirling process is most likely somewhat smaller than the one computed here. The computed and measured intake-valve-closure (JVC) swirl ratios for this engine configuration are 0.65 (at 590 deg) and 0.70, respectively. The agreement between the calculated and measured swirl is excellent. The measured swirl value was obtained from steady-flow measurements of torque at fixed valve lifts; these data are processed by an engine simulation program to yield equivalent swirl ratio. The result from such an experiment is generally regarded as the swirl value at IVC. The momentum summation done by the engine simulation program does not account for dissipation and, hence, is expected to be somewhat higher. Global Turbulence Kinetic Energy. A very interesting aspect of this study is the relative behavior of the turbulence kinetic energy during compression. The evolution of the turbulent kinetic energy with crank angle for this engine configuration is shown in Fig. 13. This figure clearly illustrate the expected trend of higher turbulence energy during the intake process. There is a peak around 450 deg (maximum valve annulus flow velocities). JUNE 1995, Vol. 1 1 7 / 2 8 7
• Computed flow fields during intake agreed fairly well with the flow visualization experiments. • In order to generate a well-defined in-cylinder tumble it is essential for the jet flow emerging from the intake valve curtain area to attach to the cylinder wall and be redirected by the piston face. • Computed swirl ratio at IVC (Intake Valve Closure) was in excellent agreement with the measured one under steady flow condition.
'^, \
s .a 1.6
/
J 300
380
\
400
4fiO
500
560
600
eSO
TOO
Acknowledgments
760
Crank angle (360 = TDC InUke) Fig. 13 Global In-cyllnder turbulence kinetic energy as a function of crank angle
Looking at Fig. 13 it can be observed that a significant decay of the global turbulent kinetic energy occurs between 460 and 630 deg. It is after this point (630 deg) that the global turbulent energy is amplified rather than decayed. This additional turbulence produced just before TDC can significantly enhance flame propagation. The increase in the turbulence level is mostly attributed to generation of the well-defined tumble motion during the intake process which persists long enough into the compression stroke to be destroyed and enhanced by the compression process (Gosman et al., 1985 and Ha worth et al., 1990). Therefore, this reiterates the fact that tumble is the major source of turbulence production inside the engine cylinder during compression while the effect of swirl on turbulence generation is minimal particularly during early combustion. It should be noted that the initial phase of combustion is controlled by both flow and spark plug characteristics. From then on, flame propagation tends to become independent of ignition conditions and very sensitive to the remaining mean flow velocity field. This suggests that the role of swirl may in fact be important during late combustion, particularly for cyclic variability, since the tumbling flow clearly vanishes at TDC as discussed earlier. However, it is still not clear what conditions near TDC of compression are optimum from the point of view of enhanced burning and reduced cyclic variability.
Summary and Conclusions Multidimensional in-cylinder flow calculations and flow visualization experiments were performed for a pancake-shape combustion chamber engine. Comparisons of the in-cylinder flow structures between computations and flow visualization experiments during the intake stroke revealed that our calculations have captured the general in-cylinder flow features very well. It was rather surprising to see that this engine configuration produced a well-defined cylinder-size tumbling flow structure. The reason is, of course, the behavior of the intake jet flows emerging from the valve curtain area as seen in both the calculations and experiments. This engine configuration generated a jet flow which attached to the cylinder wall was then directed across the cylinder by the piston face. Principal findings are as follows: • The engine with standard intake valve generates a welldefined tumbling flow structure at BDC which is sustained and amplified by the compression process and in turn causes generation of a high level of turbulence before TDC.
288 / Vol. 117, JUNE 1995
The author would like to thank D. C. Haworth and M. S. Huebler for their support and contributions during the course of this study. References Arcoumanis, C , Bicen, A. F., and Wiiitelaw, J. H., "Effect of Inlet Parameters on the Flow Characteristics in a Four-Stroice Engine," SAE Paper No. 820750, 1982. Demirdzic, I., and Peric, M., 1988, "Space Conservation Law in Finite Volume Calculations of Fluid Flow," International Journal for Numerical Methods in Fluids, Vol. 8, pp. 1037-1050. Diwaker, R., and El Tahry, S. H., 1983, "Comparison of Computed Flowfields and Wall Heat Fluxes with Measurements from Motored Reciprocating Engine-Like Geometries," Computational Engineering, Vol. 1, pp. 175-188. El Tahry, S. H., 1982 "A Numerical Study on the Effect of Fluid Motion at Inlet-Valve Clousure on Subsequent Fluid Motion in a Motored Engine," SAE Paper No. 820035. Glover, A. R., Hundleby, G. E., and Hadded 0 . , 1988, "An Investigation into Turbulence in Engine Using Scanning LDA," SAE Paper No. 880379. Gosman, A. D., Johns, R. J. R., and Watkins, A. P., 1980, "Development of Prediction Methods for In-Cylinder Process in Reciprocating Engines," Mattavi, J. N., and Amann, C. A., eds. Combustion Modeling in Reciprocating Engines, Plenum, New York, pp. 69-129. Gosman, A. D., 1985, "Multidimensional Modeling of Cold Flows and Turbulence in Reciprocating Engines," SAE Paper No, 850344. Gosman, A. D., Tsui, Y. Y., and Vafidis, C , 1985, "Flow in a Model Engine with a Shroud Valve—a Combined Experimental and Computational Study," SAE Paper No. 850498. Haworth, D, C , El Tahry, S. H., Huebler, M. S., and Chang S., 1990, 'Multidimensional Port-and-Cylmder-Flow Calculations for Two-and Four-Valveper-Cylinder Engines: Influence of Intake Configuration on Flow Structure," SAE Paper No. 900257. Haworth, D. C , and El Tahry, S. H., 1991, "A pdf Approach for Multidimensional Turbulent Row Calculations with Application to In-Cylinder Rows in Reciprocating Engines," AIAA Journal, Vol. 29, pp. 208-218. Haworth, D. C , Huebler, M. S., El Tahry, S. H., and Matthes W. R., 1993a, "Multidimensional Calculations for a Two-Stroke Cycle Engine: A Detailed Scavenging Model Variation," SAE Paper No. 932712. Haworth, D. C , El Tahty, S. H., and Huebler, M. S., 1993b, "A Global Approach to Error Estimation and Physical Diagnostics in Multidimensional Computational Fluid Dynamics," International Journal for Numerical Methods in Fluids, Vol. 17, pp. 75-97. Henriot, S., Coz, J. F., and Pinchon, P., 1989, "Three-Dimensional Modeling of Flow and Turbulence in a Four-Valve Spark Ignition Engine-Comparison with LDV Measurements," SAE Paper No. 890843. Hey wood, J. B., 1987, "Fluid Motion within the Cylinder of Internal Combustion Engines-The 1986 Freeman Scholar Lecture," ASME JOURNAL OF FLUIDS ENGINEERING, Vol. 109/3, Mar. Hirotomi, T. et al., 1981, "Study of Induction Swirl in a Spark Ignition Engine," SAE Paper No. 810496. Khalighi, B., 1990, "Intake-Generated Swirl and Tumble Motion in a 4Valve Engine with Various Intake Configurations-Flow Visualization and Particle Tracking Velocimetry," SAE Paper No. 900059. Khalighi, B., 1991, "Intake Swirl Process Generated by an Engine Head: a Flow Visualization Study," ASME Journal of Engineering for Gas Turbines and Power, Vol. 113, No. 3, pp. 433-439. Kyriakides, S. C. and Glover, A. R., 1985, "A Study of the Correlation Between In-Cylinder Air Motion and Combustion in Gasoline Engines," IMechE. O'Conner, L., 1992, "Computational Fluid Dynamics: Giving A Boost to Engine Design," Mechanical Engineering, Vol. 114, No. 5, pp. 44-50, May. Vafidis, C , and Whitelaw, J. H., 1984, "Intake Valve and In-Cylinder Flow Development in a Reciprocating Model Engine," Report FS/84/32, Imperial College, Department of Mechanical Engineering, London, UK. Vafidis, C , Vorropoulos, G., and Whitelaw, J. H., 1987, "Effect of Intake Port and Combustion Chamber Geometry on In-Cylinder Turbulence in a Motored Reciprocating Engine," ASME Winter Annual Meeting.
Transactions of the ASME