Hindawi Publishing Corporation Mathematical Problems in Engineering Volume 2013, Article ID 361031, 7 pages http://dx.doi.org/10.1155/2013/361031
Research Article Multiobjective Gate Assignment Based on Passenger Walking Distance and Fairness Yu Jiang, Linyan Zeng, and Yuxiao Luo Nanjing University of Aeronautics and Astronautics, College of Civil Aviation, Nanjing 210016, China Correspondence should be addressed to Linyan Zeng;
[email protected] Received 29 August 2013; Accepted 21 October 2013 Academic Editor: Baozhen Yao Copyright © 2013 Yu Jiang et al. This is an open access article distributed under the Creative Commons Attribution License, which permits unrestricted use, distribution, and reproduction in any medium, provided the original work is properly cited. Passenger walking distance is an important index of the airport service quality. How to shorten the walking distance and balance the airlines’ service quality is the focus of much research on airport gate assignment problems. According to the problems of airport passenger service quality, an optimization gate assignment model is established. The gate assignment model is based on minimizing the total walking distance of all passengers and balancing the average walking distance of passengers among different airlines. Lingo is used in the simulation of a large airport gate assignment. Test results show that the optimization model can reduce the average walking distance of passenger effectively, improve the number of flights assigned to gate, balance airline service quality, and enhance the overall service level of airports and airlines. The model provides reference for the airport gate preassignment.
1. Introduction Airport gate is a main component of airport resource. Rational and efficient gate assignment is an important way to improve airport operation efficiency and passenger service level. Airport gate is divided into contact gate (a gate with an aerobridge) and remote stand (on the apron). The type and layout lead to different distance from gate to security check, baggage hall, and transit counters. The distance between different areas has a direct impact on passenger activities in the terminal. How to optimize the gate assignment from the perspective of passengers becomes a hot research area at home and abroad. At present, the main research findings of gate assignment from the perspective of passengers took the shortest passenger walking distance and the minimum embarking and transit time as objective function to optimize gate assignment; for example, Braaksma, [1], Babic et al. [2], Mangoubi and Mathaisel [3], Yan and Huo [4], Bolat [5], Yan et al. [6], and Cheng’s [7] research findings showed that reasonable gate assignment could reduce passenger walking distance appropriately. In 1998, Haghani and Chen [8] took the number of transfer passengers of different flights and the distance between different gates into account comprehensively while minimizing passenger walking distance in
a terminal. Assuming that all passengers were converted into transit passengers and had taken the shortest transit time as the objective function, Xu and Bailey [9] established quadratic mixed 0-1 integer programming model of gate assignment through virtual assumption. In further research, some scholars began to consider minimizing the number of flights, which are assigned to remote stands, and the passenger walking distance/time, such as Pintea et al. [10], Ding et al. [11, 12], and so on; some scholars considered minimizing walking distance together with delay costs, like Zhu et al. [13], balancing usage of airport gates, like Wei and Liu [14, 15], passenger waiting time, like Hu and Paolo [16], and fuel consumption of aircraft taxiing, like Maharjan and Matis [17], respectively. Optimization gate assignment from the perspective of passengers can reduce passenger walking distance and improve passenger service levels to a certain extent. However, there are some deficiencies in research findings. Firstly, in some large hub airporsts, the proportion of transit passengers is large and the actual walking distance of transit passengers is not equal to the actual distance between two gates. The walking distance is related with the layout of transit counters and transit halls. In the research, ignoring transit passengers can cause the model to be inaccurate. Secondly, civil airport service quality issued by the Civil Aviation Administration
2
Mathematical Problems in Engineering
in 2006 requires that the number of passengers embarking/disembarking through aerobridges should be above 80%. But in most current research, the proportion of passengers is not taken into account. Thirdly, most current researches do not consider the balance of passenger walking distance between different airlines, which can lead to reducing the passenger service level and can be unfair for some airlines, especially for small airlines. Optimizing gate assignment can improve passengers’ satisfaction and balance the service quality of each airline. In this research, we propose a new model which is different from previous researches; the gates are categorized into contact gate and remote stand in the mode, the proportion of passenger embarking/disembarking through aerobridges is taken into account, and the model considers the fairness between airlines besides reducing the overall passengers’ walking distance. The paper is organized as follows. The gate assignment model is detailed in Section 2. Section 3 briefs the simulation software and analyzes the results under different conditions in detail. Some conclusions are drawn in the last section.
2. Gate Assignment Model 2.1. Description of Gate Assignment. Gate assignment is to arrange a reasonable gate for each arrival-departure flight timely according to the flight plan, which is submitted by every airline. Safety operation of aircraft and gate is the premise of gate assignment. Passenger walking distance in a large airport is composed of three parts: arrival passenger walking distance, departure passenger walking distance, and transit passenger walking distance. The arrival passenger walking distance refers to the distance from gate to baggage hall; the departure passenger walking distance refers to the distance from security check to gate; the transit passenger walking distance refers to the distance from gate to transit counter and then to the next flight gate. The arrival-departure transit passengers are known collectively as transit passengers in the paper. The walking distance of transit counter passengers includes the arrival passengers’ distance from gate to transit counter and the departure passengers’ distance from transit counter to gate. Minimizing and balancing the walking distance of all passengers from different airlines are goals to model gate assignment in the paper. Then Lingo software is adopted to verify the effectiveness of a model in order to improve the service level of airport and airline.
(3) The arrival-departure flight performed by the same aircraft is assigned to the same gate and it used the same flight number. (4) All information, such as flight plan, aircraft basic information, the usage status of gates, and so on, is known in research time. (5) Only the gate assignment of domestic flights is considered in the paper. 2.3. Symbol Definition 𝐹: flight set, 𝐹 = {𝑓1 , 𝑓2 , . . . , 𝑓𝑚 }, 𝑚 is the total number of flights in research period. 𝑓𝑖 (1 ≤ 𝑖 ≤ 𝑚) is flight number which is ordered by the arrival time of flights; the bigger 𝑖 means the later flight 𝑓𝑖 arrives at the airport. 𝑐𝑓𝑖 : size of the aircraft which executes flight 𝑓𝑖 . The bigger 𝑐𝑓𝑖 is, the larger aircraft is. The smaller 𝑐𝑓𝑖 is, the smaller aircraft is. 𝐿: airline set, 𝐿 = {𝑙1 , 𝑙2 , . . . , 𝑙𝑞 }, 𝑞 is the total number of airlines in research period. 𝑙𝑎 (1 ≤ 𝑎 ≤ 𝑞) is airline code. 𝐹𝑙𝑎 : the flights set of airline 𝑙𝑎 . 𝐺: gate set, 𝐺 = {𝑔1 , 𝑔2 , . . . , 𝑔𝑛 }, 𝑛 is the total number of gates. 𝑔𝑘 (1 ≤ 𝑘 ≤ 𝑛) is gate code. Assuming that the number of gates is 𝑥, if 𝑘 ≤ 𝑥, it means that 𝑔𝑘 gate is a contact gate; otherwise, it is a remote stand. 𝑐𝑔𝑘 : size of gate 𝑔𝑘 ; the bigger 𝑐𝑔𝑘 means the larger aircraft can be parked on the gate; the smaller 𝑐𝑔𝑘 means the smaller aircraft can be parked. 𝑎𝑓𝑖 : arrival time of flight 𝑓𝑖 ; the unit is minute. 𝑑𝑓𝑖 : departure time of flight 𝑓𝑖 ; the unit is minute. 𝑇: minimum time interval of two flights which are assigned to the same gate; the unit is minute. 𝑆𝑔𝑎𝑘 : distance of arrival passenger walking from gate 𝑔𝑘 to baggage hall. 𝑆𝑔𝑑𝑘 : distance of departure passenger walking from security checking to gate 𝑔𝑘 .
𝑆𝑔𝑚𝑘 : distance between gate 𝑔𝑘 and transit counter. 𝑁𝑓𝑎𝑖 : number of arrival passengers of flight 𝑓𝑖 .
𝑁𝑓𝑑𝑖 : number of departure passengers of flight 𝑓𝑖 . 𝑁𝑓𝑚𝑖 : number of transit passengers of flight 𝑓𝑖 .
2.2. Model Assumptions (1) Gate assignment is a continuous operation course. In order to reduce the scale of the problem, the paper selects some time intervals for gate assignment. (2) The capacity of gates can meet the demand of all flights in the research time; it means that every flight can be assigned to a gate.
Consider 1, 𝑦𝑓𝑖 ,𝑔𝑘 = { 0, 𝑧𝑓𝑖 ,𝑓𝑗
1, { { ={ { {0,
if flight 𝑓𝑖 is assigned to gate 𝑔𝑘 , otherwise, if flight 𝑓𝑖 and 𝑓𝑗 are assigned to the same gate, otherwise.
(1)
Mathematical Problems in Engineering
3
2.4. Modeling. Minimizing the total walking distance of all passengers in research period is one of the goals in the paper. Consider min 𝑍1 =
∑ ∑ 𝑦𝑓𝑖 ,𝑔𝑘 (𝑁𝑓𝑎𝑖 𝑆𝑔𝑎𝑘 𝑓𝑖 ∈𝐹 𝑔𝑘 ∈𝐺
+
𝑁𝑓𝑑𝑖 𝑆𝑔𝑑𝑘
+
(2)
where represents the total walking distance of arrival passengers of flight 𝑓𝑖 walking from gate 𝑔𝑘 to baggage hall; 𝑁𝑓𝑑𝑖 𝑆𝑔𝑑𝑘 represents the total walking distance of departure passengers of flight 𝑓𝑖 walking from security checking point to gate 𝑔𝑘 ; 𝑁𝑓𝑚𝑖 𝑆𝑔𝑚𝑘 represents the total walking distance of transit passengers of flight 𝑓𝑖 . According to the objective function (2), gate assignment may result in longer walking distance of some airlines’ passengers while some others are shorter. The objective function (2) can lead to unbalanced passenger walking distance among airlines and reduce the airlines’ service quality. Therefore, in order to improve the service quality of the entire airport, it is necessary to balance passenger walking distance of each airline from the viewpoint of airline fairness. Consider min 𝑍2 = max 𝑍𝑆𝑙 , 𝑆𝑙𝑎 =
(3)
𝑎
∑𝑓𝑖 ∈𝐹𝑙 ∑𝑔𝑘 ∈𝐺 𝑦𝑓𝑖 ,𝑔𝑘 (𝑁𝑓𝑎𝑖 𝑆𝑔𝑎𝑘 + 𝑁𝑓𝑑𝑖 𝑆𝑔𝑑𝑘 + 𝑁𝑓𝑚𝑖 𝑆𝑔𝑚𝑘 ) 𝑎
∑𝑓𝑖 ∈𝐹𝑙 (𝑁𝑓𝑎 + 𝑁𝑓𝑑 + 𝑁𝑓𝑚 ) 𝑖
𝑎
𝑖
,
𝑖
(4) 𝑆=
∑𝑓𝑖 ∈𝐹 ∑𝑔𝑘 ∈𝐺 𝑦𝑓𝑖 ,𝑔𝑘 (𝑁𝑓𝑎𝑖 𝑆𝑔𝑎𝑘 + 𝑁𝑓𝑑𝑖 𝑆𝑔𝑑𝑘 + 𝑁𝑓𝑚𝑖 𝑆𝑔𝑚𝑘 ) ∑𝑓𝑖 ∈𝐹 (𝑁𝑓𝑎 + 𝑁𝑓𝑑 + 𝑁𝑓𝑚 ) 𝑖
𝑍𝑆𝑙
𝑎
𝑖
𝑆𝑙𝑎 − 𝑆 , = 𝑆
,
(5)
𝑖
(6)
𝑙𝑎 ∈ 𝐿.
The objective function (3) is to minimize the ratio between the difference and the average walking distance of all passengers, where 𝑆𝑙𝑎 represents the average passenger walking distance of airline 𝑙𝑎 in research period; 𝑆 represents the average walking distance of all passengers in research period; 𝑍𝑆𝑙 represents the ratio of the difference and walking distance 𝑎 of all passengers, where the difference is the average passenger walking distance of airline 𝑙𝑎 and all passengers. Subject to ∑𝑓𝑖 ∈𝐹 ∑𝑘≤𝑥,𝑔𝑘 ∈𝐺 𝑦𝑓𝑖 ,𝑔𝑘 (𝑁𝑓𝑎𝑖 + 𝑁𝑓𝑑𝑖 + 𝑁𝑓𝑚𝑖 ) ∑𝑓𝑖 ∈𝐹 (𝑁𝑓𝑎 + 𝑁𝑓𝑑 + 𝑁𝑓𝑚 ) 𝑖
𝑖
∑ 𝑦𝑓𝑖 ,𝑔𝑘 = 1,
𝑔𝑘 ∈𝐺
≥ 0.8,
(7)
𝑖
∀𝑓𝑖 ∈ 𝐹,
𝑦𝑓𝑖 ,𝑔𝑘 ∈ {0, 1} ,
∑
∑ (𝑦𝑓𝑖 ,𝑔𝑘 × 𝑦𝑓𝑗 ,𝑔𝑘 ) ,
𝑓𝑖 ∈𝐹 𝑗>𝑖,𝑓𝑗 ∈𝐹 𝑔𝑘 ∈𝐺
𝑎𝑓𝑗 − 𝑑𝑓𝑖 + (1 − 𝑧𝑓𝑖 ,𝑓𝑗 ) 𝑀 ≥ 𝑇,
𝑁𝑓𝑚𝑖 𝑆𝑔𝑚𝑘 ) ,
𝑁𝑓𝑎𝑖 𝑆𝑔𝑎𝑘
𝑙𝑎 ∈𝐿
𝑧𝑓𝑖 ,𝑓𝑗 = ∑
(8) (9)
𝑖 < 𝑗,
(10) (11)
𝑐𝑓𝑖 ≤ 𝑐𝑔𝑘 + (1 − 𝑦𝑓𝑖 ,𝑔𝑘 ) 𝑀,
(12)
𝑖, 𝑗, 𝑎, 𝑞, 𝑘, 𝑥 ∈ 𝑍+ .
(13)
Equation (7) is to restrain the proportion of passengers who are required to embark/disembark aircraft through aerobridges. Civil airport service quality, which was issued by the Civil Aviation Administration in 2006, requires that the number of passengers that embark/disembark through aerobridges should be above 80%. Equations (8) and (9) indicate that each flight has one and only one gate to be assigned. That is, for flight 𝑓𝑖 , in the gate set 𝐺, there is only one gate 𝑔𝑘 to make 𝑦𝑓𝑖 ,𝑔𝑘 = 1. Equation (10) is used to judge whether the two flights are assigned to the same gate. When 𝑦𝑓𝑖 ,𝑔𝑘 × 𝑦𝑓𝑗 ,𝑔𝑘 = 1, 𝑧𝑓𝑖 ,𝑓𝑗 = 1, it indicates that the later arrival flight 𝑓𝑗 and the front flight 𝑓𝑖 are arranged in the same gate; otherwise, 𝑧𝑓𝑖 ,𝑓𝑗 = 0. Equation (11) requires that the two flights which were assigned to the same gate should meet certain safety interval. According to (10) when 𝑧𝑓𝑖 ,𝑓𝑗 = 1, it needs to meet 𝑎𝑓𝑗 − 𝑑𝑓𝑖 ≥ 𝑇; the front and later flights should meet the minimum safety interval. When 𝑧𝑓𝑖 ,𝑓𝑗 = 0, the two flights are not assigned in the same gate; it need not meet safety interval. Therefore, value 𝑀, which is big enough, is introduced to ensure the inequality holds. Equation (12) means that the gate type should match the aircraft type. When 𝑦𝑓𝑖 ,𝑔𝑘 = 1, flight 𝑓𝑖 is assigned to gate 𝑔𝑘 ; it should meet 𝑐𝑓𝑖 ≤ 𝑐𝑔𝑘 . When 𝑦𝑓𝑖 ,𝑔𝑘 = 0, there is no relationship between flight 𝑓𝑖 and gate 𝑔𝑘 . Equation (13) is a positive integer constraint.
3. Simulations The decision variables in the gate assignment model are 0 and 1, belonging to 0-1 planning of integer programming problem. Due to nonlinear constraints involved in the model, the model is called integer nonlinear programming (INLP). The paper uses Lingo software to simulate and verify the model. The Global (global optimization algorithm) and Multistart (more initial point algorithm) built-in Lingo are specifically used to solve nonlinear programming (Scharge [18]). In addition, Lingo can be connected with EXCEL, database, and other software conveniently; it also can easily input and output the simulation results. Another important superiority of Lingo is convenient to describe large-scale optimization problems concisely and intuitionisticly. Therefore, the paper uses Lingo software to simulate and verify the effectiveness of the model. The simulation data of domestic flights to be assigned in a typical time interval (8:00–11:00) in a large airport is shown in Tables 1 and 2. The minimum time interval 𝑇 = 15 minutes; this is the time when the two flights are to be assigned to the same gate continuously. The constant value 𝑀 = 300.
4
Mathematical Problems in Engineering Table 1: Domestic flight to be assigned from 8:00 to 11:00.
Flight no. F101 F102 F103 F104 F105 F106 F107 F108 F109 F110 F111 F112 F113 F114 F115 F116
Type
Airline
Arr. time
Dep. time
Number of arr. passengers
Number of dep. passengers
Number of transit passengers
Total passengers
M M L M M L M S M M S M M L L M
A1 A2 A4 A3 A1 A2 A1 A2 A3 A4 A3 A2 A3 A2 A4 A2
08:00 08:15 08:30 08:45 09:00 09:10 09:15 09:30 09:40 10:00 10:05 10:20 10:30 10:35 10:55 11:00
08:55 09:20 09:50 09:55 10:10 10:30 10:20 10:15 10:40 11:30 10:55 11:20 11:25 11:55 12:00 11:50
35 129 132 97 106 206 72 41 128 154 49 143 98 246 182 118
48 142 136 101 89 189 96 46 114 146 63 136 92 238 168 115
174 36 169 86 128 64 72 98 29 65 32 40 108 63 57 20
257 307 437 284 323 459 240 185 271 365 144 319 298 547 407 253
Note: L, M, and S represent large, middle, and small aircrafts, respectively. A1∼A4 represent different airlines.
Table 2: Data of available gates. Gate no. G001 G002 G003 G004 G005 G006 G007 G008 G009 G010
Gate size
Distance to the baggage hall (unit: m)
Distance to the security check points (unit: m)
Distance to the transit counter (unit: m)
Average distance (unit: m)
Contact gate or remote stand
M L M M L S M L L L
150 240 220 190 135 530 520 400 920 1000
245 270 260 235 170 585 580 220 960 1100
215 245 230 210 115 440 425 230 975 1050
203.3 251.7 236.7 211.7 140.0 518.3 508.3 283.3 951.7 1050.0
C C C C C C C C R R
Note: L, M, and S represent large, middle, and small gates, respectively.
The paper uses Lingo 11.0 and selects Global Solver (Global optimization solve) and Global set strategy (Branching: Rel Violation; Box Selection: Worst Bound; Reformulation: High) to verify the effectiveness of models. The paper uses Lingo to simulate the results of the random assignment, the objective function (2) (𝑍1 optimal) and the objective function (3) (𝑍2 optimal), respectively. The simulation result is shown in Table 3, where 𝑍1 and 𝑍2 represent the value of the objective function (2) and the objective function (3), respectively. The smaller 𝑍1 is, the shorter passenger walking distance is. The smaller 𝑍2 is, the fairer between airlines is. 𝑄 represents the proportion of passengers embarking/disembarking through aerobridge (referring to passing rate); the larger 𝑄 is, the more passengers
embarking/disembarking through aerobridge are. 𝑆 represents the overall average passenger walking distance. 𝑆𝐴1–𝑆𝐴4 represents the average passenger walking distance of four airlines, respectively. 𝑆max represents the maximum difference of average passenger walking distance between airlines. (the unit of 𝑍1 , 𝑆, 𝑆𝐴1–𝑆𝐴4 , and 𝑆max is meters.) With Table 3 and Figures 1 and 2, we can draw the conclusions. (1) When 𝑍1 is optimal, the value of 𝑍1 is a minimum. It means that the total passenger walking distance is the shortest. The maximum value of 𝑄 is 1, which means the passing rate is 100%. But the difference of average passenger walking distance between four airlines is
Mathematical Problems in Engineering
5
Table 3: Comparison of simulation results between random assignment, optimization 𝑍1 , and optimization 𝑍2 . 𝑄 0.831 1.000 0.800
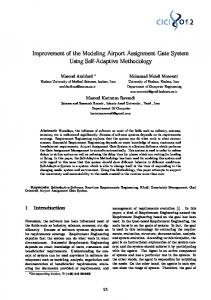
comparatively large and the value of 𝑍2 (0.299) is also the largest; it means that the ration between the average and total passenger walking distance of airlines is large; the largest ration is approaching 30%. (2) When 𝑍2 is optimal, the value of 𝑍2 is approximately zero and the average passenger walking distance of four airlines (Figure 2) is basically flat. That is, the gate assignment is the fairest. But the average passenger distance is 180.8 meters higher than the value of optimal 𝑍1 . and the passing rate is only 80% (𝑄 = 0.800), which is the lowest in the three simulation groups. (3) The three values of 𝑍1 , 𝑍2 , and 𝑄 in random gate assignment are relatively concentrated. But compared with the value of optimal 𝑍1 , the value of 𝑍1 in random gate assignment is high and the value of 𝑄 is low. Compared with the value of optimal 𝑍2 , the value of 𝑍2 in random gate assignment is high. And the difference of average passenger walking distance between airlines is the largest, which is 156.5 meters. The gate assignment schedule is much unfair to airline 𝐴 4 because the average walking distance is larger than other airlines distinctly. From the above simulation results, the three groups all have shortcomings. To find a set of ideal solution, the paper takes the objective function (2) as primary objective and transfers the objective function (3) into constraint. Assuming 𝑍2 ≤ 0.10 and 𝑍2 ≤ 0.20, the simulation results can be acquired (Table 4). According to Table 4 and Figures 3 and 4, when the objective function (2) is the objective and 𝑍2 ≤ 0.10, all the indexes of simulation are in the state of ideal according to the five group simulation results. Compared with the random gate assignment, the simulation result of 𝑍2 ≤ 0.10 is as follows. (1) The total walking distance of passengers is 1,368,320 meters and decreases by 34.5%; (2) the passing rate is 96.4% and improves by 13.3%; (3) the total average passenger walking distance is 268.5 meters and decreases by 141.6 meters; (4) the simulation results show that it is relatively fair among airlines. The largest difference of average walking distance among airlines is only 20.3 meters; it is more inferior to the random gate assignment. Flight Gantt chart of the random gate assignment and the situation of 𝑍2 ≤ 0.10 are shown in Figures 5 and 6. Distribution of passengers and the average distance of gate are shown in Figure 7. It is convenient for passengers to embark/disembark the aircraft through aerobridge because the distance is close and passengers will not be influenced by weather. The average distance from gate to baggage hall, security check, and transit
𝑆 410.1 244.2 425.0
𝑆𝐴1 351.1 206.9 423.8
𝑆𝐴2 351.9 243.6 424.4
𝑆𝐴3 461.2 317.3 426.1
𝑆𝐴4 507.6 210.2 425.7
𝑆max 156.5 110.4 2.3
×105 25
1.20
20
1.00 0.80
15
0.60 10
0.40
5
0.20
The ratio of distance difference and passing rate
𝑍2 0.238 0.299 0.003
The total walking distance of passengers (m)
𝑍1 2089750 1244430 2165555
0.00
0 Random assignment
Z1 optimal
Z2 optimal
Z1 Z2 Q
Figure 1: Comparison of 𝑍1 , 𝑍2 , and 𝑄.
600.0 500.0 Distance (m)
Results Random assignment 𝑍1 optimal 𝑍2 optimal
400.0 300.0 200.0 100.0 0.0 Random assignment SA1 SA2 SA3
Z2 optimal
Z1 optimal
SA4 S Smax
Figure 2: Comparison of 𝑆 and 𝑆𝐴1–𝑆𝐴4 .
counter is shorter; the total walking distance of passengers assigned to the gate is shorter. Thus the passenger will feel comfortable. We can draw the conclusions from Figure 5 to Figure 7: (1) the number of flights assigned to the remote stands (G009, G010) is only one, and this gate assignment schedule can improve the passing rate; (2) two flights are reduced to be assigned to gate which is near the remote stand; one flight is added to be assigned to G001, G003, G004, and G008 gate, respectively; (3) the gate, where the average walking distance is short, is assigned efficiently. Making
6
Mathematical Problems in Engineering Table 4: Comparison of simulation results under five different conditions. 𝑍1 2089750 1244430 2165555 1368320 1272690
𝑍2 0.238 0.299 0.003 0.041 0.199
𝑄 0.831 1.000 0.800 0.964 1.000
×105 25
1.20
20
1.00
𝑆 410.1 244.2 425.0 268.5 249.7
𝑆𝐴1 351.1 206.9 423.8 278.1 204.0
0.40
F114
F102 F110
G005
F113
F105
G006
F111
G007
F116
F107
F101
G008
F106
G009
F108
G010
F109
8:00
8:30
9:00
F115
9:30 10:00 10:30 11:00 11:30 12:00 Time
Figure 3: Comparison value of 𝑍1 , 𝑍2 , and 𝑄 in five groups.
Figure 5: The flight Gantt chart of random gate assignment.
G001
600.0 500.0
F110
F101
G004 Gate
300.0 200.0
0.0
G008
SA4 S Smax
Figure 4: Comparison value of 𝑆, 𝑆𝐴1–𝑆𝐴4 , and 𝑆max in five groups.
F114
F105
G006 G007
Random Z1 optimal Z2 optimal Z1 ≤ 0.10 Z2 ≤ 0.20 assignment
F112
F104
G005
100.0
F115
F106
G003 400.0
F116
F109
F102
G002
SA1 SA2 SA3
𝑆max 156.5 110.4 2.3 20.5 95.3
F112
G004
Z2 ≤ 0.20
0.00 Z1 ≤ 0.10
0 Z2 optimal
0.20 Z1 optimal
5
𝑆𝐴4 507.6 210.2 425.7 257.6 299.3
F103
G003
Gate
0.60 10
The ratio of distance difference and passing rate
0.80
15
𝑆𝐴3 461.2 317.3 426.1 275.6 222.5
F104
G002
Z1 Z2 Q
Distance (m)
𝑆𝐴2 351.9 243.6 424.4 267.7 252.0
G001
Random assignment
The total walking distance of passengers (m)
Results Random assignment 𝑍1 optimal 𝑍2 optimal 𝑍2 ≤ 0.10 𝑍2 ≤ 0.20
F111 F107 F113
F103
G009
F108
G010 8:00
8:30
9:00
9:30 10:00 10:30 11:00 11:30 12:00 Time
Figure 6: The flight Gantt chart of 𝑍2 ≤ 0.10.
4. Conclusions effective use of a gate can reduce the walking distance and improve the service level of passengers. In summary, the simulation optimization results can not only reduce the average passenger walking distance effectively and improve passing rate, but also reduce the difference of average walking distance of passengers among airlines and enhance the overall passenger service quality of airports and airlines.
The paper presents a new idea for the airport gate assignment problem. Unlike the previous researches, it takes the restraint of passenger passing rate and airlines’ fairness into account under the premise of airport safety operation. Combining with the objective of minimizing the whole passengers’ walking distances, the paper builds a multiobjective optimization model of gate assignment. Lingo software is used to verify the effectiveness of model by simulating a large airport gate
7
1200
1200
1000
1000
800
800
600
600
400
400
200
200
0 G010
G009
G008
G007
G006
G005
G004
G003
G002
G001
0
Average distance of gate (unit: m)
Number of passengers (person)
Mathematical Problems in Engineering
Gate Random assignment Z2 ≤ 0.10 Average distance
Figure 7: Distribution of passengers and the average distance of gate.
assignment. According to the test results, we can draw some conclusions. (1) The assignment can ensure the passengers passing rate by setting (7). (2) The two objectives are interactional between each other. And decision makers can get a set of suitable results by adjusting the value range of the second objective. (3) Compared to the random assignment, this model can reduce the whole passengers’ walking distances and improve the fairness between airlines at the same time. (4) The research scope of the paper is only part of the domestic flights. How to combine with international flights and effective resource schedule should be further researched.
Acknowledgments This work was supported by the National Natural Science Foundation of China and Civil Aviation Administration of China (no. U1333117), China Postdoctoral Science Foundation (no. 2012M511275), and the Fundamental Research Fund for the Central Universities (nos. NS2013067, NN2012019, and NS2012115).
References [1] J. P. Braaksma, “Reducing walking distance at existing airports,” Airport Forum, no. 7, pp. 135–142, 1977. [2] O. Babic, D. Teodorovic, and V. Tosic, “Aircraft stand assignment to minimize walking,” Journal of Transportation Engineering, vol. 110, no. 1, pp. 55–66, 1984. [3] R. S. Mangoubi and D. F. X. Mathaisel, “Optimizing gate assignments at airport terminals,” Transportation Science, vol. 19, no. 2, pp. 173–188, 1985.
[4] S. Yan and C.-M. Huo, “Optimization of multiple objective gate assignments,” Transportation Research Part A, vol. 35, no. 5, pp. 413–432, 2001. [5] A. Bolat, “Procedures for providing robust gate assignments for arriving aircrafts,” European Journal of Operational Research, vol. 120, no. 1, pp. 63–80, 2000. [6] S. Yan, C.-Y. Shieh, and M. Chen, “A simulation framework for evaluating airport gate assignments,” Transportation Research Part A, vol. 36, no. 10, pp. 885–898, 2002. [7] Y. Cheng, “Solving push-out conflicts in apron taxiways of airports by a network-based simulation,” Computers and Industrial Engineering, vol. 34, no. 2, pp. 351–369, 1998. [8] A. Haghani and M.-C. Chen, “Optimizing gate assignments at airport terminals,” Transportation Research Part A, vol. 32A, no. 6, pp. 437–454, 1998. [9] J. Xu and G. Bailey, “The airport gate assignment problem: mathematical model and a tabu search algorithm,” in Proceedings of the 34th Annual Hawaii International Conference on System Sciences, pp. 1–10, January 2001. [10] C.-M. Pintea, P. C. Pop, C. Chira, and D. Dumitrescu, “A hybrid ant-based system for gate assignment problem,” in Proceedings of the 3rd International Workshop on Hybrid Artificial Intelligence Systems, vol. 5271 of Lecture Notes in Computer Science, pp. 273–280, Burgos, Spain, 2008. [11] H. Ding, A. Lim, B. Rodrigues, and Y. Zhu, “Aircraft and gate scheduling optimization at airports,” in Proceedings of the 37th Hawaii International Conference on System Sciences, pp. 1185– 1192, January 2004. [12] H. Ding, A. Lim, B. Rodrigues, and Y. Zhu, “The overconstrained airport gate assignment problem,” Computers and Operations Research, vol. 32, no. 7, pp. 1867–1880, 2005. [13] Y. Zhu, A. Lim, and B. Rodrigues, “Aircraft and gate scheduling with time windows,” in Proceedings of the 15th IEEE International Conference on Tools with Artificial Intelligence, pp. 189– 193, Sacramento, Calif, USA, November 2003. [14] D. Wei and C. Liu, “Optimizing gate assignment at airport based on genetic-tabu algorithm,” in Proceedings of the IEEE International Conference on Automation and Logistics (ICAL ’07), pp. 1135–1140, Jinan, China, August 2007. [15] D.-X. Wei and C.-Y. Liu, “Fuzzy model and optimization for airport gate assignment problem,” in Proceedings of the IEEE International Conference on Intelligent Computing and Intelligent Systems (ICIS ’09), pp. 828–832, Shanghai, China, November 2009. [16] X.-B. Hu and E. Di Paolo, “A ripple-spreading genetic algorithm for the airport gate assignment problem,” in Proceedings of the IEEE Congress on Evolutionary Computation (CEC ’09), pp. 1857–1864, Trondheim, Norway, May 2009. [17] B. Maharjan and T. I. Matis, “Multi-commodity flow network model of the flight gate assignment problem,” Computers & Industrial Engineering, no. 63, pp. 1135–1144, 2012. [18] L. Scharge, Optimization Modeling with LINGO, LINDO Systems Inc., 2004.
Advances in
Operations Research Hindawi Publishing Corporation http://www.hindawi.com
Volume 2014
Advances in
Decision Sciences Hindawi Publishing Corporation http://www.hindawi.com
Volume 2014
Journal of
Applied Mathematics
Algebra
Hindawi Publishing Corporation http://www.hindawi.com
Hindawi Publishing Corporation http://www.hindawi.com
Volume 2014
Journal of
Probability and Statistics Volume 2014
The Scientific World Journal Hindawi Publishing Corporation http://www.hindawi.com
Hindawi Publishing Corporation http://www.hindawi.com
Volume 2014
International Journal of
Differential Equations Hindawi Publishing Corporation http://www.hindawi.com
Volume 2014
Volume 2014
Submit your manuscripts at http://www.hindawi.com International Journal of
Advances in
Combinatorics Hindawi Publishing Corporation http://www.hindawi.com
Mathematical Physics Hindawi Publishing Corporation http://www.hindawi.com
Volume 2014
Journal of
Complex Analysis Hindawi Publishing Corporation http://www.hindawi.com
Volume 2014
International Journal of Mathematics and Mathematical Sciences
Mathematical Problems in Engineering
Journal of
Mathematics Hindawi Publishing Corporation http://www.hindawi.com
Volume 2014
Hindawi Publishing Corporation http://www.hindawi.com
Volume 2014
Volume 2014
Hindawi Publishing Corporation http://www.hindawi.com
Volume 2014
Discrete Mathematics
Journal of
Volume 2014
Hindawi Publishing Corporation http://www.hindawi.com
Discrete Dynamics in Nature and Society
Journal of
Function Spaces Hindawi Publishing Corporation http://www.hindawi.com
Abstract and Applied Analysis
Volume 2014
Hindawi Publishing Corporation http://www.hindawi.com
Volume 2014
Hindawi Publishing Corporation http://www.hindawi.com
Volume 2014
International Journal of
Journal of
Stochastic Analysis
Optimization
Hindawi Publishing Corporation http://www.hindawi.com
Hindawi Publishing Corporation http://www.hindawi.com
Volume 2014
Volume 2014