Multiple Hierarchical Classification of Free-Text Clinical Guidelines Robert Moskovitch, Shiva Cohen-Kashi, Uzi Dror, Iftah Levy, Amit Maimon and Yuval Shahar Medical Informatics Research Center Department of Information Systems Engineering, Ben Gurion University, Beer Sheva, Israel
Abstract Manual classification of free-text documents within a predefined hierarchy is highly time consuming. This is especially true for clinical guidelines, which are often indexed by multiple indices. We present an approach to automated classification of clinical guidelines into predefined hierarchical conceptual categories, based on supervised learning. The hierarchical structure of the concepts is exploited, in the training stage, in order to overcome the low number of training examples. The classification task is broken into a set of intermediate classifications, throughout the hierarchy. We use a vector-space representation in order to represent each guideline and the hierarchical concepts; classification is based on applying a similarity function at each level. Several evaluation measures are suggested, based on the intended use of the hierarchy; these measures correspond to different parameters of the classification algorithm. Preliminary results are encouraging; a formal evaluation, including multiple training methods and evaluation measures, has been performed. Keywords: Hierarchical Text Categorization, vector space model, information retrieval, clinical guidelines, classification.
Introduction Recent trends in knowledge management highlight the interest in organizing sources of knowledge or documents as hierarchies of concepts or categories. Web directories are a well known example. Web pages are classified with respect to a predefined set of categories organized into concepts hierarchy. Well known examples of such knowledge management include Google , Yahoo! and the Open Directory Project . A hierarchical knowledge organization is defined by two components: a hierarchy of categories, implemented in a tree-like structure, and a collection of information items; we will focus on free-text documents. Documents can be classified by one or more concepts at different levels of the hierarchical concepts structure. Documents are classified mainly manually by experts or by using scripts that represent classification heuristics; these are prepared manually as well, and are hard to define. Another option is automated text classification using machine learning techniques. Much was done in the field of flat Text Categorization [1], while not enough in the field of Hierarchical Text Categorization. We will describe an automated, ma-
chine learning approach to document classification, focused on the domain of clinical practice guidelines.
Clinical Practice Guidelines and The DeGeL Architecture Clinical practice guidelines (CPGs) are an increasingly common and important format in clinical medicine for prescribing a set of rules and policies that a physician should follow. According to studies, clinical guidelines improve medical practice. They improve the quality (and possibly also the cost-efficiency) of care in an increasingly complex health care environment [2]. To support tasks such as the runtime application of a guideline, it is often important to be able to quickly retrieve a set of guidelines most appropriate for a particular patient or task. Correctly classifying the guidelines, along as many semantic categories as relevant (e.g., therapy modes, disorder types, sighs and symptoms), supports easier and more accurate retrieval of the relevant guidelines. This classification, however, is mostly manual. Electronic CPG repositories, such as the National Guideline Clearinghouse (NGC) and others [3,4] provide hierarchical access to electronic CPGs in a free-text or semi-structured format. It would be best if automated support could be offered to guideline-based care at the point of care. Thus, there is a global effort to automate the representation and application of clinical guidelines [5]. To gradually convert CPGs into a machine executable representation in a target ontology, we have developed a webbased, distributed architecture, the Digital Electronic GuidelinE Library, (DeGeL) [6,7], and a set of software tools for incremental conversion of CPGs, through semi-structured and semiformal representations, into one or more formal guidelinespecification representations. The editing tools, such as for semantic classification of the whole guidline, and semantic markup of parts of its text by the knowledge roles of the target ontology, are intended for a collaborative effort among medical domain experts and knowledge engineers. Classifying Guidelines in the DeGeL Library To classify guidelines, mainly for purposes of efficient retrieval, seven semantic axes are implemented in DeGeL. Each Axis represents a major clinical aspect. Axes include: (1) symptoms and signs (e.g., hypertension), (2) diagnostic findings (e.g., blood cells count, electrocardiogram), (3) disorders (e.g., ischemic heart disease, malignant neoplasm), (4) treatments (e.g., antibiotic therapy , abdominal surgery ), (5) body systems and regions, or a
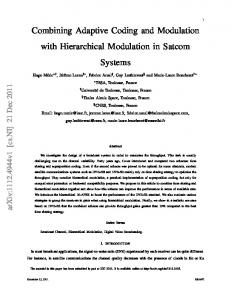
relevant CPG classification (6) guideline types (e.g., screening, prevention), and (7) guideline specialties (e.g., radiology, internal medicine). Each semantic axis is implemented as a hierarchical structure of sub axes, representing concepts. Each CPG is indexed along one or more semantic axes, such as Disorders (e.g., malignant skin melanoma), Guideline specialties (e.g., oncology), etc. Figure 1 shows an example of a hierarchical concepts structure, where the main concept is Mental Disorders. There are two sub-concepts: Anxiety Disorders and Dissociative Disorders. Each sub-concept may be split into more sub-concepts which represent a more detailed division of the concept. (A semantic indexing structure exists, albeit in a less developed form, also in the NGC repository, using two main Axes based on the inherently hierarchical MeSH classification [8]: Disorders and Therapies.) Currently, CPGs in DeGeL are classified manually by medical experts, using the IndexiGuide tool [6]. Since classification is a very time consuming and expensive task, there is an evident need for an automated classification tool that will make accurate classification faster and cheaper. Another advantage achieved by using automatic classifications is a coherent classification, while in manual classification it may vary based on the subjective classifications of the different classifiers.
Recent experiments with Vaidurya have shown, as expected, a significant improvement when combining the concept-based search with the free-text search, compared to using only the freetext search [10]. Thus, classification of clinical guidelines is a worthwhile effort, and its automation, or at least support of a semi-automated process within the IndexiGuide tool, would be of great help to both medical-expert knowledge editors and clinical providers at the point of care, supporting both easy classification by the expert and accurate retrieval of relevant guidelines by the care providers.
Hierarchical Text Classification A wide range of statistical and machine learning techniques have been applied to text categorization, including multivariate regression models [11], nearest neighbor [15], Probabilistic Bayesian models [13], decision trees [13], neural networks [14] and support vector machines [15]. These techniques are all based on having some initial pre-labeled documents, which are used to train an automatic categorical-classification model. Although many real world classification systems have complex hierarchical structure, few learning methods capitalize on this structure. Most of the approaches above ignore the hierarchical structure and treat each category or class separately, thus in effect 'flattening' the hierarchical structure. A separate binary classifier is learned to distinguish each class from all other classes. The binary classifiers can be considered independently, so an item is classified into none, one, or more than one category. Alternatively, they can be considered as a multiple-class problem, in which the best matching category is chosen. Such approaches work well on small problems, but they are likely to be difficult to train when there is a large number of concepts and very large number of features, as is common in text representation.
Figure 1- Part of a hierarchical conceptual structure of the 'Mental Disorders' class
In the case of a hierarchical conceptual structure, it is common to decompose the problem into a set of small classification problems, such that one first classifies over concepts at the top level, which are less specific, and then over lower levels, drilling down through the classified path. This approach is similar to decision tree generation.
The Vaidurya Search Engine
However, we suggest an approach in which the decision is not only made separately for each node (concept class), but also takes into account the pattern of decisions in the classified path.
One of the DeGeL architecture's tools is Vaidurya, a conceptbased, context-sensitive search and retrieval tool for clinical guidelines [9]. Vaidurya uses three types of search: (1) free-text search, using standard key terms; (2) concept-based search, which uses the semantic–axes indexing structure, and (3) contextsensitive search, which exploits the semantic markup performed on guidelines in the DeGeL library. Context-sensitive search focuses on searching for key terms only within the scope of a particular ontology-specific semantic knowledge role, such as "eligibility conditions". Thus, part of the Vaidurya search model includes optional specification, within the query, of one or more semantic axes or subaxes, and logical operators defining the relations between the axes. The concept search query is thus a collection of constraints represented by chosen sub axes and the logical relations between them: conjunction or disjunction.
Materials and Methods Text Representation and Preprocessing Guideline documents are represented using the vector space model [16], in which each document is represented by a bag-ofwords. A vector of terms is created, such that each index in the vector represents the term frequency in the document, commonly known as term-frequency (TF). Equation 1 shows the definition of tf. Another common representation is TF-inverse-documentfrequency (TFIDF), which combines the frequency of a term in the document and in the documents collection as well. Equation 2 shows the definition of tfidf, given the TF value of the term, N – the number of documents in the collection, and n – the number of documents in which the term appears.
TF
term frequency max(term frequency in document ) TFIDF TF * log( N / n)
(1) (2)
Each document in the collection goes through an indexing process. Document terms are extracted. Common terms, for example "and, not, the," also known as stop-words, are removed and each term is stemmed to its root, using the Porter Stemming Algorithm [17]. The stopping and stemming processes help in decreasing the amount of terms in the collection, an aspect that we will be discussing again later in this paper.
Feature Selection The features in our case are the document terms. The Feature Selection operation refers to the process where the dimensions (number of terms in the indexed document collection) are reduced and only the contributing terms are included in the classification task. This process is essential, since in the textual domain the number of dimensions is very big (many thousands). The dimensional reduction process starts with the stopping and stemming procedure which was described before. In this study we are using two feature selection techniques. Several of these were adjusted to capitalize on the hierarchical structure of the classes (concepts). Using the Term Distribution As a general heuristic, we are assuming that features with very high or very low presence in the document collection will not contribute to the classification task, we remove these terms, thus reducing the dimensions of the collection. Term presence is represented using the IDF value of each term in the collection, or its averaged (over all documents) TFIDF value. The TFIDF is used twice in our approach, once here in the feature selection process and then again in the representation of the CPGs and concepts centroids values. The terms are sorted according to their frequency value, and then multiplied by their relative rank when ordered by frequency. Terms with a high frequency value will have a low rank. Terms with computed value above and bellow a given threshold are removed.
also to the documents classified to the concept descendents in the hierarchy. We call this measure HIG.
The Training method The model we present implements a supervised learning technique. In the training process, each node's vector, in the hierarchical conceptual structure, is computed based on the CPGs classified by the node. Each node has n CPGs classified directly by this node, and m sub-nodes. The total of CPGs classified along a specific node in the hierarchical structure is the sum of n and the number of CPGs classified by each one of its m sub-nodes and their descendents. Each node is represented by a Terms Vector c , where each index represents the term frequency. A concept vector is a linear combination of all the CPGs, which are represented by a vector of the document terms and their frequencies, classified by that concept. We implemented two training approaches: the first is bottom-up, which is a recursive process starting from the hierarchical concept leaves. For each leaf node, in the hierarchical structure, a centroid is built based on the CPGs classified by it; at higher levels the centroid is built based on the classified CPGs and the sub nodes centroids. Equation 4 shows how the concept vector is calculated in the bottom-up technique, based on the average of the n CPGs classified by the concept, which are represented by a vector d , and its m sub-nodes vectors gi (with yi, number of documents classified by the sub-node i), multiplied by the x weight coefficient. The weight x reduces the influence of the sub concept vectors. n
m
d i ( t1 ... t k ) C ( t1 ... t k )
IG
c
t
P(t , c) * log
n
(3)
Hierarchical Information gain (HIG) Since we are dealing with a hierarchical conceptual structure, we are investigating an approach in which the hierarchical structure is considered. The IG of each feature x, is calculated not only for the documents classified directly to the given concept-class C, but
m 1
1
yi
(4)
The other training approach is top-down. In this approach each CPG vector updates the nodes in its classifications paths. Equation 5 shows the calculation of a centroid C by its classified CPGs. The difference in these two approaches is that, while in the top-down approach each CPG classified by a node is represented once, in the bottom-up approach a CPG is represented in the centroid as many times as is the number of sub nodes by which it is classified. n
P (t , c) P(t ) * P(c)
y i g i ( t1 ... t k )
1
Using the Information Gain Measure Information gain (IG) is a common measure [18], which assesses the entropy level of a feature (term) in the collection. Features with a low IG value are removed. Equation 3 shows the IG value calculation, where c ranges over the classes and ranges over and , referring to whether the term , under consideration, is present in a document or not.
X *
C ( t 1 ... t k )
d i ( t 1 ... t k )
1
n
(5)
When the nodes vector training process is completed, two other parameters are calculated. µ - average of the similarities of each one of the CPGs, classified along a given node, with the node centroid. Equation 6 shows how the similarity between two given vectors C and d is computed, the similarity results with a positive value which represents the angle between the two vectors in the collection terms dimensions. Equation 7 shows how µ is calculated, for a given concept centroid C and a set of m documents. The other parameter calculated is which represents the standard deviation of the similarities of the classified CPGs vectors, from the node centroid, as can be seen in Equation 8.
Sim(C , d )
N
C d
n 1
|C| |d |
N 2 n 1 n
c
m
µ(C) m 2
(C )
(c n d n ) N n 1
d n2
(6)
Sim(C , dj )
j 1
m
(7)
( Sim(C , d j ) µ (C )) 2
j 1
m
(8)
At the end of the training process, we have essentially computed a predefined hierarchical conceptual structure, in which each one of the nodes is represented by a centroid, the node's classified CPGs, the similarities average µ and the similarities standard deviation . These parameters are then used in the classification process.
The Classification method The classification task is to classify a new CPG by one or more concepts within the predefined concept structure. In our model, we decompose the problem into small problems, using the hierarchical structure. At each node in the concept tree a classification decision is taken. The decision may include one or more subnodes, depending on the similarity between the new CPG vector and each concept vector. The similarity of the new CPG is calculated in reference to the concept centroid as shown in Equation 7. The decision whether to classify the new CPG to a concept depends on whether the similarity was higher than the concept Threshold. Each concept has a threshold that defines whether a vector belongs to this concept, based on the similarity measure, Equation 6. Equation 9 shows the definition of a Concept Threshold, which is the µ, representing the common similarity in the specific concept population and the representing the standard is multiplied in a constant k, deviation in the said population. defining the Threshold accuracy level. The bigger the value of k, the lower becomes the Threshold, which means more CPGs, not necessarily relevant will be classified, which may increase the error rate.
Treshold (Ci )
µ
k
(9)
At each concept a hypothesis is being examined, whether the new CPG belongs to it or not as defined in Equation 10.
Ho : Sim(dj , Ci ) H 1 : Otherwise
sub-concepts of the hierarchy, in case no one of the sub-concepts exams resulted in a positive test. When the Hypothesis test doesn’t evaluate as True in a specific node, we consider one of two approaches: the Conservative policy is BestFit – the node, along the classified path from the root, with the highest similarity value will be chosen as the classified node. The Aggressive policy is ParentFit – the parent of the node is chosen as a classification. In the ParentFIt the classification is greedy and will drill down in the concepts hierarchy till the hypothesis test fails. In the BestFIt it stops at the node where the highest similarity value was achieved. At the end of the classification process, the new CPG will have one or more classifications which can be described as paths in the concept tree.
ConfidenceLevel (Ci ) (10)
Initially, the similarity of the new CPG, represented by a vector of terms, is computed relative to all the concepts trees' roots centroid. If the classification hypothesis criterion is fulfilled, we examine each selected sub-concepts tree and the same classification operation will be made, drilling down from the root to the leaves. The classification process may be stopped also at the intermediate
The Test Collection We are using the NGC CPGs collection in order to evaluate our suggested approach. The CPGs in the NGC hierarchy are classified along two hierarchical concept trees, Disorders and Therapies. Each concept tree has roughly 1,000 unique concepts; in some regions the concepts trees are 10 levels deep, but the mean is 4 to 6 levels. There are 1136 CPGs, each CPG may have multiple classifications by both concept trees and within the same tree, at different nodes, not only leaves. CPGs have a mean of 10 classifications; there exist CPGs classified by 90 concepts.
Evaluation Measures Various performance measures within text classification exist, covering different aspects of the task. This section covers the most used performance measures, their benefits and drawbacks. Precision and Recall Performance within text classification is usually given in terms of precision and recall, as in information retrieval. A classifier makes a binary decision for each pair .Each decision has four possible outcomes with respect to the correct classification and can be outlined using a contingency table. Let TPi be the set of documents that were classified correctly to Ci, FPi be the set of that were wrongly classified to Ci, FNi be the set of documents that were wrongly rejected and TNi be the set of documents correctly rejected. Pri is the Precision and Rei is the Recall of a given class i, calculated as shown in equation 11.
Pr i Re i
| TPi | | TPi | | FPi | | TPi | | TPi | | FNi |
(11)
Precision and recall are class related measurements, but the same can be computed from the documents point of view. Instead of how many documents classified to a class, we arechecking how many classes were classified to the document. These measures have to be averaged somehow for obtaining a global measurement. Two different methods are generally used: Micro averaging The Precision and Recall of the documents is averaged, this measure gives us the indication of the accuracy of the classification from the document point of view.
Macro averaging Precision and recall are evaluated for each class and averaged afterward, this gives us the accuracy of the classification from the class or concept point of view. Hierarchical Micro and Macro averages Similar to the approach we used in the feature selection where we considered the hierarchy structure in the HIG. We calculate the Micro and Macro averages with the hierarchy relation. In this approach each nodes expected classified documents are also its descendents classified documents. Coverage Other than precision and recall, another measurement can be calculated which is, as the previous ones, based on the correct classifications verses the incorrect ones. This measurement is called Coverage. Unlike the previous measures, Coverage takes into consideration the hierarchical structure of the categories. In that measure we represent the real multiple classifications of a document in the concepts tree as a sub tree - representing the real classifications paths. The resulted multiple classifications, given by the classifier are represented as another sub tree. The coverage measures the similarity between these two sub trees, which optimally should be the same. The coverage measures the relation between the categories along the paths where the document is assigned to (symbolized by agd, as in "assigned") , and the ones along the paths where the correct classifications are (symbolized by lbd, as in "labeled"), as can be seen in Equation 12.
P( Coverage(d )
Ci)
P(
Ci d .agd
P(
Cj )
P(
Ci d .agd
Cj ) Cj d .lbd
Measure
(12)
After the coverage is calculated for each document, the general coverage computed as an average of all the documents coverage values.
Results
HIG
WD(Idf)
Basic Micro Precision
17.10%
14.63%
Basic Micro Recall
51.39%
36.48%
Hierarchical Micro Precision
47.36%
45.53%
Hierarchical Micro Recall
63.64%
49.18%
Coverage Average
33.94%
25.69%
Table 2 shows a comparison of the results of the different feature selection methods: Hierarchical IG and the Word Distribution based on IDF values. The hierarchical information gain method performed significantly better, compared to the word distribution method, for selection of the classification features. In fact, it produced close to 50% Hierarchical Micro Precision and more than 60% Hierarchical Macro Recall. Table 3 shows the performance of the training options offered when building the tree concepts vectors. The top-down and bottom-up training methods performed almost equally, although the top-down method performed consistently better, and achieved more than 55% Hierarchical Micro Precision. Table 3 – Training Methods Measure
Cj d .lbd
Ci)
Table 2 – Feature selection methods
TopDown
BottomUp
Basic Micro Precision
12.98%
8.58%
Basic Micro Recall
23.43%
20.72%
Hierarchical Micro Precision
55.76%
51.73%
Hierarchical Micro Recall
29.27%
25.63%
Coverage Average
13.05%
10.40%
Discussion
We ran multiple experiments in different modes in order to compare the term-representation options, feature selection methods and classifications approaches. Table 1 - Terms Representation Measure
Tf
TfIdf
Basic Micro Precision
3.41%
8.50%
Basic Micro Recall
33.77%
23.42%
Hierarchical Micro Precision
17.23%
42.87%
Hierarchical Micro Recall
44.45%
37.58%
Table 1 shows the results comparison of performance between the TF and TFIDF. The TF-IDF term representation significantly improved precision relative to the TF method, while slightly reducing recall.
Classification of guidelines in clinical medicine is highly significant for multiple clinical tasks. We presented a complete framework that manages this process. A unique aspect of the domain is the necessity for a multiple-classification approach. There is a marked influence of the intended user and guidelinerelated task on the relevant evaluation measure (and thus, on the policy chosen during classification) that would be considered optimal for a guideline-classification system. A conservative approach such as best-fit, in which the node with the highest confidence along the classification path is selected by the classification process, is best for reducing the risk of incorrect classification, while still supporting the recursive search and retrieval performed by Vaidurya for clinical end users. However, a risky aggressive approach, such as parent-fit, in which the furthest node along the classification that passed the threshold is chosen, might be better for a medical expert or knowledge engineer working with the IndexiGuide classification tool; the expert needs a suggestion for the most specific classification(s) possible, and can always correct a wrong suggestion by going up a level if needed.
Acknowledgments This research was supported in part by NIH award LM-06806. The partial support for this research by the Ira Center for Business, Technology & Society, Ben Gurion University, is gratefully acknowledged
References [1] Fabrizio Sebastiani, Machine learning in automated text categorization, ACM Computing Surveys, 34(1):1-47, 2002. [2] Grimshaw JM, Russel IT. Effect of clinical guidelines on medical practice: A systematic review of rigorous evaluations. Lancet 1993: 342: 1317–1322. [3] National Guideline Clearinghouse (www.ngc.org) [4] Guideline International Network (www.g-i-n.net) [5] M. Peleg, S. Tu, J. Bury, P. Ciccarese, J. Fox, R. A. Greenes, R. Hall, P. D. Johnson, N. Jones, A. Kumar, S. Miksch, S. Quaglini, A. Seyfang, E. H. Shortliffe & M. Stefanelli. Comparing Computer-Interpretable Guideline Models: A CaseStudy Approach. JAMIA, vol. 10, No. 1, Jan-Feb 2003, pp. 52-68. [6] Shahar Y., Young O., Shalom E., Mayaffit A., Moskovitch R., Hessing A., and Galperin M. (2003a). DEGEL: A hybrid, multiple-ontology framework for specification and retrieval of clinical guidelines. Proceedings of the 9th Conference on Artificial Intelligence in Medicine—Europe (AIME) ‘03, Protaras, Cyprus. [7] Shahar Y, Shalom E., Mayaffit A., Young O., Galperin M., Martins S.B., and Goldstein, M.K. (2003b). A distributed, collaborative, structuring model for a clinical-guideline digital-library. Proceedings of the 2003 AMIA Annual Fall Symposium, Washington, DC. [8] http://www.nlm.nih.gov/mesh/meshhome.html [9] Moskovitch R., Hessing A. and Shahar Y. Vaidurya – A Concept-Based, Context-Sensitive Search Engine For Clinical Guidelines, Proceedings of Medinfo-2004, San Francisco, CA, USA. [10](ISE-TR-314/2004) R. Moskovitch and Y. Shahar , Effective Concept-Search in Hierarchical Organized Library , Department of Information Systems Engineering, Ben Gurion University (2004). [11]Fuhr, N. Hartmanna, S., Lustig, G., Schwantner, M., and Tzeras, K. Air/X – A rule-based multi-stage indexing system for lage subject fields. Proceedings of RIAO '91, 606-623, 1991 [12]Yang, Y. Expert network: Effective and efficient learning from human decisions in text categorization and retrieval. Proceedings of the 17th Annual International ACM SIGIR Conference on Research and Development in Information Retrieval (SIGIR '94),13-22, 1994. [13]Lewis, D.D. and Ringuette, M. A comparison of two learning algorithms for text categorization. Third Annual Symposium on Document Analysis and Information Retrieval (SDAIR '94), 81-93, 1994.
[14]Weigend, A.S., Wiener, E.D. and Pedersen, J.O. Exploiting hierarchy in text categorization. Information Retrieval, 1(3), 193-216,1999. [15]Joachims, T. Text categorization with support vector machines: Learning with many relevant features. Proceedings of the European Conference on Machine Learning (ECML '98), 1998. [16]G. Salton, A. Wong, and C.S. Yang. A vector space model for automatic indexing. Communications of the ACM, 18:613 620, 1975 [17]Porter, M.F., 1980, An algorithm for suffix stripping, Program, 14(3) :130-137. [18]Yang, Y. and Pederson, J.(1997). A comparative study on feature selection in text categorization. In International Conference on Machine Learning (ICML). Address for correspondence:
[email protected] Medical Informatics Research Center Department of Information Systems Engineering, Ben Gurion University of the Negev, Israel. P.O.B. 653, Beer Sheva 84105, Israel.