Jul 13, 2016 - of each bag are known, i.e. labels for the instance are missing. That is, we ..... The red line is the mean deviance and the blue lines are bounds.
Multiple-Instance Logistic Regression with LASSO Penalty Ray-Bing Chen∗, Kuang-Hung Cheng†, Sheng-Mao Chang∗, Shuen-Lin Jeng∗, Ping-Yang Chen∗, Chun-Hao Yang∗, and Chi-Chun Hsia†
arXiv:1607.03615v1 [stat.ML] 13 Jul 2016
∗
Department of Statistics National Cheng Kung University No. 1, University Road, Tainan, Taiwan † Industrial Technology Research Institute ITRI Southern Region Campus Tainan, Taiwan Abstract—In this work, we consider a manufactory process which can be described by a multiple-instance logistic regression model. In order to compute the maximum likelihood estimation of the unknown coefficient, an expectation-maximization algorithm is proposed, and the proposed modeling approach can be extended to identify the important covariates by adding the coefficient penalty term into the likelihood function. In addition to essential technical details, we demonstrate the usefulness of the proposed method by simulations and real examples.
I. I NTRODUCTION We consider the data generated from a stable manufacturing process. A total of n subjects are obtained, and each subject consists of a number of components. Along with each component, p predictors are observed. The anticipated response is the status of the component, defective or not. However, it is impractical to check the status of all components within each subject. The status of the subject, instead, is observed. For a particular subject, if its one or more components are defective, the subject is defective, and otherwise the subject is not defective. The goal of this work is to predict whether a subject is defective and to identify covariates that plausibly affect the defect rate especially when the pool of covariates is very large and only a few of them truly affects the defect rate. For the purpose of defect prediction, multiple-instance (MI) learning [2] is a solution. The difference between the traditional supervised learning and the MI learning is as follows. In the traditional supervised learning setting, the labels of each instance (components) are given, while in a typical MI setting, instances are grouped into bags (subjects) and only the labels of each bag are known, i.e. labels for the instance are missing. That is, we do not have the complete data for model fitting. To analyze MI data, the relationship between the instances and bags must be explicitly posited. Most of the research on MI learning is based on the standard MI assumption [6] which assumes that a positive bag contains at least one positive instance while a negative bag contains no positive instances and all instances in a negative bag must be negative. This assumption is hold throughout this article. Many methods have been proposed for MI learning. Most of these methods are extensions of support vector machine and logistic regression.
Other methods such as Diverse Density [7] and EM-DD [12] are also feasible. The first goal of this study focuses on using logistic regression to model MI data. This method is named multipleinstance logistic regression (MILR) in [11] and [9]. We first fix notation. Consider an experiment with n subjects (bags). Suppose that, for the ith subject, mi independent components (instances) are obtained. For the jth component of the ith subject, the data consists of binary response yij and the corresponding covariates xij , a p-dimensional vector. We model the response-predictor relationship by logistic regression; that is Yij ∼ Bernoulli(pij ) where pij = p(β0 + xTij β) with p(x) = 1/(1 + e−x ), β0 is a constant term and β is a p × 1 unknown coefficient vector. However, in this experiment, the labels of instances, yP ij ’s, are not observable. Instead, the labels m of the bags, Zi = I( j=1 Yij > 0)’s, is observed. The logistic regression for bags is therefore Zi ∼ Ber(πi ) where πi = 1 −
mi Y
(1 − pij )
(1)
j=1
Q with likelihood L(β0 , β) = ni=1 πizi (1 − πi )1−zi . Directly maximizing L with respect to β can be initial-value sensitive or unstable while the number of missing variables (the number of components per subject) increases. In literature, instead of maximizing the likelihood function L(β0 , β) directly, alternative likelihood functions were applied. Especially, several functions of (β0 , β) were proposed to model πi . For example, arithmetic mean and geometric mean of {pi1 , . . . , pimi } were used to model πi in [11] whereas the softmax function Si (α) =
mi X j=1
pij exp {αpij } /
mi X
exp {αpij }
j=1
were used to model πi in [9] where α is a pre-specified nonnegative value. According to the relationship between the bag and the associated instances, the geometric, the arithmetic
and the softmax function have the following relationship mi mi X X pij /mi = Si (0) log(pij )/n ≤ exp j=1 j=1 � i ≤ Si (α) ≤ max pij , ≤ P ∪m j=1 [Yij = 1] = πi j=1,...,mi
for all α > 0. Consequently, when using the same data, the resulting maximum likelihood estimates for these link functions should be different although the estimates of πi ’s may be similar. We conclude that directly tackling the likelihood function (1), if possible, is more relevant than others when parameter estimation is also an important goal of the experiment. In order to obtain the maximum likelihood estimates, an expectation maximization algorithm [1] is proposed because we treat the labels of the components as missing variables. Another goal of this work is to identify important covariates affecting the defect rate in both the instance and the bag levels and to predict the rate change when a covariate is changed. This goal supports the use of (1) because the regression coefficient estimate is essential to predict the rate change. When the number of covariates is large using the traditional variable selection tool such as Wald test is not efficient. Alternatively, maximum likelihood approach with LASSO penalty (Tibshironi, 1996) is promising. In this work, we incorporate the LASSO approach to the proposed MILR and provide an efficient computer algorithm for variable selection and estimation. Finally the important variables are identified if the corresponding coefficient estimations are nonzero. The rest of this article is as follows. In Section 2, we introduce expectation-maximization (EM; [1]) algorithm to find the maximum likelihood estimator of MILR. In Section 3, we discuss the technical details about how to integrate the LASSO approach to the MILR. In Section 4, we use simulation to demonstrate the benefit of using MILR in the standpoint of variable selection and parameter estimation in contrast to the naive method and other MILR methods. Finally, in Section 5, we use various datasets to evaluate the proposed method. II. M ULTIPLE -I NSTANCE L OGISTIC R EGRESSION EM A LGORITHM
WITH
Here, we follow the notation defined in previous section. When the labels of the instance level, yij ’s, are observed, the complete data likelihood function is mi n Y Y
y pijij (qij )1−yij
i=1 j=1
where qij = 1 − pij . However, in MI experiments, yij ’s are notPobservable and instead the labels of the bag level, Zi = mi I( j=1 Yij > 0)’s, are observed. Under this circumstance, the naive approach uses the likelihood LN (β0 , β) =
mi n Y Y
1−zi . pziji qij
i=1 j=1
by setting yij = zi for all j. The resulting testing and estimation for β0 and β is questionable since the probability
model does not fit the underlying data generating process. The idea of the naive approach is that since the instance labels are missing, the bag label is used to guess the instance labels. A better approach to treat missing data is the EM algorithm. To deliver the E-step, the complete data likelihood and the conditional distribution of missing data conditional on observed data are required. The complete data log-likelihood is straightforward, lC (β0 , β) =
mi n X X
yij log(pij ) + (1 − yij ) log(qij ).
i=1 j=1
The conditional distribution is discussed under two conditions. First, when Zi = 0, Pr(Yi1 = 0, . . . , Yimi = 0|Zi = 0) = 1, and second, when Zi = 1, Pr(Yij = yij for all j|Zi = 1) P i Qmi yij 1−yij × I( m yij > 0) j=1 pij qij Qmi j=1 = . 1 − l=1 qil
Thus, the required conditional expectations are
E(Yij |Zi = 0) = 0 and p Qijmi ≡ γij . E(Yij |Zi = 1) = 1 − l=1 qil
Because γij is a function of pij = p(β0 + xTij β), denote γij = γij (β0 , β). Consequently, for the ith subject, the Q function in the E-step is Qi (β0 , β | β0t , β t ) X yij log(pij ) + (1 − yij ) log(qij ) Zi = zi , β0t , β t =E j 1−zi zi X X t t log(qij ) = γij log(pij ) + (1 − γij ) log(qij ) j
=
X
j
t zi γij
t log(pij ) + (1 − zi γij ) log(qij )
j
=
X
T
t zi γij (β0 + xTij β) − log(1 + eβ0 +xij β )
j
t t where γij = γij (β0t , β t ) and β0t , βP are the estimate obtained t t in step t. Let Q(β0 , β | β0 , β ) = ni=1 Qi (β0 , β | β0t , β t ). Next, we move to the M-step, i.e. maximize Q with respect to (β0 , β). However, this Q is a nonlinear function of (β0 , β) and, consequently, the maximization is computational expensive. Following [6], we applied the quadratic approximation to the Q function. By taking Taylor expansion about β0t and
β t , we have
the small coefficient values to be zeros. Therefore LASSO type method [10] is adopted. Q(β0 , β | In order to perform estimation and variable selection at mi n X X the same time, we include LASSO penalty into our model t T β0 +xT β ij ) zi γij (β0 + xij β) − log(1 + e = to shrink the unimportant coefficients to zero. In this work, i=1 j=1 the intercept β0 is always kept in the model. The resulting m n i 1 XX t t T 2 t t optimization problem is therefore =− w [u − β0 − xij β] + C + R2 (β0 , β | β0 , β ) ( ) 2 i=1 j=1 ij ij p X t t min −QQ (β0 , β | β0 , β ) + λ |βk | . ≡QQ (β0 , β | β t , β t ) + C + R2 (β0 , β | β t , β t ) β0t , β t )
0
0
where C is a constant which is independent of β0 and β; R2 (β0 , β | β0t , β t ) is the remainder term;
t zi γij − ptij t t , wij = ptij qij , t ptij qij i−1 h t T t t , and qij = 1 − ptij . Using ptij = 1 + e−(β0 +xij β ) this quadratic approximation QQ (β0 , β | β0t , β t ), computing time can be boosted up to 20 times faster than the program without using approximation. Hereafter, we work on QQ (β0 , β | β0t , β t ) rather than Q(β0 , β | β0t , β t ). In the M-step, we have to solve the following maximization problem, max QQ (β0 , β | β0t , β t ).
utij = β0t + xTij β t +
β0 ,β
k=1
Shooting algorithm [5] is efficient to solve this optimization problem. The resulting updating formula is S0 β0t+1 = Pn Pmi t and i=1 j=1 wij Pn Pmi t (xij,k )2 if Sk > λ (Sk − λ)/ Pi=1 Pj=1 wij mi n t+1 t (Sk + λ)/ i=1 j=1 wij (xij,k )2 if Sk < −λ βk = 0 if |Sk | ≤ λ
for k = 1, . . . , p. To choose the optimal tuning parameter λ, we first determine the upper bound of λ, say λmax which enforces β to be t 0. We notice that γij > ptij and � � ( [1−ptij ]mi t ≤ mi−zi if zi = 1 ptij 1−[1−p t ] mi β0 ,β zi γij − ptij ≤ ij . ptij ≤ 1 if zi = 0 Since QQ (β0 , β | β0t , β t ) is a quadratic function of β0 and β, (3) the maximization problem is equivalent to finding the root of So when β t = 0, we have, for any k = 1, . . . , p, mi n X X X X ∂ t t t t xij,k (zi γij − ptij ) )= wij xij,k (utij − β0t − xTij β(k) wij xij,k (utij −β0 −xTij β) = 0 QQ (β0 , β | β0t , β t ) = ∂βk ij ij i=1 j=1 1/2 1/2 (2) X X for all k = 1, . . . , p, where xij,0 = 1 for all i, j, and βk i x2ij,k ≤ m−2z i is the kth element of β. Here we adopted coordinate decent ij ij algorithm (updating one coordinate at a time) proposed in #1/2 #1/2 " n " n X X [6]. Since (2) is a linear in terms of βk ’s, the updating 1−2zi ≡ λmax mi (mi − 1) = formula βk is straight forward. At step t + 1, let S0 = Pn Pfor mi t t T t i=1 i=1 i=1 j=1 wij (uij − xij β ) and where the first inequality is due to Cauchy-Schwarz inequality mi n X X and (3), and the equality right next to the inequality is due to t t t T t wij xij,k (uij − β0 − xij β(k) ), Sk = that xk ’s are normalized prior to data analysis. i=1 j=1 Several technical details are crucial to end up with an t where k = 1, . . . , p, and β(k) is β t with its kth element automatic parameter tuning. We follow the suggestion of [6] replaced by 0. The updating formula is to adjust our computer codes. First, we choose a sequence of λ, ranging from λmin = ǫλmax to λmax in a descending S k βkt+1 = Pn Pmi t (k = 0, . . . , p). order, say λ1 < λ2 < · · · < λK . Set ǫ = 0.001 and the 2 i=1 j=1 wij (xij,k ) length of the sequence K = 20. The optimal λ is chosen t III. P ENALIZED M ULTIPLE -I NSTANCE L OGISTIC among these K values. Second, when ptij qij is too small, the t R EGRESSION value of uij stored in computer may deviate from the true t −5 t In the manufacturing process, one important issue is to greatly. In this sequel, when pij > 1 − 10 we set pij = 1 t t t −5 t −5 and when pij < 10 we set identify the active factors within the process, especially for and wij = pij qij = 10 t t t t −5 large p. Traditionally the stepwise procedure is used to search pij = 0 and wij = pij qij = 10 . Finally, we choose the best the active covariates and after identifying these important tuning parameter by κ-fold cross validation. The procedure for covariates, the coefficients of these covariates are estimated choosing tuning parameter applied in this note is FOR i in the sequence of λ’s based on the current model. Here we want to integrate the Randomly split the data into κ subsets used for maximum likelihood coefficient estimation and the variable κ-fold cross-validation selection into one single procedure. Thus the idea is to shrike
IV. S IMULATION S TUDIES A. Naive vs MILR
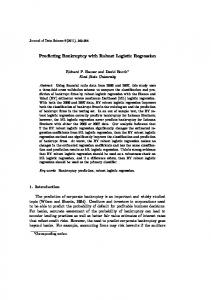
Fig. 1: Ten-fold cross-validation on the simulated data sets. The red line is the mean deviance and the blue lines are bounds for deviances within one standard error.
To demonstrate the powerfulness of the proposed model, we consider a simulation with data generating process as addressed in Section 4. We generated 100 datasets with n = 100, m = 3, β0 = −2, and β = (1, −1, 0). That is, we only generate 3 covariates and the third covariate is inactive to the response. Simulation results are summarized in Table I which shows that using the MILR results in unbiased estimations and more powerful (Wald) tests than using the naive method. As shown in Table I, the MLEs of MILR are empirically unbiased and more powerful in contrast to the naive method. Especially, the naive estimates of regression coefficients were severely attenuated which may result in relatively high prediction errors. This says that if the goal of data analysis is to identify important covariates then the Naive and the MILR approach may not yield drastically different results. However, if the goal is to predict whether change of one particular covariate can reduce the chance of being defect, then the naive approach may mislead the result.
2
TABLE I: (Average Estimate, Standard Error, Power) of Regression Coefficient Estimation / Testing
1
Active
β
0 Active
Method Naive
Inactive
MILR
−1
β0 = −2 (-0.19, 0.02, 0.39) (-2.29, 0.05, 0.93)
β1 = 1 (0.34, 0.01, 0.80) (1.28, 0.06, 0.86)
β2 = −1 (-0.33, 0.01, 0.77) (-1.02, 0.04, 0.87)
β3 = 0 (0.01, 0.01, 0.03) (0.04, 0.03, 0.06)
−2
B. MILR-LASSO
−3 −2
0
log(λ)
2
Fig. 2: The change of the estimated parameters with respect to the tuning parameter. The red lines stands for active covariates and the blue lines stands for inactive covariates.
FOR j = 1 to K i) Estimate the parameters using λ = λi and the whole data except for the jth subset ii) Compute deviance = −2 log likelihood using the estimated parameters and the jth subset END FOR Compute the mean and standard error of the 10 deviances END FOR Choose the optimal tuning parameter as the λ with the smallest mean deviance For demonstration, we set n = 100, mi = 3, p = 100 with only 5 out of them are active and κ = 10. The results are shown in Figures 1 and 2. The optimal λopt selected via deviance is 2.31.
In this example, we demonstrate the performance of the proposed method for large p small n cases. The data generating process is designed as follows. We generated B = 50 independent datasets. Each dataset consists of n subjects and each subject consists of m components. The response of the jth component nested in the ith subject, Yij , follows Ber(p(β0 + xTij β)) where xij ∈ ℜp is a p-dimensional vector randomly and independently sampled from the standard normal distribution. Pm The response of the ith subject is defined as Zi = I( j=1 Yij > 0). We simulated data with all possible configurations of factor n = 100 and m = 3. The number of predictors p is 100 excluding the intercept. For each data set, we randomly assigned −2, −1, 1, 2, 0.5, and 95 multiples of 0 to the regression coefficient of predictors. Last, λopt is the value which minimizes the deviance using 10-fold cross-validation. Following three variable selection schemes are considered: (A) MILR model with LASSO penalty; (B) MILR model with forward selection using Wald test with α = 0.05; and (C) Naive model with forward selection using Wald test with α = 0.05.
TABLE II: Variable Selection Results (n=100, m=3) Model (A) (B) (C)
True Positive 0.78 0.72 0.58
False Positive 0.15 0.06 0.07
True Negative 0.85 0.94 0.93
False Negative 0.22 0.28 0.42
From Table III, it is obvious that MILR-LASSO outperforms the other two methods, since over 95% of the predictors are nuisance variables. Furthermore, both BIC and 10-fold CV provide similar prediction results. Thus, for the sake of efficiency, we prefer using BIC to find the optimal model. V. C ASE S TUDIES
C. Compare with other methods To compare our MILR-LASSO with other MILR methods (MILR-s(3) from [9] and MILR-s(0) from [11]), we designed three different simulation schemes. The first scheme consider fixed m = 5; the second consider various mi with mean 5; and the third consider various mi with mean 65. These schemes mimicked the real datasets MUSK1 and MUSK2 which will be introduced in Section V. Some summary statistics about these datasets are listed in Table IV. The regression coefficients used to generate these simulated data sets are the estimated coefficients of the MUSK data sets using MILR-LASSO model. Hence, most of the coefficients are zeros (about only 5% of the coefficients are non-zero). Besides using 10-fold cross-validation to select the optimal λ, we also choose BIC to obtain optimal LASSO model which is more efficient for it only need a single fit [13]. The following are three different simulation schemes: (D) n = 100, p = 166, mi = 5 for all i = 1, ..., n (E) n = 100, p = 166, mi ∼ P oisson(4) + 1 (similar to MUSK1 dataset shown in Case Studies ) (F) n = 100, p = 166, mi ∼ P oisson(64) + 1 (similar to MUSK2 dataset shown in Case Studies) We set mi ∼ P oisson(4) + 1 instead of mi ∼ P oisson(5) to avoid the case of mi = 0. Then we used 10-fold stratified cross-validation to test these algorithms. To generate the ˆ subject-level prediction from the estimated coefficients (βˆ0 , β) of these algorithms, we use 0.5 as a threshold. Thus, Zˆi = I(1 −
mi Y
(1 − pˆij ) ≥ 0.5),
ˆ To evaluate these three algorithms, where pˆij = p(βˆ0 + xTij β). two summary statistics are reported: accuracy (ACC), and the area under the ROC curve (AUC). Also, each algorithm is repeated B = 100 times. TABLE III: Predicted results of different methods on simulated data sets
(E)
(F)
TABLE IV: Information about these two data sets Data set MUSK1 MUSK2
p 166 166
m ¯† 5.17 64.69
n Sample Size 92 476 102 6598 †: the average bag size.
Prop. of Positive Subj 51.08% 38.24%
To apply MILR-LASSO on these data sets, first we choose the tuning parameter (λ) via 10 fold cross-validation. Then, use the selected λ to fit the data sets. To avoid the likelihood from being only locally optimal, we replicate each algorithm 10 times and average their performance. The right halves of the Tables V and Table VI are the predicted results (10-fold crossvalidation) of three different algorithms and the left halves of Table V and Table VI are the fitted results. From Tables V and VI, we can see that no algorithm is consistently better than the others. However, MILR-LASSO has the strength to select important features when estimating the coefficients. VI. C ONCLUSION
j=1
Scheme (D)
The MUSK data sets are the most widely used benchmark data sets when comparing different MI learning methods. The MUSK datasets consist of conformations. Each conformation is represented by 166 features. In MUSK1, the average conformation in one bag is 5; whereas, in MUSK2, the average conformation in one bag is 65. More descriptive statistics about these datasets are shown in Table IV. For more detailed descriptions, please refer to [2].
Method MILR-LASSO(BIC) MILR-LASSO(10-fold CV) MILR-s(3) MILR-s(0) MILR-LASSO(BIC) MILR-LASSO(10-fold CV) MILR-s(3) MILR-s(0) MILR-LASSO(BIC) MILR-LASSO(10-fold CV) MILR-s(3) MILR-s(0)
ACC 0.61(0.008) 0.64(0.008) 0.58(0.004) 0.58(0.005) 0.70(0.007) 0.70(0.007) 0.58(0.004) 0.58(0.004) 0.82(0.003) 0.82(0.003) 0.18(0.003) 0.18(0.003)
AUC 0.62(0.012) 0.61(0.014) 0.57(0.009) 0.57(0.009) 0.75(0.009) 0.75(0.009) 0.59(0.008) 0.58(0.009) 0.53(0.006) 0.53(0.007) 0.46(0.009) 0.45(0.011)
In this work, the multiple instance learning is treated as a classical missing value problem and solved by EM algorithm. In addition, the lasso approach is applied to identify important covariates. This treatment allows us to figure out influential covariates, to predict defect rate, and, most importantly, to direct TABLE V: Fitted and predicted results of different methods on MUSK1 data set Method MILR-LASSO MILR-s(3) MILR-s(0)
Fitted ACC AUC 1.00 1.00 0.85 0.96 0.87 0.93
Predicted ACC AUC 0.79 0.83 0.72 0.76 0.74 0.79
TABLE VI: Fitted and predicted results of different methods on MUSK2 data set Method MILR-LASSO MILR-s(3) MILR-s(0)
Fitted ACC AUC 0.87 0.96 0.99 1.00 0.95 1.00
Predicted ACC AUC 0.69 0.76 0.74 0.83 0.79 0.85
ways to potentially reduce the defect rate by adjusting covariates. The limitations of the proposed method are as follows. First, we ignore the potential dependency among observations within a subject. Random effects can be incorporated into the proposed logistic regression to represent the dependency. Second, in a preliminary simulation study, not shown in this paper, we discovered that the maximum likelihood estimator is biased under the model (F). Bias reduction methods such as [8] and [3] will be applied in our future work. R EFERENCES [1] A. P. Dempster, N. M. Laird, and D. B. Rubin. (1977) “Maximum Likelihood from Incomplete Data via the EM Algorithm”. Journal of the Royal Statistical Society, Series B, 39, 1–38. [2] T. G. Dietterich, R. H. Lathrop, and T. Lozano-P`erez. (1997) “Solving the multiple instance problem with axis-parallel rectangles”. Artificial Intelligence, 89, 31–71. [3] D. Firth. (1993) “Bias reduction of maximum likelihood estimates”. Biometrika, 80, 27–38. [4] J. Foulds, and E. Frank. (2010) “A review of multi-instance learning assumptions”. The Knowledge Engineering Review, 25, 1–25. [5] W. Fu. (1998) “Penalized regressions: the bridge versus the lasso”. Journal of Computational and Graphical Statistics, 7, 397–416. [6] J. Friedman, T. Hastie, and R. Tibshirani. (2010) “Regularization paths for generalized linear models via coordinate descent”. Journal of Statistical Software, 33. [7] O. Maron (1998) “Learning from ambiguity”. Ph. D. Thesis, Massachusetts Institute of Technology. [8] M. H. Quenouille. (1956) “Notes on Bias in Estimation”. Biometrika, 43, 353–360. [9] S. Ray, and M. Craven. (2005) “Supervised versus multiple instance learning: An empirical comparsion”, in Proceedings of the 22nd International Conference on Machine Learnings, ACM, 697–704. [10] R. Tibshirani. (1996) “Regression shrinkage and selection via the lasso”. Journal of the Royal Statistical Society, Series B, 58, 267–288. [11] X. Xu, and E. Frank. (2004) “Logistic regression and boosting for labeled bags of instances”. In Advances in knowledge discovery and data mining, Springer, 272–281. [12] Q. Zhang, and S. A. Goldman. (2001) “Em-dd, An improved multipleinstance learning technique”. In: Advances in neural information processing system, 1073–1080. [13] H. Zou, T. Hastie, and R. Tibshirani. (2007) ”On the degrees of freedom of the lasso”. In: The Annals of Statistics, 2173–2192.