IMPACT OF TEST DESIGN, ITEM QUALITY, AND ITEM BANK SIZE ON THE PSYCHOMETRIC PROPERTIES OF COMPUTER-BASED CREDENTIALING EXAMINATIONS1 Dehui Xing Ministry of Education, British Columbia Ronald K. Hambleton University of Massachusetts at Amherst
Mailing Address for Correspondence Ronald K. Hambleton University of Massachusetts Hills South, Room 152 Amherst, MA 01003 413-545-0262 email:
[email protected]
April 18, 2002
1
Paper presented at the meeting of the National Council on Measurement in Education, New Orleans, 2002.
IMPACT OF TEST DESIGN, ITEM QUALITY, AND ITEM BANK SIZE ON THE PSYCHOMETRIC PROPERTIES OF COMPUTER-BASED CREDENTIALING EXAMINATIONS1 Dehui Xing Ministry of Education, British Columbia Ronald K. Hambleton University of Massachusetts at Amherst
Abstract Computer-based testing with many credentialing examination agencies has become a common occurence. At the same time, selecting a test design is difficult because several are available—parallel-forms, computer-adaptive (CAT), and multi-stage (MST), and the merits of these designs interact with exam conditions. These conditions include item quality, bank size, candidate score distribution, placement of the passing score, exam length, and more. In this study three popular computer-based test designs under some common examination conditions were investigated using computer simulation techniques. Item quality and bank size were varied. The results from the study were clear: both item bank size and item quality had a practically significant impact on decision consistency and accuracy. Interestingly, even in nearly ideal situations, the choice of test design was not a factor in the results. Two conclusions seem to follow from the findings: (1) more time and resources should be committed to expanding both the size and quality of item banks, and (2) designs that individualize an exam administration such as MST and CAT, may not be especially helpful when the primary purpose of an examination is to make pass-fail decisions, and conditions are present for using parallel-forms of examinations with a target information function that can be centered at the passing score. Obviously, the validity of these conclusions needs to be thoroughly checked with additional simulations and real data.
1
Paper presented at the meeting of the National Council on Measurement in Education, New Orleans, 2002.
2
IMPACT OF TEST DESIGN, ITEM QUALITY, AND ITEM BANK SIZE ON THE PSYCHOMETRIC PROPERTIES OF COMPUTER-BASED CREDENTIALING EXAMINATIONS1 Dehui Xing Ministry of Education, British Columbia Ronald K. Hambleton University of Massachusetts at Amherst
Introduction With the introduction of computer technology and item response theory (IRT) into testing practices, many computer-based test (CBT) designs have been proposed and are being used with credentialing examinations (see, for example, credentialing exams being produced by the National Association of Security Dealers, Microsoft, Novell, Educational Testing Service, and the National Board of Medical Examiners). Use of the computer in exam administration opens up the possibility for individualizing the sequence of exam items or blocks of items to candidates, and IRT provides a measurement framework for statistically adjusting candidate scores when non-equivalent forms of an examination are used (see, for example, Hambleton, Swaminathan, & Rogers, 1991). Computer-based test designs range from the simplest linear computer-based test design (basically, paper and pencil parallel-forms of an examination administered at a computer terminal) to the most sophisticated computer adaptive testing designs (see van der Linden & Glas, 2000; Wainer et al., 2000). While there are many computer-based test designs for credentialing agencies to choose from, each of these designs has its strengths and weaknesses, and they interact with conditions present with each credentialing exam. For example, in a recent study by Jodoin, Zenisky, and Hambleton (2002), these researchers studied the advantages of multi-stage tests (MSTs) versus parallel-forms of an exam but found that the item bank used in exam construction would not permit the construction of optimal MSTs. The concept of a MST design certainly has considerable promise (Lord, 1980) but the item bank could not support it fully. Decisions about test design should be made in each exam situation by considering the use or uses of the examination, and the practical consequences of variables such as item bank size, the quality of items in the bank, test length, the ability distribution of candidates, the placement of the passing score, the desired item exposure level, and more. The test design an exam agency chooses can play an important role in both minimizing decision making error and increasing test efficiency. There is no doubt that comparative studies of computer-based test designs have made important contributions to the development of computer-based credentialing exams. However, perhaps equally or more important, may be the resources available to the test developer when implementing a CBT: the item bank, and to be more specific, the number of items in the bank, the content and statistical quality of the items, 1
Paper presented at the meeting of the National Council on Measurement in Education, New Orleans, 2002.
3
and the statistical suitability of the items to construct the desired exams. Study is needed to look into the effects of these important variables on the psychometric quality of computer-based credentialing exams using various CBT designs and realistic test design parameters. The best test design in the world cannot compensate for items lacking in content validity and desirable statistical properties to construct the examination of interest. Also, it is important to consider decision consistency and decision accuracy since these are the relevant criteria for judging credentialing exams. Studies comparing the accuracy of ability estimates, or classical reliability estimates, are only indirectly related to the criteria of interest for single-purpose credentialing exams. This study is an extension of a previous study (see, Xing & Hambleton, 2001) addressing the impact of selected testing variables on the psychometric properties of computer-based credentialing exams. Some of the main findings from this study were: (1) improvements in item quality had the desirable effect of increasing decision accuracy and decision consistency by a practically significant amount, (2) doubling bank size helped significantly in lowering item exposure but had little impact on decision accuracy and decision consistency, and (3) the CAT design did not show the expected amount of improvement in decision accuracy and consistency over the linear parallel form test (LPFT) or the multi-stage test (MST) designs. Although a comparative study was set up involving three commonly applied computer-based test designs, linear parallel-form test (LPFT), multi-stage test (MST), and an adaptive test (CAT) (Lord, 1980; Luecht, 1998), the emphasis was on the impact of item quality (as reflected by the average level of discrimination parameters in the item bank), the item bank size, and their interactions with the psychometrical properties of credentialing examinations. Rather than looking for optimal test designs, the Xing-Hambleton study considered the practical consequences of several important test design variables on a popular variation of each test design. There were several shortcomings of the study. First, the average level of item discrimination parameters in the item banks did not differ sufficiently to investigate fully the importance of this variable. Second, item bank size was allowed to influence exposure levels but bank size was not considered in the setting of target information functions. Obviously, with more items to choose from in test construction, target information functions can be increased. The researchers concluded that a revised and improved study was very much in order. In the current study, the purpose was to investigate the impact of some important test design parameters on the psychometric properties of credentialing exams through evaluation and comparison of different computer-based test designs: LPFT, MST, and CAT. The test design parameters varied were: (1) item bank size, (2) item quality, i.e. the level of average item discrimination parameters, and (3) test administration design. All these variables are highly manipulable in practice and therefore their roles seemed to be especially worthy of investigation. To the extent possible, realistic situations were simulated to increase the generalizability of the findings. Methodology Item Bank The item banks for the study were simulated to reflect the general characteristics of an existing credentialing examination. The original item bank contained 240 items. All test items, scored 0-1, were calibrated with the three-parameter logistic model (Lord, 1980). True item 4
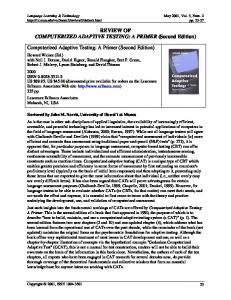
parameter distributions for a (slope), b (difficulty), and c (guessing), were randomly drawn from log normal (LN) (1.0,0.25), normal (N) (0.0, 1.5), and uniform (U) (0.0, 0.35) distributions, respectively, to simulate multiple-choice items with various degrees of discrimination, difficulty, and guessing, respectively. Items were randomly assigned to one of five content categories. Each test, regardless of design, consisted of equal numbers of items from each content category. The bank itself was designed to provide many items discriminating in the general region of the passing score. This is easily seen in Figure 1. Candidate Population A sample of 3,000 candidates was drawn from a normal distribution of proficiency or ability and used in each simulation. This sample size was large enough to minimize sampling errors in the statistics of interest. In this study, the item bank was optimally positioned in relation to the ability distribution and the passing score to maximize the quality of measurements that was possible. This meant that the statistical information provided by all six-item banks (to be described in more detail below) was a maximum in the region on the ability scale where most of the candidates were located. [Insert Figure 1 and Table 1 about here] Table 1 provides the descriptive statistics for the candidate samples and the item parameters for the original 240 item item bank. Figure 1 shows information functions for six item banks with two levels of bank size (240 and 480) and three levels of average a-parameters for items in the bank (.60, 1.0, and 1.4). One interesting observation seen in Figure 1 is that the “poor” item bank with double the number of items (n=480) was generally more informative than the “best” item bank with half the number of items (n=240). Clearly, even in the relatively poor item bank there was potential for selecting some statistically useful items. CBT Test Designs Linear Parallel-Form Test Design. Five non-overlaping 35 item linear parallel forms were assembled from each of the six item banks. As these five forms were used randomly during the test administration, an item exposure rate of .20 was maintained. All forms were assembled to meet the same content specifications and to optimally discriminate in the neighbourhood of the passing score for the exam. Multi-Stage Test Design. A two-stage test design was used with a routing test and three second stage modules or testlets—20 items in the routing test, and 15 items in the second stage tests. There were three pathways following the routing test--easy, moderate, and hard, for a MST design, targeted at three points on the ability continuum (-1.04, 0.0, and 1.01). Cut-scores on the ability continuum were selected to sort candidates into equal numbers receiving each second stage module. Computerized Adaptive Test Design. A computerized adaptive test with a fixed test length of 35 items and that met the content specifications was selected for each candidate. The maximum information selection procedure was used subject to the content constraints (see Lord, 1980). Item exposure was held to a value of .20. In CAT, initial ability estimates used in selecting the first test item were set by a random draw from an ability interval ranging from one 5
standard deviation below the target population mean to the target population mean so as to start each test with moderately easy items. Item Bank Size Modest item bank sizes remain a problem in practice because good items are not easy to come by due to technical or financial reasons. Also, the rapid development of the knowledge or technology an examination is concerned with creates the demand for a constant flow of new items. With the availability of many good items, two options are available—increasing the target test information without increasing test length, or maintaining the level of target test information and lowering the level of item exposure because more forms can be constructed with the additional test items. In this study, this design variable, item bank size, was set at two values: 240 items for the original bank and 480 items for a double-sized bank. In practice, with techniques such as item cloning and item generation algorithms, it is not unreasonable to think that the size of an item bank could be doubled and an item exposure level close to .10 could be maintained. Item Quality Lack of item quality is another serious problem with which credentialing agencies are concerned. It is difficult to get enough items. It is especially difficult to produce content valid and statistically desirable items. Measures have been taken in training item writers or resorting to other techniques such as “item cloning” (Pitoniak, 2002). Bank management strategies have also been suggested, such as the stratification of the items in a bank according to their discriminating power so as to ensure a more proportional use of the items in a bank, good ones or not (Chang & Ying, 1999). Again, since high quality items are not easy to prepare, it would be important to know how and to what degree the item quality impacts the accuracy in decisionmaking. In the study, the average a-parameter in the item banks was controlled at three levels: an average of 1.00 (the original bank), an average of 0.60 (the poor item bank), and 1.40 (the improved item bank). These values are meaningfully interpreted when ability is scaled to a mean of zero and a standard deviation of one. The “best” bank is probably quite unrealistic in practice, but our goal was to see what the impact might be of a set of test items with unusually high levels of item discrimination. What we are calling a “poor” bank is not so very atypical with credentialing agencies who are not able to field test items in advance, or to use of the services of professional item writers. Item quality is defined in this study as the average of the discriminating powers of items in an item bank. In practice, item quality would be defined in terms of both discriminating power and coverage of the content specifications. The latter is important but was not addressed in this simulation study, except in a general way by building in some minimal content constraints to any tests that were constructed. Ability Estimation Algorithm The ability estimation and examinee scoring were handled using expected a posteriori 6
(EAP) estimation (see Bock & Mislevy, 1982). To reduce estimation bias, a relatively weak normal prior was set, with the mean equal to the mean of the candidate population and the standard deviation twice that of the candidate population. The ability scores were selected from a normal distribution with mean 0.0 and a standard deviation of 1.0. Test Length A fixed test length of 35 items was chosen for the LPFT, MST, and CAT designs. This allowed the effects of test adaptation to candidate performance to be studied while controlling for the length of the test. With a test length of 35 items, five LPFT parallel forms would use 175 items, or 73% of the original bank (n=240) and maintain an item exposure level of 0.20. A similar exposure level was maintained with the CAT. With the MSTs, 190 of 240 items were used (or 79% of the items in the original item bank)—five 20 item versions of the routing test (5 x 20 = 100 items), and parallel forms of 15 items for each second stage test (2 x 3 x 15 = 90 items). Thirty-five item tests are on the short side for credentialing exams, though not uncommon with some credentialing exams in the IT field, and of about the same size as sections of the Graduate Management Admissions Test (GMAT) and the Graduate Record Exam (GRE). Exposure Rate Instead of looking at which test situation may yield the lowest exposure rate, the exposure rate with the 240 item bank was held constant in the study to a desired value of 0.20 (or as close to .20 as possible—it was slightly lower than .20 with the second stage modules in the MST design) while the bank usage was investigated under this same exposure level. With the larger bank of items (n=240) the item exposure level was dropped to .10 though since a simulation study was conducted, the item exposure level is of no importance. Of course, in practice, it would be immensely important. Evaluation Criteria One of the useful features of a computer simulation study is that each candidate can have a known ability level, and associated true mastery state—master or non-master--that is obtained by comparing the candidate’s true ability (generated during the simulations) to the passing score. Decision accuracy (DA) is the proportion of decisions resulting from a test administration that are in agreement with the true states of candidates. Since decision accuracy is an indicator of whether a decision made reflects truth, it can be seen in its essence as a measure of validity. Decision consistency (DC) and kappa (K) statistics were also obtained by simulating each candidate through parallel administrations and then determining the consistency of mastery decisions over parallel procedures. Results Forty-two analyses were carried out on the LPFT, MST, and CAT designs with all six item banks with a passing score set to give a passing rate of 50% using a software package prepared by Robin (2000). This passing rate would be low for many exams, but our goal was to set the passing score in a difficult place (=0.0) to achieve high levels of decision consistency and decision accuracy, and this in the middle of a normal distribution of ability. 7
Figure 2 shows the target information function for the LPFT design and the test information functions for the five tests that were constructed from the smaller bank with the poorer quality test items. The match is excellent, and test information is about 8.0 for candidates near the passing score. Figure 4 shows a similar pattern for the better item bank with 240 items. Test information is about 12.0 around the passing score. The match is not perfect at the lower end of the ability continuum. A shortage of easier items and/or less discriminating easy items makes a perfect match impossible. Still, the fit was very good overall. Figure 6 shows the target and test information functions obtained from the best item bank (n=240). Notice the test information in the region of the passing score is up to 16.0, almost double the test information function obtained with the poorer item bank. Figures 8, 10, and 12 show the target and test information functions obtained with the larger banks. All of the banks supported good matches of the tests to the targets, and for all of the tests, the test information functions were somewhat higher than the corresponding test information functions obtained with the smaller item banks, as should be the case. The test information functions went from 10.0 to 18.0 to about 27.0 with the poor, medium, and best item banks, respectively. [Insert Figures 2, 4, 6, 8, 10, and 12, and Tables 2 and 3 about here] Tables 2 and 3 provide the decision accuracy and decision consistency statistics for the LPFT design with a passing rate of 50%, when five parallel forms were used individually, under all six item bank conditions. (The results with the original item bank are presented in Table 2; the results with the double-sized item bank are presented in Table 3.) The individual runs under similar conditions produced quite similar results. The averages over five replications with each bank size are shown at the bottoms of Tables 2 and 3 (see the averages). Basically, the results are clear: (1) Improvements in DA were of the order of .02 across the three banks—poor, original, improved (smaller bank--.885 to .906 to .922; larger bank--.902 to .923 to .938); (2) improvements in DC were of the order of .02 to .04 across the three banks (smaller bank--.830 to .868 to .884; larger bank--.854 to .888 to .910); and (3) kappa statistics showed the same patterns as the DC statistics. The advantages of the better item banks and larger numbers are obvious. Differences would be both statistically significant and practically significant. As for the practical significance, consider the gain in DA from .885 to .922 obtained with the original item bank. With, say, 10,000 candidates, a 4% improvement in DA would affect the pass-fail status of 400 candidates. Figure 3 shows the module and pathway information functions obtained with the poor item bank with 240 items. The relatively low module information function in the figure corresponds to the routing test and the medium difficult second stage module (the same information function was used for both). The other relatively low module information functions correspond to the easy and hard second stage modules, respectively. The three higher information functions in the figure correspond to the information functions for the three possible pathways through the two stage test—(1) routing test, easy module at stage two, (2) routing test, medium difficult module at stage two, and (3) routing test, hard module at stage two. What is clear is that that MST design provides about as much information as the LPFT from the same bank (see Figure 2) at the passing score, but provides more information over a wider range of 8
ability scores near the passing score than the corresponding LPFT. Similar results are seen in Figures 5, 7, 9, 11, and 13. The better (i.e., higher level item discrimination) and bigger the item bank, the higher the pathway information functions, and the more information the MST design is providing across a wide range of ability. [Insert Figures 3, 5, 7, 9, 11, and 13, and Tables 4 and 5 about here] Tables 4 and 5 provide the main findings with the three test designs, the tests represented in Figures 2 to 13, and the six item banks. The results are clear again: the quality of the item bank and bank size had an impact on the findings, but the choice of test design, as implemented in this study, did not. Actually, there was one small effect: In the larger item bank, the CAT design functioned a bit better than the other two designs (the difference was about .01). Conclusions The findings reported in this study should be important to credentialing agencies because questions about the roles of item quality, item bank size, and choice of test design are frequently asked. Item quality has a practically significant impact on the results, and so did item bank size. At the same time, increasing item quality and expanding the size of an item bank is going to take money and time to implement in practice. Improved training for item writers, and perhaps the expansion of the number of writers, along with more model items to guide the item writing process, are all helpful suggestions. Item cloning and item algorithmic procedures may ultimately be useful too for extending item banks with quality items (see, for example, Pitoniak, 2002, for an excellent review). Van der Linden and Veldkamp’s work to guide the development of optimal item banks will be helpful in reducing the expansion of item banks in unproductive ways. It is not simply having more items in an item bank, but having more items in the appropriate content categories that is needed. What is being highlighted in this study are the advantages of developing highly discriminating test items because their impact can be clearly seen in the levels of decision accuracy and decision consistency that are achievable in practice. Either improve and extend the numbers of items in an item bank and accept the higher levels of reliability and validity, or possibly consider shortening tests and achieving results similar to those obtained with the poorer quality item banks. That the three test designs are producing similar results highlights that when the purpose of an exam is to make pass-fail decisions, the extra measurement precision of CAT and MST over a fixed form design may not be a special advantage. What is needed only is good measurement precision around the passing score. The study also highlights the impact of test content and statistical specifications on the functioning of various test designs. Choose the wrong specifications and the designs will not achieve their full potential. At the same time, it is easy to see that the uses of credentialing exams in the future might be expanded to go beyond simply making reliable and valid pass-fail decisions. Diagnostic score reporting, awarding of prizes to the best candidates, and reporting individual scores along with pass-fail decisions, will all capitalize on the extra measurement precision provided by MSTs and CATs. Clearly more research to compare CBT designs, the three used in this study, and others in the measurement literature (see, van der Linden & Glas, 2000; Wainer, et al., 2000), under new conditions and with exams designed to achieve multiple purposes are in order.
9
References Bock, B. D., & Mislevy, R. J. (1982). Adaptive EAP estimation of ability in a microcomputer environment. Applied Psychological Measurement, 6, 431-444 Chang, H. H., & Ying, Z. (1999). A-stratified multi-stage computerized adaptive testing. Applied Psychological Measurement, 23, 211-222. Hambleton, R. K., Swaminathan, H., & Rogers, H. J. (1991). Fundamentals of item response theory. Newbury Park, CA: Sage Publications. Jodoin, M., Zenisky, A., & Hambleton, R. K. (2002). Comparison of the psychometric properties of several computer-based test designs for credentialing exams. Paper presented at the meeting of NCME, New Orleans. Lord, F. M. (1980). Applications of item response theory to practical testing problems. Hillsdale, NJ: Lawrence Erlbaum Associates. Luecht, R. M. (1998). Computer-assisted test assembly using optimization heuristics. Applied Psychological Measurement, 22, 224-236. Pitoniak, M. (2002). Automatic item generation methodology in theory and practice (Center for Educational Assessment Research Report No. 444). Amherst, MA: University of Massachusetts, School of Education. Robin, F. (2000). CBTS: Computer-based testing simulation and analysis [computer software]. Amherst, MA: University of Massachusetts, School of Education. van der Linden, W. J., & Glas, C. A. W. (2000). Computer adaptive testing: Theory and practice. Boston, MA: Kluwer Academic Publishers. Veldkamp, B. P., & van der Linden, W. J. (2000). Designing item pools for computerized adaptive testing. In W. J. van der Linden, & C. A. Glas (Eds.), Computer adaptive testing: Theory and practice. Boston, MA: Kluwer Academic Publishers. Wainer, H., et al. (Eds.). (2000). Computerized adaptive testing: A primer (2nd ed.). Mahwah, NJ: Lawrence Erlbaum Publishers. Xing, D., & Hambleton, R. K. (2001). Impact of several compouter-based testing variables on the psychometric properties of credentialing examinations (Laboratory of Psychometric and Evaluative Research Report No. 393). Amherst, MA: University of Massachusetts, School of Education.
Version: March 30, 2002 10
200 Poor-240 Original-240 Improved-240 Poor-480 Original-480 Improved-480
180 160
Test Information
140 120 100 80 60 40 20 0 -3
-2
-1
0
1
2
3
Ability
Figure 1 Information functions of six item banks with two levels of bank size and three levels of average a-parameters for items in the bank. Table 1 Candidate and Item Parameter Statistics Variable Mean S.D. Min. Ability Parameters (N = 3,000) 0.00 0.98 -3.00
Max. 3.00
Item Parameters (n = 240) b a c
2.47 1.53 0.35
0.17 0.99 0.18
1.16 0.24 0.10
11
-2.38 0.40 0.00
Table 2 Decision Accuracy and Decision Consistency (LPFT, 5 forms, Passing Score =0.0, Test length = 240) Poor Item Bank Original Item bank Improved Item Bank DC K DA DC K DA DC K DA 1 0.838 0.676 0.890 0.864 0.728 0.908 0.894 0.787 0.929 2 0.829 0.657 0.879 0.869 0.737 0.896 0.874 0.749 0.914 3 0.830 0.661 0.881 0.865 0.731 0.901 0.890 0.780 0.918 4 0.827 0.655 0.883 0.873 0.746 0.902 0.882 0.764 0.920 5 0.825 0.654 0.890 0.870 0.735 0.923 0.881 0.763 0.931 Mean 0.830 0.661 0.885 0.868 0.735 0.906 0.884 0.769 0.922 Table 3 Decision Accuracy and Decision Consistency (LPFT, 5 forms, Passing Score =0.0, Test length = 480) Poor Item Bank Original Item bank Improved Item Bank DC K DA DC K DA DC K DA 1 0.864 0.728 0.904 0.890 0.780 0.928 0.909 0.819 0.937 2 0.856 0.713 0.901 0.894 0.789 0.922 0.915 0.830 0.937 3 0.848 0.697 0.901 0.885 0.769 0.915 0.906 0.811 0.934 4 0.851 0.702 0.898 0.885 0.769 0.919 0.909 0.817 0.946 5 0.850 0.711 0.907 0.887 0.771 0.929 0.911 0.818 0.936 Mean 0.854 0.710 0.902 0.888 0.776 0.923 0.910 0.819 0.938
LPFT MST CAT
Table 4 Decision Accuracy and Decision Consistency (LPFT, MST, and CAT, Passing Score =0.0, Test length = 240) Poor item Bank Original Item Bank Improved Item Bank DC K DA DC K DA DC K DA 0.830 0.661 0.885 0.868 0.735 0.906 0.884 0.769 0.922 0.825 0.651 0.881 0.864 0.727 0.909 0.889 0.778 0.919 0.833 0.667 0.877 0.875 0.751 0.907 0.895 0.791 0.926
LPFT MST CAT
Table 5 Decision Accuracy and Decision Consistency (LPFT, MST, and CAT, Passing Score =0.0, Test length = 480) Poor Item Bank Original Item Bank Improved Item Bank DC K DA DC K DA DC K DA 0.854 0.710 0.902 0.888 0.776 0.923 0.910 0.819 0.938 0.855 0.712 0.908 0.888 0.775 0.921 0.919 0.837 0.935 0.869 0.738 0.913 0.894 0.787 0.928 0.921 0.843 0.941
12
20.0 18.0
Test Information
16.0 14.0
LPFT1
12.0
LPFT2 LPFT3
10.0
LPFT4 LPFT5
8.0
Target
6.0 4.0 2.0 0.0 -3
-2
-1
0
1
2
3
Ability
Figure 2 LPFT target and test form information (n = 240, ā = 0.60) 20.0 18.0 16.0
Test Information
14.0 E
12.0
M H
10.0
A B
8.0
C D
6.0 4.0 2.0 0.0 -3
-2
-1
0
1
Ability
Figure 3 MST target and module information (n = 240, ā = 0.60) 13
2
3
20.0 18.0
Test Information
16.0 14.0
LPFT1
12.0
LPFT2 LPFT3
10.0
LPFT4 LPFT5
8.0
Target
6.0 4.0 2.0 0.0 -3
-2
-1
0
1
2
3
Ability
Figure 4 LPFT target and test form information functions (n = 240, ā = 1.00) 20.0 18.0 16.0
Test information
14.0
E M
12.0
H
10.0
A B
8.0
C D
6.0 4.0 2.0 0.0 -3
-2
-1
0
1
2
Ability
Figure 5 MST target and module information functions (n = 240, ā = 1.00) 14
3
20.0 18.0
Test Information
16.0 14.0
LPFT1
12.0
LPFT2 LPFT3
10.0
LPFT4 LPFT5
8.0
Target
6.0 4.0 2.0 0.0 -3
-2
-1
0
1
2
3
Ability
Figure 6 LPFT target and test form information functions (n = 240, ā = 1.40) 20.0 18.0 16.0
Test information
14.0
E M
12.0
H
10.0
A B
8.0
C D
6.0 4.0 2.0 0.0 -3
-2
-1
0
1
2
Ability
Figure 7 MST target and module information functions (n = 240, ā = 1.40) 15
3
20.0 18.0
Test Information
16.0 14.0
LPFT1
12.0
LPFT2 LPFT3
10.0
LPFT4 LPFT5
8.0
Target
6.0 4.0 2.0 0.0 -3
-2
-1
0
1
2
3
Ability
Figure 8 LPFT target and test form information functions (n = 480, ā = 0.60) 20.0 18.0 16.0
Test information
14.0
E M
12.0
H
10.0
A B
8.0
C D
6.0 4.0 2.0 0.0 -3
-2
-1
0
1
2
Ability
Figure 9 MST target and module information functions (n = 480, ā = 0.60) 16
3
20.0 18.0
Test Information
16.0 14.0
LPFT1
12.0
LPFT2 LPFT3
10.0
LPFT4 LPFT5
8.0
Target
6.0 4.0 2.0 0.0 -3
-2
-1
0
1
2
3
Ability
Figure 10 LPFT target and test form information functions (n = 480, ā = 1.00) 20.0 18.0 16.0
Test information
14.0
E M
12.0
H
10.0
A B
8.0
C D
6.0 4.0 2.0 0.0 -3
-2
-1
0
1
2
Ability
Figure 11 MST target and module information functions (n = 480, ā = 1.00) 17
3
30.0
Test Information
25.0
LPFT1
20.0
LPFT2 LPFT3
15.0
LPFT4 LPFT5 Target
10.0
5.0
0.0 -3
-2
-1
0
1
2
3
Ability
Figure 12 LPFT target and test form information functions (n = 480, ā = 1.40) 30.0
Test information
25.0
E
20.0
M H A
15.0
B C D
10.0
5.0
0.0 -3
-2
-1
0
1
2
Ability
Figure 13 MST target and module information functions (n = 480, ā = 1.40) 18
3